Open Access
Research article
Impaired immune function in Gulf War Illness
Toni Whistler*
1, Mary Ann Fletcher
2,3, William Lonergan
1, Xiao-R Zeng
2,3,
Jin-Mann Lin
1, Arthur LaPerriere
2, Suzanne D Vernon
1,4and
Nancy G Klimas
2,3Address: 1Chronic Viral Diseases Branch, Centers for Disease Control & Prevention, Atlanta, GA, USA, 2Medical Service, Miami Veterans Affairs Medical Center, Miami, FL, USA, 3Department of Medicine, University of Miami Miller School of Medicine, Miami, FL, USA and 4Current address : The Chronic Fatigue and Immune Dysfunction Syndromes (CFIDS) Association of America, Charlotte, NC, USA
Email: Toni Whistler* - [email protected]; Mary Ann Fletcher - [email protected]; William Lonergan - [email protected]; Xiao-R Zeng - [email protected]; Jin-Mann Lin - [email protected]; Arthur LaPerriere - [email protected];
Suzanne D Vernon - [email protected]; Nancy G Klimas - [email protected] * Corresponding author
Abstract
Background: Gulf War Illness (GWI) remains a serious health consequence for at least 11,000 veterans of the first Gulf War in the early 1990s. Our understanding of the health consequences that resulted remains inadequate, and this is of great concern with another deployment to the same theater of operations occurring now. Chronic immune cell dysfunction and activation have been demonstrated in patients with GWI, although the literature is not uniform. We exposed GWI patients and matched controls to an exercise challenge to explore differences in immune cell function measured by classic immune assays and gene expression profiling.
Methods: This pilot study enrolled 9 GWI cases identified from the Department of Veterans Affairs GWI registry, and 11 sedentary control veterans who had not been deployed to the Persian Gulf and were matched to cases by sex, body mass index (BMI) and age. We measured peripheral blood cell numbers, NK cytotoxicity, cytokines and expression levels of 20,000 genes immediately before, immediately after and 4 hours following a standard bicycle ergometer exercise challenge.
Results: A repeated-measures analysis of variance revealed statistically significant differences for three NK cell subsets and NK cytotoxicity between cases and controls (p < 0.05). Linear regression analysis correlating NK cell numbers to the gene expression profiles showed high correlation of genes associated with NK cell function, serving as a biologic validation of both the in vitro assays and the microarray platform. Intracellular perforin levels in NK and CD8 T-cells trended lower and showed a flatter profile in GWI cases than controls, as did the expression levels of the perforin gene PRF1. Genes distinguishing cases from controls were associated with the glucocorticoid signaling pathway.
Conclusion: GWI patients demonstrated impaired immune function as demonstrated by decreased NK cytotoxicity and altered gene expression associated with NK cell function. Pro-inflammatory cytokines, T-cell ratios, and dysregulated mediators of the stress response (including salivary cortisol) were also altered in GWI cases compared to control subjects. An interesting and potentially important observation was that the exercise challenge augments these differences, with the most significant effects observed immediately after the stressor, possibly implicating some block in the NK and CD8 T-cells ability to respond to "stress-mediated activation". This has positive implications for the development of laboratory diagnostic tests for this syndrome and provides a paradigm for exploration of the immuno-physiological mechanisms that are operating in GWI, and similar complex syndromes. Our results do not necessarily elucidate the cause of GWI, but they do reveal a role for immune cell dysfunction in sustaining illness.
Published: 5 March 2009
BMC Medical Genomics 2009, 2:12 doi:10.1186/1755-8794-2-12
Received: 3 November 2008 Accepted: 5 March 2009
This article is available from: http://www.biomedcentral.com/1755-8794/2/12
© 2009 Whistler et al; licensee BioMed Central Ltd.
Background
Some veterans returning from the first Persian Gulf War, Operations Desert Shield and Desert Storm (1990–1991), reported a variety of symptoms including fatigue, muscu-loskeletal discomfort, skin rashes, and cognitive dysfunc-tion [1-3]. Because many of these veterans potentially experienced various hazards such as physical and psycho-logical stressors, multiple vaccinations, prophylactic med-ications, infectious agents, pesticides, depleted uranium, oil well fires and smoke, and chemical and biological war-fare agents, many hypotheses as to the cause of the syn-drome, now called Gulf War Illness (GWI), have ensued [4]. As yet there are no diagnostic clinical signs or labora-tory abnormalities that distinguish GWI and the patho-physiology remains inchoate. Thus, there is no specific pharmacological treatment and many of the veterans affected continue to be unwell some 18 years after their return from combat. Perhaps more important, the current deployment of larger numbers of military personnel back to this region, for considerably longer tours of duty, will likely cause considerable morbidity through GWI and similar poorly explained illnesses. Now it is even more important that additional studies are pursued to further our understanding of the illness in order that better treat-ments are developed. To date, the effects of the numerous different exposures on the veterans are still unclear, but it is likely that many would result in immune function alter-ations. These have been demonstrated in GWI by several groups [5-7], although the results have not been uniform. We hypothesize that there is a possible heterogeneity to GWI similar to that seen in Chronic Fatigue Syndrome (CFS), and the functional impairment oscillates over the many years of the illness. This makes it difficult to identify the biochemical and physiological measures that are dis-turbed, as it changes with the symptoms experienced. Along with this, GWI veterans exhibit a post-exertional fatigue that exacerbates clinical symptoms such as pain and cognitive impairment. In an attempt to measure the changing functionality within subjects, we used an exer-cise challenge paradigm. We believe this would amplify the immune cell dysfunction, allowing us to monitor
pos-sible differences in physiologic responsiveness between Gulf war veterans with and without multi-symptom ill-ness. The biological responsiveness was measured using both conventional immunological assays as in the previ-ously published literature, and whole genome expression profiling, in an attempt to understand the pathophysiol-ogy of the illness in terms of the complex biological net-works.
Methods
This study was reviewed and approved by Miami Univer-sity, Department of Veterans Affairs, and Centers for Dis-ease Control and Prevention Institutional Review Boards. All participants were volunteers who gave informed con-sent.
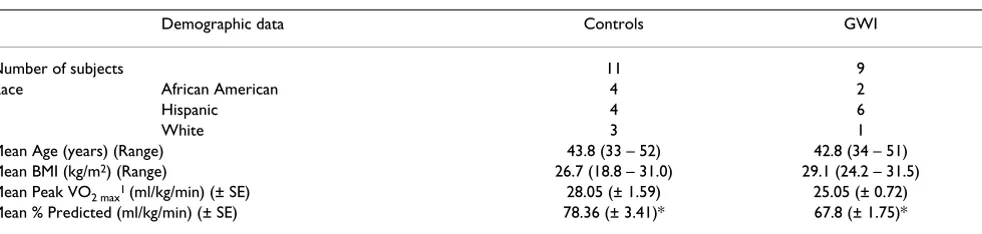
In this paper we report on a total of 20 subjects (9 GWI and 11 control subjects) taken from a larger study, in an attempt to determine the effectiveness of our approach in evaluating the significant biological differences between GWI cases and controls. Demographic data is summarized in Table 1.
Subjects
The GWI cases, between the ages of 30 and 55 years old, were identified from the Department of Veterans Affairs' Gulf War Registry, who had no current medical or psychi-atric conditions that could preclude GWI as the primary explanation for their fatiguing illness. We also excluded individuals taking medications that could impact immune function (e.g. steroids, immunosuppressive drugs). All cases were veterans deployed to the theater of operations between August 8, 1990 and July 31, 1991 who met the 1998 GWI illness criteria utilized by CDC and the Department of Veterans Affairs [2]. This includes at least one chronic symptom (present longer than 6 months) of fatigue or mood or cognitive complaints and chronic joint pain or stiffness or muscle pain.
As a comparison group we enrolled 11 well veteran con-trols from the local National Guard units, who defined
Table 1: Demographic and physiological parameters of subjects involved in the exercise challenge paradigm.
Demographic data Controls GWI
Number of subjects 11 9
Race African American 4 2
Hispanic 4 6
White 3 1
Mean Age (years) (Range) 43.8 (33 – 52) 42.8 (34 – 51)
Mean BMI (kg/m2) (Range) 26.7 (18.8 – 31.0) 29.1 (24.2 – 31.5)
Mean Peak VO2 max1 (ml/kg/min) (± SE) 28.05 (± 1.59) 25.05 (± 0.72)
Mean % Predicted (ml/kg/min) (± SE) 78.36 (± 3.41)* 67.8 (± 1.75)*
* Statistical difference measured by a Student t-Test with equal variance p = 0.015 1 Peak VO
themselves as sedentary and were of the same age, sex and BMI as the GWI cases (Table 1).
Exercise challenge
The exercise challenge was performed in the morning, to avoid inter-subject differences in variables measured due to diurnal variation. Subjects arrived at the clinic prior to breakfast, had an intravenous line placement, were served breakfast (contents uniform for all subjects), and lay down for 30 minutes prior to the initial blood draw (T0). Following this, they participated in symptom-limited maximum graded exercise stress test on a bicycle ergom-eter [8]. This involved pedaling at a power output of 60 watts for 2 minutes and increasing this every 2 minutes, by 30 watts until one of the maximal test criteria were met. These were a plateau in maximal oxygen consumption, a respiratory exchange ratio greater than 1.15 or the subject stopped the test despite vocal urging from the staff All exercise tests were conducted in compliance with the American College of Sports Medicine's published guide-lines [9]. We collected a second blood sample (T1) imme-diately following the challenge (approximately 30 minutes from the start). Subjects then rested for 3 hours following which we obtained a third (T2) blood speci-men. There were no adverse events observed as a conse-quence of the exercise challenge in this study
Cytokine studies
We measured TNFα, IL10, IL6, IL5, IFNγ, and IL1α using heparanized whole blood collected at each time point. To measure in vitro cytokine production we cultured cells for 48 hours at 37°C in 5% CO2, either unstimulated or stim-ulated with phytohemagglutinin (PHA) following which supernatants were collected and frozen at -70°C until ana-lyzed using the Immunotech enzyme-linked immu-noassay (ELISA) kits (Beckman Coulter, Hialeah, FL). We also measured in vivo plasma TNFα, IL10 and IL6 with a high sensitivity ELISA assay (sensitivity: TNFα – 0.13 pg/ ml; IL10 – 0.05 pg/ml; IL6 – 0.02 pg/ml; vendor – Bender MedSystems, Burlingame, CA).
Salivary cortisol
All subjects submitted 5 saliva samples collected into Salivette tubes (Sarstedt, Germany). Samples were col-lected at 18:00, the evening prior to the exercise challenge (T-12), at 06:00 (T-2) on the morning of the assessments and exercise challenge, along with blood samples imme-diately before the morning exercise test (T0), within 5 min of completion of the test (T1) and at 16:00 (T2). Salivary cortisol was measured by a high sensitivity ELISA assay (sensitivity – < .003 μg/dL; vendor – Salimetrics LLC, State College, PA). Assays were run using the Biomek 2000 robotic system with high and low concentrations of corti-sol control samples being included in each assay. For this assay, the morning range for healthy adults was 0.940 –
1.551 μg/dL, and the afternoon range, undetectable to
0.359 μg/dl.
Cell surface phenotyping by flow cytometry
Ethylenediamine tetra-acetic acid anti-coagulated whole blood was surface-stained with optimal dilutions for CD19, CD3, CD4, CD8, CD56, CD16, and CD11a, with isotype controls in four color combinations for 15 min at 25°C. Samples were then fixed and lysed with Optilyse-C reagent, followed by analysis on a FC500 flow cytometer. All reagents and instrumentation were from the Beckman Coulter Corporation (Hialeah, FL). The accuracy and pre-cision of analyses were optimized through the adherence to the CDC's recommendations for flow cytometric anal-yses [10].
Flow cytometric assessment of intracellular perforin
The flow cytometric method used for the semi-quantita-tive assessment of intracellular perforin is published [11].
NK cell activity
The cytolytic activity of the whole blood was measured against a tumor cell target (K562 cells labeled with 51Cr),
and relates the number of cells in the sample that are phe-notypically NK cells. The assay was performed as described by Maher et al. [12].
Gene expression profiling
Blood was collected into an 8 ml cell preparation tube ((CPT); Becton, Dickinson and Company, Franklin Lakes, NJ) containing sodium citrate at T0 (baseline), T1 (imme-diately after stressor) and T2 (3 hour recovery). The CPT was processed at the collection site according to the man-ufacturer's instructions and peripheral blood
mononu-clear cells (PBMCs) cryopreserved at 5 × 10⁶ cells/ml
freeze medium. Prior to shipping of specimens to the CDC, a 2 ml aliquot of each sample was spun down and the cell pellet resuspended in 1 ml TRIzol reagent. At the CDC laboratories RNA was extracted according to manu-facturer's instructions and the RNA quality and quantity
assessed using the Agilent 2100 Bioanalyzer. Two μg of
total RNA was labeled using the One-Cycle Target Labe-ling Assay (Affymetrix, Santa Clara, CA, USA) including
amplification and labeling controls from the GeneChip®
Flu-idics Station with the EukGE-WS2v5_450 protocol. Chips were scanned using the Affymetrix GeneChip Scanner
3000 and the Affymetrix GeneChip® Operating Software
(GCOS) was utilized for the management, sharing and initial processing of the expression data. Array quality control was performed using the Expression Console™ software (version 1.1, Affymetrix).
The array data files have been deposited in ArrayExpress http://www.ebi.ac.uk/arrayexpress. Accession number: E-MEXP-2069.
Data analysis
Statistical analysis of immune screening data
To investigate the relationship between immune markers and the case/control groups, multivariate analysis of data from T0 to T1 and T2 time points was performed using repeated-measures analysis of variance ((ANOVA), gen-eral linear models procedure). For all the statistical tests applied, 2-tailed p < 0.05 was considered to be statistically significant. SAS statistical software (version 9.1; SAS Insti-tute) was used to conduct the analyses.
Gene expression data analysis
The CEL files for each array were imported into BRB Array-Tools (v3.6.0), developed by Dr. Richard Simon and Amy Peng Lam at the National Cancer Institute and Emmes Corporation http://linus.nci.nih.gov/BRB-Array Tools.html. Data was normalized using the robust multi-chip average (RMA) algorithm and a logarithmic (base 2) transformation was applied to the signal intensities. Probe sets showing minimal variation across the arrays were excluded from the analysis, those whose expression dif-fered by at least 1.5 fold from the median in at least 20% of the arrays were retained, giving 9,140 probe sets for fur-ther analysis. The Quantitative Trait Analysis (QTA) tool was used to identify genes whose expression was signifi-cantly related to the cell numbers of the different lym-phocyte subsets. We computed a statistical significance level for each gene testing the hypothesis that the Spear-man's correlation between gene expression and each vari-able was zero. These p- values were then used in a multivariate permutation test [14,15] in which the cell numbers were randomly permuted among the arrays. We used the multivariate permutation test to provide 90% confidence that the false discovery rate (FDR) was < 10%. The FDR is the proportion of false positives in the list of genes claimed to be differentially expressed. The multivar-iate permutation test is non-parametric and does not require the assumption of Gaussian distributions.
Biological interpretation of the results was achieved using the DAVID Knowledgebase http://david.abcc.ncifcrf.gov/ [16,17] for functional annotation and enrichment analy-sis. The threshold of the EASE score was set at 0.1 (a
mod-ified Fisher Exact p-value, where perfect enrichment = 0), with a minimum requirement of 5 genes present in the
group. Ingenuity Pathway Analysis (IPA, Ingenuity®
Sys-tems; Mountain View, CA. http://www.ingenuity.com) was used for network analysis of gene lists.
Quantitative real-time polymerase chain reaction (qPCR)
Validation of the microarray gene expression findings was performed on all subjects with enough RNA at each time point (3 controls and 3 GWI cases) using qPCR. Eleven genes were validated that were of particular physiological significance, either differentiating GWI cases from con-trols at T1 (hierarchical clustering data) or that showed up- and down-regulation between time points. The genes are enumerated in additional file 1. Endogenous control genes are required to account for the amount of input RNA, and they need to be equally expressed across illness class and time points. Ten genes were chosen on the basis of the microarray gene expression data that showed low coefficients of variation across all arrays, and also had dif-ferent biological functions to avoid co-regulated genes. GeNorm [18] was used to select the most stable pair-wise
combination of reference genes, which were PGK1 and
GAPDH.
Information on all primers and probe sets used in this val-idation are given in additional file 1[19]. For each set PCR amplification efficiency (E = 10-1/slope) was determined
using a 5-step 5 fold dilution standard curve (25 ng to 4 pg) and pooled PBMC total RNA from several donors. One microgram of RNA was reverse transcribed into cDNA using random hexamers for the template cDNA.
qPCR was performed using the LightCycler® 480 system
(Roche Applied Science, Indianapolis, IN) in 96 well plates with Taqman universal PCR master mix (Applied Biosystems, Foster City, CA) according to the manufac-turer's instructions using primers and probes outlined in additional file 1. All samples, including the external standards and non-template control were run in triplicate.
The 25 μL reaction volume contained 1× Taqman PCR
Master Mix, 0.8 μmol/L of each primer, and 2 μL template. The cycling conditions consisted of one cycle at 95°C for 10 min followed by 40 cycles of 95°C × 15 s, 60°C × 15 s and 72°C × 45 s. Data was analyzed using the Lightcycler®
480 software (version 1.50).
Results
GWI cases and control subjects performed similarly dur-ing the exercise challenge as shown by compardur-ing their VO2 max (ml/kg/min) values, which assesses their level of physical fitness, using a Student t Test. No statistically sig-nificant differences were found (Table 1). Therefore, the biological differences that were measured in this study were not related to exertional differences.
Statistical analysis of immune cell numbers and functional assay data
The changes in immune measures by illness class that showed significant differences (p < 0.05) were NK cyto-toxicity (at T0 and T1), CD3- CD56+, CD3- CD16+, and CD3- CD16+ CD11a+ NK cell numbers (all at T2), as well as the response to PHA-stimulation measured in the
supernatants of cultured lymphocytes for IL5 and IFNγ
(all times) (additional file 2). A significant interaction of time and illness class was observed in CD3- CD56+ cell counts, CD4/CD8 T-cell ratio, PHA-stimulation measures for the Th2 cytokine IL5 and the proinflammatory cytokine TNFα (Additional file 2). Significant time effects (p < 0.001) were observed for all immune variables except
NK cytotoxicity, IL6 and IL10 plasma levels, and the in
vitro PHA cytokine stimulation measures.
The changes in cell subset numbers across time were not as large in the GWI cases compared to controls (not statis-tically significant (additional file 2)); however, for the CD4/CD8 T-cell ratio, statistically significant differences in illness class, time and the illness class × time interaction were identified (additional file 2). Control subjects had higher CD4/CD8 T-cell ratios at all time points compared to cases, with decreases at T1 for both. This results from an increase in the number of CD3+CD8+ lymphocytes brought into circulation immediately after the stressor (108% from baseline for controls) compared to CD3+ CD4+ (30%). This effect is less pronounced in GWI cases, which show similar CD8 and CD4 T cell numbers to con-trols at baseline with changes of 64% (p = 0.029) and 25% (p = 0.234) respectively, after the stressor.
Correlation analysis of gene expression data and immune cell numbers by QTA
The expression of 141 unique probe sets were identified as being correlated to NK cell subset numbers (Spearman's rank correlation coefficients > 0.43), with over 65% of probe sets being common to all 3 subsets. The association between these probe sets and NK cell function was sup-ported by literature searches; of the 141 probe sets identi-fied by QTA, 108 (77%) were strongly implicated in NK cell function (additional file 3).
Examining the gene expression levels of the correlated probe sets between T0-T1 for the control subjects, we
found 49 showed a 2-fold increase (additional file 4), and none were decreased using the same criteria. Functional annotation of these genes indicated signal transduction as a predominating biological process, containing 19/49 (39%) of submitted probe sets. Fifteen genes were
identi-fied as receptors: CD247, EDG8, GPR56, IL2RB, KIR3DL2,
KIR3DL1, KIR2DL5A, KIR2DS5, KIR2DL2, KLRD1, KLRF1, PTGDR, TRA, and TRD. Examining the expression levels of the GWI subjects only 1 probe set (PTGDR) showed a 2-fold increase in expression, and no probe sets showed a decrease. Repeated measures ANOVA showed that 132 probe sets were statistically significantly different with respect to time, and 82 by illness class, with 74 com-mon to both (additional file 4). No probe sets were signif-icant in the interaction. Closer inspection showed some
genes, for example GFOD1, ZBTB16 and RNF165, were
statistically significantly different in both the time and ill-ness class analysis (indicating different expression levels), but showed comparable responses between time points (similar fold changes). Other genes showed differences in expression levels and were less responsive (smaller fold changes) in the GWI cases compared to controls, such as GZMB, CCL4 and FCG3A (alias CD16) (additional file 4). In contrast probe sets identified in the QTA with B-cell numbers showed no statistical significant differences in the gene expression levels by illness class or time.
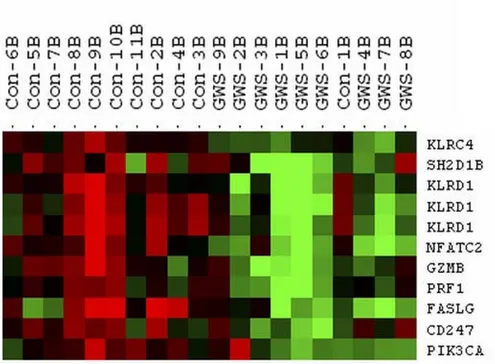
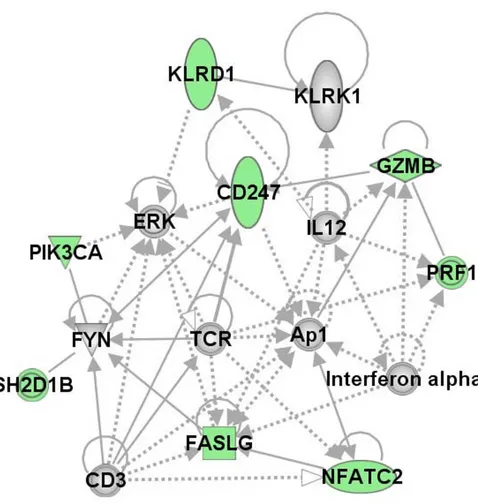
The genes that differentiated cases from controls in the NK profiles were identified by hierarchical clustering of the 141 unique probe sets (average linkage and centered cor-relation) using the time point immediately after the exer-cise challenge (T1), when we expected differences to be the largest. Figure 1 shows the heatmap of 11 probe sets (9 unique genes) that clearly delineated GWI cases from controls. To explore the biological connections between these genes we used the Ingenuity Pathways Knowledge Base and found 8/9 genes formed a single network (Figure 2).
Intracellular perforin levels
Gene expression validation by real-time PCR
The exercise-related changes seen between the T0-T1 and T1-T2 time points were very similar in 9/11 genes used in the validation (additional file 5). Validation of the gene expression data was seen in the lower expression levels for GWI cases compared to controls at all time points in KLRD1, GZMB, and PRF1, and at T1 for KLRC4
(addi-tional file 6). The gene expression patterns of PIK3CA,
which showed an increase in expression in all 3 time points in controls, and higher expression in GWI cases, was validated by qPCR. (The data for the baseline time point in the GWI cases were not available because of a technical error). Four of 5 genes not part of the hierarchi-cal clustering validated fully (additional file 5). The only discordant result between the gene expression and qPCR
data was seen in GWI data for KLRC4 and NCAM1
between the T2/T1 time points.
Discussion
The symptom spectrum of GWI is similar to CFS [20], and our results mirror what is seen in the literature with regard to CFS: chronic immune activation [21,22], low cytotoxic immune function [23,24], and dysregulated mediators of the stress response with low baseline salivary cortisol [25] strongly reflecting the overlap between these two syn-dromes. Decreased functional capacity of NK cells is the one consistent finding in CFS studies [26] and Siegel et al. [27] demonstrated that low NK cell function defined a more severely ill cohort. In addition reduced NK cellular cytotoxicity is associated with reduced intracellular
per-Heatmap depicting the expression levels of genes separating GWI cases from controls immediately after the exercise challenge Figure 1
Functional network of the 9 NK genes differentiating cases from controls Figure 2
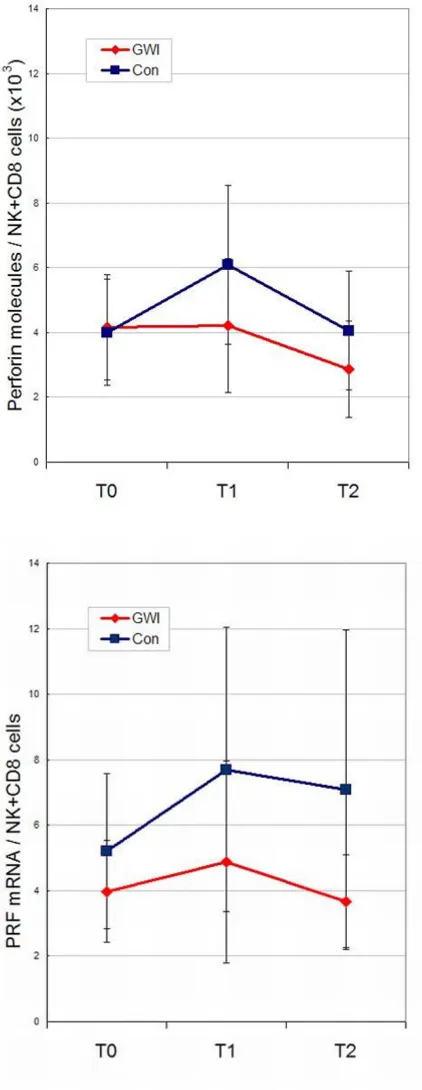
Change in perforin levels during the exercise challenge time series adjusted for the number of NK and CD8+ cells Figure 3
forin [12]. In our study we showed significant group dif-ferences in NK cytotoxicity, plus perforin levels that were lower and showed a flatter profile in GWI cases than con-trols (Figure 3) not reaching statistical significance proba-bly due to small numbers and large variances. Gene expression levels of perforin mRNA (PRF1) showed similar profiles to the protein levels.
Lymphocytosis induced by exercise is well established in the scientific literature [28,29] and results from the mobi-lization of immunocompetent cells from immune organs (lymph node and spleen) to the circulation. One to 2 hours into the exercise recovery period the lymphocyte count decreases, sometimes to below pre-exercise levels [30]. Our data confirmed reports that the NK cell subsets are more sensitive to exercise stress than any other cell subtypes [28], but for us it was important to differentiate the causal effects of exercise alone, and to look for the dif-ferences between GWI cases and the control subjects. Sta-tistically significant differences were noted for the 3 NK cell subsets between cases and controls, and a significant interaction of illness class and time was observed in the CD3- CD56+ subset. There were no statistically significant
differences in the VO2 max measures between cases and
controls (Table 1) therefore level of exercise performance could not explain these changes. Correlating gene expres-sion to particular cell subsets reflected the cellular shifts in the peripheral blood cells with high statistical signifi-cance. For example, 5 NK and T-cell specific surface
mole-cules (CD160, CD244, CD247, CD38 and CD56) [31]
were strongly correlated with the NK subset cell numbers by QTA. To confirm that the gene expression changes between cases and controls evident in our study were not only due to the change in cell numbers, significant expres-sion values were re-evaluated relative to cell numbers. In summary our findings demonstrate control subjects had greater numbers of genes showing expression changes between the T0 and T1 (baseline-stress time points) than GWI cases, and that expression levels in NK cells were con-sistently lower in GWI cases. However, gene responsive-ness varied. Some genes showed a similar responsiveresponsive-ness to the stressor for both GWI cases and controls, whereas others appeared less responsive to the stressor in the cases (additional file 4). The differences in expression levels were greatest at T1 (even when cell number differences were accounted for) but were also present at T0 and T2, when cell numbers were similar. The hierarchical cluster-ing of the NK correlated genes showed that 9 separated GWI cases from controls (Figure 1), each one associated with NK cytotoxicity. All these genes play a role in major cellular functions such as proliferation, activation and apoptosis and the functional network established for 8 of the 9 genes (Figure 2) reveals that 5 of the networked
genes (AP1, CD3, CD247, NFATC2 and PIK3CA) are part
of the glucorticoid receptor signaling pathway. Enhanced
negative-feedback sensitivity to glucorticoids is often seen in CFS [32,33], as well as a blunted adrenocorticotropin response to stressors [34], and hypocorticolism [35]. This supports the hypothesis that hypo-function of the hypothalamic pituitary adrenal (HPA) axis plays a role in CFS, and probably in GWI also. Disturbances of the HPA axis can be considered as a pathway that links to the immunological disturbances evidenced in CFS and GWI.
Differences in the NK cell receptor mRNAs (KLRD1,
KLRC4, and KLRK1) have been validated between cases and controls (Additional file 2). We know that each NK cell expresses several inhibitory (KIR) and activating (KLR) receptors [36,37], and the balance between the sig-nals triggered by their engagement determines their bio-logical response. The interaction of inhibitory receptors by their cognate ligands (mostly classical and non-classi-cal MHC class I molecules) keeps NK cells inhibited, part of the "missing-self hypothesis" [38]. It has been shown that NK cells that lack inhibitory receptors for self MHC class I molecules are hyporesponsive [39]. Several activat-ing receptors (KLR) have been described, and it is not completely understood how these receptors cooperate with each other, or how they distribute at a clonal level on different NK cells. The effect of down-regulation of recep-tor mRNA as we see in GWI cases is not known, and how this alters the receptor interactions with cognate ligands is not well understood. This lack of knowledge stems from the heterogeneity and redundancy in the activating recep-tors which is a drawback to understanding their func-tional importance in NK cell immunobiology. It will be important to elucidate how these changes affect the cell phenotype and how this moderates the functioning of immune cells. The cytotoxic effector functions of NK cells are mediated by 2 major mechanisms, perforin/granzyme and death receptor induction of apoptosis [40]. In the dif-ferent analyses performed for this paper, we see that each one of these components is implicated as being different
between GWI and control subjects. In fact PRF1 and
GZMB, along with KLR complex receptors and FASLG are
The shift in immune system functioning towards a Th2 (or allergy) profile has been evidenced before in GWI and CFS patients [22,41], as has the contrasting position [6].
Peakman et al. [42] reviewed 6 studies that directly
addressed the Th2 bias of the immune response as an explanation for GWI and concluded that the data did not support the hypothesis. We found elevated IL-5, a Th2 cytokine, in the GWI cases as compared to controls (Addi-tional file 2); however, the ratio of a Th1 cytokine (IFNγ) to IL-5 was determined and found to show no statistical differences in the repeated measures ANOVA. We found significant differences in CD4/CD8 ratios between cases and controls. The clinical consequences of these changes remain relatively unknown. Data from previous studies showed the ratio was significantly elevated in GWI patients compared to controls [43], the reverse of what we found here. So as with CFS, there are several conflicting reports in the literature regarding immune function [26].
We examined salivary cortisol, a "stress hormone" at base-line (T0), immediately after the exercise stress (T1) and 3 hours later (T2). Control subjects showed increased sali-vary cortisol from T0 to T1 in our stress paradigm, whereas it decreased in GWI cases. Several conditions are associ-ated with changes in stress system activity [44,45] through modulation of inflammatory responses and the Th1/Th2 balance they may suppress or potentiate disease activity and/or progression. The differences seen here in stress hormones may represent an important mechanism by which stress affects immune-related disease susceptibility, activity, and outcome.
This was a preliminary exploration to determine if an exer-cise paradigm would help us in understanding the patho-physiology of GWI and if whole genome expression profiling would make a significant contribution to this understanding. For this end we used a small subset of sub-jects from a much larger study cohort, and two issues arose. Firstly the matching of cases to controls by race fell away (Table 1), and secondly, it was noted that the sub-jects were brought into clinic in separate groups over a 16 month period, GWI veterans and then control subjects, with little overlap. To address the first issue, we used a multivariate ANOVA with multiple test correction on the gene expression data to find the genes differing by race. None of these were statistically significant in any of the analyses presented in this paper. To manage the latter lim-itation which would impact class comparison analyses, we focused on differences across the time series. By using within-person paired analysis we could examine exercise-related changes and then compare the results of cases and controls.
Conclusion
This study shows that exercise induces considerable phys-iological change in the immune system and the changes observed in GWI cases are less apparent than in control subjects, with differences in the dynamics of the immune response also obvious. Whether the gene expression changes in response to exercise in the circulating immune cells occur because of direct effects in the cells themselves, or are a consequence of mobilizing cells with different expression profiles from various depots is not fully known [46]. It will be important to determine the confounding effects of lymphocyte redistribution. The differences we found are focused in the NK and T-cell populations, involving signal transduction processes possibly through differences in NK receptor expression. We have not eluci-dated exactly what these changes are, but possible areas of follow-up include the dynamic signaling interactions between NK and T-cells with regard to proliferation, cell cycle differences and activation. The question arises whether the altered number of NK cells is a consequence of the pathological status or a primary condition that leads into the disease.
Another important question is what role do NK cells have in maintaining immune homeostasis in disorders that are thought to involve immune activation such as CFS and GWI? The activities were not correlated with a particular subset of NK cells, and further phenotypic and functional analysis of the different subsets will be necessary to eluci-date the immune cells involved in the pathophysiology of GWI. Our data supports the idea of chronic immune cell dysfunction, which appears to be centered on the NK and T-cell lymphocyte populations. There are several plausible explanations for the decrease in NK cell activity. It could result from a shift in NK cell subsets resulting in a larger population of cells with a lower activity profile, or possi-bly changes in cytokine levels which modulate NK cell activity or the presence of inhibitory substances which could act as ligands binding to the KLR activation recep-tors.
immuno-physiological mechanisms that are operating in GWI, and the possibility of extending this paradigm to other com-plex syndromes.
Abbreviations
CCL4: Chemokine (C-C motif) ligand 4; CD: Cluster of differentiation; EDG8: Endothelial differentiation, sphin-golipid G-protein-coupled receptor, 8; FASLG: Fas ligand (TNF super family, member 6); FCG3A: Fc fragment of IgG, low affinity IIIa, receptor (CD16a); GAPDH: Glyeral-dehyde 3-phosphate dehydrogenase; GFOD1: Glucose-fructose oxido-reductase domain containing 1; GPR56: G protein-coupled receptor 56; IFNγ: Interferon; IL10: leukin 10; IL2RB: Interleukin 2 receptor, beta; IL5: Inter-leukin 5; IL6: InterInter-leukin 6; KIR2DL2: Killer cell immunoglobulin (Ig)-like receptor, two domains, long cytoplasmic tail, 2; KIR2DL5A: Killer cell Ig-like receptor, two domains, long cytoplasmic tail, 5A; KIR2DS5: Killer cell Ig-like receptor, two domains, short cytoplasmic tail, 5; KIR3DL1: Killer cell Ig-like receptor, three domains, long cytoplasmic tail, 1; KIR3DL2: Killer cell Ig-like recep-tor, three domains, long cytoplasmic tail, 2; KLRC4: Killer cell lectin-like receptor subfamily C, member 4; KLRD1: Killer cell lectin-like receptor subfamily D, member 1; KLRK1: Killer cell lectin-like receptor subfamily K, mem-ber 1; MHC: Major histocompatibility complex; MYC: v-myc myelocytomatosis viral oncogene homolog (avian); NCAM1: Neural cell adhesion molecule 1; NFAT2C: Nuclear factor of activated T-cells, isoform2c; PGK1: Phos-phoglycerate kinase 1; PIK3CA: Phosphoinositide-3-kinase, catalytic, alpha polypeptide; PRF1: Perforin 1 (pore forming protein); PTGDR: Prostaglandin D2
recep-tor (DP); RNF165: Ring finger protein 165; TNFα: Tumor
necrosis factor (TNF super family, member 2); TRA: T-cell receptor alpha locus; TRD: T-cell receptor delta locus; ZBTB16: Zinc finger and BTB domain containing 16.
Competing interests
The authors declare that they have no competing interests.
Authors' contributions
All authors have read and approved the final manuscript.
TW was responsible for oversight of the genomics compo-nent of the study, performed the array data analysis and wrote the manuscript.
MAF was the lead study coordinator and oversaw all aspects of the lymphocyte phenotyping, immune function assays and PBMC isolation for the gene expression stud-ies. She participated in designing the study and in the writ-ing of the grant applications that funded the study. She contributed to the writing and editing of the manuscript.
WL performed all aspects of the array workflow and did all initial QC assessment of samples and arrays. WL was also responsible for the qPCR validation. He coordinated spec-imen handling between sites.
J-MSL performed the analysis on the functional data and advised on the gene expression analysis.
XRZ performed the flow cytometry and functional assays, PBMC collection and shipping, managed the immunol-ogy data set, and provided excellent laboratory support and coordination between sites.
AL our exercise physiologist designed and performed the exercise stress testing.
SDV was involved in study design, grant application writ-ing, coordinating interactions between study sites, IRB approval at CDC, and reviewed the manuscript.
NGK was the study PI, who conceived the study design and wrote the VA merit award applications that funded the study. She directed subject recruitment, and was the clinician supervising all medical, stress tests and psycho-metric evaluations on subjects. She reviewed the manu-script.
Additional material
Additional file 1
Primers and probes sequences used for gene expression validation by real-time PCR. When available primer/probe sequences were used from the RTPrimerDB [19]http://medgen.ugent.be/rtprimerdb/. Italicized probes were designed using Primer Express software (v2.0). Where ever possible assays were used that crossed splice junctions. Probes were 5' labeled with 6-carboxyfluorescein (FAM) and 3' labeled with MGB non-fluorescent quencher.
Click here for file
[http://www.biomedcentral.com/content/supplementary/1755-8794-2-12-S1.xls]
Additional file 2
Statistical analysis of laboratory measures by ANOVA for 2 (illness class) × 3 (time) repeated measures. All values are given as mean ± standard error of the mean. P-values in bold are significant at p < 0.05, those in italics are just above this cutoff. A double asterisk indicates sig-nificant differences between illness class at indicated time points (**). Significant time effects were determined for all measures (p < 0.001) except those marked with a hash (#). na – measures not taken. * Net con-centrations in supernatants of PHA stimulated minus unstimulated blood cultures are expressed as pg/105 lymphocytes in the culture. * Net concen-trations in supernatants of PHA stimulated minus unstimulated blood cul-tures are expressed as pg/105 lymphocytes in the culture.
Click here for file
Acknowledgements
This study was funded by two Veterans Administration Merit Awards from the Department of Veteran Affairs to NGK. The findings and conclusions in this report are those of the authors and do not necessarily represent the views of the funding agency.
References
1. Haley RW, Hom J, Roland PS, Bryan WW, Van Ness PC, Bonte FJ, et al.: Evaluation of neurologic function in Gulf War veterans. A blinded case-control study. JAMA 1997, 277:223-230.
2. Fukuda K, Nisenbaum R, Stewart G, Thompson WW, Robin L, Washko RM, et al.: Chronic multisymptom illness affecting Air Force veterans of the Gulf War. JAMA 1998, 280:981-988. 3. Cherry N, Creed F, Silman A, Dunn G, Baxter D, Smedley J, Taylor S,
MacFarlane GJ: Health and exposures of United Kingdom Gulf war veterans. Part I: The pattern and extent of ill health.
Occup Environ Med 2001, 58:291-298.
4. Iversen A, Chalder T, Wessely S: Gulf War Illness: lessons from medically unexplained symptoms. Clin Psychol Rev 2007,
27:842-854.
5. Zhang Q, Zhou XD, Denny T, Ottenweller JE, Lange G, LaManca JJ, Lavieles MH, Pollet C, Gause WC, Natelson BH: Changes in immune parameters seen in Gulf War veterans but not in civilians with chronic fatigue syndrome. Clin Diagn Lab Immunol
1999, 6:6-13.
6. Skowera A, Hotopf M, Sawicka E, Varela-Calvino R, Unwin C, Nikolaou V, et al.: Cellular immune activation in Gulf War vet-erans. J Clin Immunol 2004, 24:66-73.
7. Rook GA, Zumla A: Gulf War syndrome: is it due to a systemic shift in cytokine balance towards a Th2 profile? Lancet 1997,
349:1831-1833.
8. Perna FM, LaPerriere A, Klimas N, Ironson G, Perry A, Pavone J, et al.: Cardiopulmonary and CD4 cell changes in response to exercise training in early symptomatic HIV infection. Med Sci Sports Exerc 1999, 31:973-979.
9. American College of Sports Medicine: ACSM's Guidelines for Exercise Testing and Prescription 7th edition. Baltimore: Lippincott Williams & Wilkins; 2005.
10. 1997 revised guidelines for performing CD4+ T-cell determi-nations in persons infected with human immunodeficiency virus (HIV). Centers for Disease Control and Prevention.
MMWR Recomm Rep 1997, 46:1-29.
11. Maher KJ, Klimas NG, Hurwitz B, Schiff R, Fletcher MA: Quantita-tive fluorescence measures for determination of intracellu-lar perforin content. Clin Diagn Lab Immunol 2002, 9:1248-1252. 12. Maher KJ, Klimas NG, Fletcher MA: Chronic fatigue syndrome is
associated with diminished intracellular perforin. Clin Exp Immunol 2005, 142:505-511.
13. Affymetrix: GeneChip Expression Analysis: Technical Manual. 701021 Rev. 5. 2004. Santa Clara, CA, Affymetrix. Ref Type: Pam-phlet
14. Simon R, Korn E, Radmacher M, Wright G, Zhao Y: Design and Analysis of DNA Microarray Investigations New York: Springer-Verlag; 2003. 15. Korn EL, Troendle JF, McShane LMLM, Simon R: Controlling the
number of false discoveries: application to high-dimensional genomic data. Journal of Statistical Planning and Inference 2005,
124:379-398.
16. Huang dW, Sherman BT, Tan Q, Collins JR, Alvord WG, Roayaei J, Stephens R, Baseler MW, Lane HC, Lempicki RA: The DAVID Gene Functional Classification Tool: a novel biological mod-ule-centric algorithm to functionally analyze large gene lists.
Genome Biol 2007, 8:R183.
17. Huang dW, Sherman BT, Tan Q, Kir J, Liu D, Bryant D, et al.: DAVID Bioinformatics Resources: expanded annotation database and novel algorithms to better extract biology from large gene lists. Nucleic Acids Res 2007, 35:W169-W175.
18. Vandesompele J, De PK, Pattyn F, Poppe B, Van RN, De PA, Speleman F: Accurate normalization of real-time quantitative RT-PCR data by geometric averaging of multiple internal control genes. Genome Biol 2002, 3:RESEARCH0034.
19. Pattyn F, Robbrecht P, De PA, Speleman F, Vandesompele J:
RTPrimerDB: the real-time PCR primer and probe data-base, major update 2006. Nucleic Acids Res 2006, 34:D684-D688. 20. Thomas HV, Stimpson NJ, Weightman AL, Dunstan F, Lewis G: Sys-tematic review of multi-symptom conditions in Gulf War veterans. Psychol Med 2006, 36:735-747.
21. Raison CL, Lin JM, Reeves WC: Association of peripheral inflam-matory markers with chronic fatigue in a population-based sample. Brain Behav Immun 2009, 23:327-337.
22. Aspler AL, Bolshin C, Vernon SD, Broderick G: Evidence of Inflam-matory Immune Signaling in Chronic Fatigue Syndrome: A Pilot Study of Gene Expression in Peripheral Blood. Behav Brain Funct 2008, 4:44.
23. Patarca R: Cytokines and chronic fatigue syndrome. Ann N Y Acad Sci 2001, 933:185-200.
24. Klimas NG, Salvato FR, Morgan R, Fletcher MA: Immunologic abnormalities in chronic fatigue syndrome. J Clin Microbiol
1990, 28:1403-1410.
25. Nater UM, Youngblood LS, Jones JF, Unger ER, Miller AH, Reeves WC, Heim C: Alterations in diurnal salivary cortisol rhythm in a population-based sample of cases with chronic fatigue syn-drome. Psychosom Med 2008, 70:298-305.
Additional file 3
List of genes that correlated with the NK and B cell subsets in the QTA. The data provided represent the two gene lists derived from the cor-relation analysis of the gene expression normalized signal against the nat-ural killer and B-cell numbers respectively.
Click here for file
[http://www.biomedcentral.com/content/supplementary/1755-8794-2-12-S3.xls]
Additional file 4
Comparison of expression data between GWI cases and controls for the genes correlated with NK cell numbers. Averaged gene expression data and log ratios of the time series data for GWI cases and controls for the 141 probe sets correlated to NK subset cell numbers.
Click here for file
[http://www.biomedcentral.com/content/supplementary/1755-8794-2-12-S4.xls]
Additional file 5
Comparison of fold changes in time series data determined by qPCR or gene expression signals for GWI cases and controls. A graphic rep-resentation of these data appears in additional file 6. na – data not avail-able because of technical difficulties.
Click here for file
[http://www.biomedcentral.com/content/supplementary/1755-8794-2-12-S5.xls]
Additional file 6
Graphical representation of qPCR validation data. Relative quantities of mRNA transcripts in GWI cases and controls as measured by qPCR or oligonucleotide microarray gene expression. a) Validation results for the differentiation of GWI cases from controls from hierarchical clustering of NK cell number correlation data. b) Validation of the correlation QTA data. Data represents scaled averages of normalized signals ± standard deviation for both real-time RT-PCR data (qPCR) and array expression signal (GE) on samples from GWI cases (hatched bars) and controls (plain bars) for the 3 time points of the exercise challenge: T0 in blue, T1 in red and T2 in yellow. The graph shows similar performance despite dif-ferent dynamic ranges for the 2 methodologies. For the genes examined expression was lower in cases compared to controls.
Click here for file
Publish with BioMed Central and every scientist can read your work free of charge
"BioMed Central will be the most significant development for disseminating the results of biomedical researc h in our lifetime."
Sir Paul Nurse, Cancer Research UK
Your research papers will be:
available free of charge to the entire biomedical community
peer reviewed and published immediately upon acceptance
cited in PubMed and archived on PubMed Central
yours — you keep the copyright
Submit your manuscript here:
http://www.biomedcentral.com/info/publishing_adv.asp
BioMedcentral
26. Natelson BH, Haghighi MH, Ponzio NM: Evidence for the pres-ence of immune dysfunction in chronic fatigue syndrome.
Clin Diagn Lab Immunol 2002, 9:747-752.
27. Siegel SD, Antoni MH, Fletcher MA, Maher K, Segota MC, Klimas N:
Impaired natural immunity, cognitive dysfunction, and phys-ical symptoms in patients with chronic fatigue syndrome: preliminary evidence for a subgroup? J Psychosom Res 2006,
60:559-566.
28. Nielsen HB: Lymphocyte responses to maximal exercise: a physiological perspective. Sports Med 2003, 33:853-867. 29. Radom-Aizik S, Zaldivar F Jr, Leu SY, Galassetti P, Cooper DM:
Effects of 30 min of aerobic exercise on gene expression in human neutrophils. J Appl Physiol 2008, 104:236-243.
30. Shek PN, Sabiston BH, Buguet A, Radomski MW: Strenuous exer-cise and immunological changes: a multiple-time-point anal-ysis of leukocyte subsets, CD4/CD8 ratio, immunoglobulin production and NK cell response. Int J Sports Med 1995,
16:466-474.
31. Beare A, Stockinger H, Zola H, Nicholson I: Monoclonal antibod-ies to human cell surface antigens. Curr Protoc Immunol 2008:4A. Appendix 4
32. Van Den EF, Moorkens G, Hulstijn W, Van HB, Cosyns P, Sabbe BG, Claes SJ: Combined dexamethasone/corticotropin-releasing factor test in chronic fatigue syndrome. Psychol Med 2008,
38:963-973.
33. Jerjes WK, Taylor NF, Wood PJ, Cleare AJ: Enhanced feedback sensitivity to prednisolone in chronic fatigue syndrome. Psy-choneuroendocrinology 2007, 32:192-198.
34. Cleare AJ, Miell J, Heap E, Sookdeo S, Young L, Malhi GS, O'Keane V:
Hypothalamo-pituitary-adrenal axis dysfunction in chronic fatigue syndrome, and the effects of low-dose hydrocorti-sone therapy. J Clin Endocrinol Metab 2001, 86:3545-3554. 35. Van Den EF, Moorkens G, Van HB, Cosyns P, Claes SJ:
Hypotha-lamic-pituitary-adrenal axis function in chronic fatigue syn-drome. Neuropsychobiology 2007, 55:112-120.
36. Lanier LL: NK cell recognition. Annu Rev Immunol 2005,
23:225-274.
37. Moretta L, Bottino C, Pende D, Castriconi R, Mingari MC, Moretta A:
Surface NK receptors and their ligands on tumor cells. Semin Immunol 2006, 18:151-158.
38. Long EO, Rajagopalan S: Stress signals activate natural killer cells. J Exp Med 2002, 196:1399-1402.
39. Anfossi N, Andre P, Guia S, Falk CS, Roetynck S, Stewart CA, et al.:
Human NK cell education by inhibitory receptors for MHC class I. Immunity 2006, 25:331-342.
40. Screpanti V, Wallin RP, Grandien A, Ljunggren HG: Impact of FASL-induced apoptosis in the elimination of tumor cells by NK cells. Mol Immunol 2005, 42:495-499.
41. Skowera A, Cleare A, Blair D, Bevis L, Wessely SC, Peakman M: High levels of type 2 cytokine-producing cells in chronic fatigue syndrome. Clin Exp Immunol 2004, 135:294-302.
42. Peakman M, Skowera A, Hotopf M: Immunological dysfunction, vaccination and Gulf War illness. Philos Trans R Soc Lond B Biol Sci
2006, 361:681-687.
43. Vojdani A, Thrasher JD: Cellular and humoral immune abnor-malities in Gulf War veterans. Environ Health Perspect 2004,
112:840-846.
44. Raghupathy R, Kalinka J: Cytokine imbalance in pregnancy com-plications and its modulation. Front Biosci 2008, 13:985-94. 45. Dekkers JC, Geenen R, Godaert GL, Glaudemans KA, Lafeber FP, van
Doornen LJ, Bijlsma JW: Experimentally challenged reactivity of the hypothalamic pituitary adrenal axis in patients with recently diagnosed rheumatoid arthritis. J Rheumatol 2001,
28:1496-1504.
46. Richlin VA, Arevalo JM, Zack JA, Cole SW: Stress-induced enhancement of NF-kappaB DNA-binding in the peripheral blood leukocyte pool: effects of lymphocyte redistribution.
Brain Behav Immun 2004, 18:231-237.
Pre-publication history
The pre-publication history for this paper can be accessed here: