Governing Water Quality in California’s
Central Coast: The Case of the Conditional
Agricultural Waiver
Ann Drevno
1
1University of California, Santa Cruz, Department of Environmental Studies Corresponding author: [email protected]
Keywords: Environmental Policy, Water Quality, Conditional Agricultural Waiver, California, case study
Executive Summary: Agricultural nonpoint source pollution is a persistent environmental and human health problem. Agriculture has impaired approximately 9,493 miles of streams and rivers and 513,130 acres of lakes (SWRCB 2010). And in California’s Central Coast region, water quality has deteriorated over the past decade (CCRWQCB 2011). Nonpoint source pollution is difficult to regulate because it is inherently diffuse: monitoring dispersed and dynamic discharges and connecting them back to their sources to identify what operation is polluting and to what extent is both expensive and complex. Despite these obstacles, policymakers are increasingly forced to tackle the monumental task of how to best regulate agricultural discharges.
This case study focuses on the primary water pollution control policy in one of California’s highest valued agricultural areas: the Central Coast Conditional Agricultural Waiver (Ag Waiver). The Central Coast Regional Water Quality Control Board (Regional Board), which is granted authority from the State Water Resources Control Board (State Board) for protecting and restoring water quality within its jurisdiction, is under pressure, especially in light of a 2015 Superior Court ruling that directed the Regional Board to implement more stringent control measures for agricultural water pollution. Pressure on the Regional Board is exacerbated by regulatory budget constraints, interest groups, and by unanticipated events.
This study assesses the factors that influenced the development and implementation of the Ag Waiver policy process over the last decade and evaluates specific policy outcomes from this process. Results indicate that several complicated factors either drive or constrain improved water quality management and pollution control. In California’s Central Coast, conditions that have weakened agricultural water pollution policies in the region include budgetary and staff constraints, the 2006 E. coli breakout, and the powerful agricultural lobby. On the other side, environmentalists, environmental justice groups, health organizations, scientific studies, S.B. 390, and the 2015 California Superior Court ruling have pushed the Regional Board to develop more comprehensive water quality protections.
I. Introduction
Nonpoint source pollution, or pollution that comes from many diffuse sources, continues to contaminate California’s waters (SWRCB 2010). Agricultural nonpoint source pollution is the primary source of pollution in the state: Agriculture has impaired approximately 9,493 miles of streams and rivers and 513,130 acres of lakes on the 303(d) list of waterbodies statewide (SWRCB 2010). The 303(d) list is a section of the Clean Water Act mandating states and regions to review and report waterbodies and pollutants that exceed protective water quality standards. Agricultural pollution in California’s Central Coast has detrimentally affected aquatic life, including endemic fish populations and sea otters, the health of streams, and human sources of drinking water (Anderson et al. 2003, Anderson et al. 2006, Shimek, 2012a, Harter et al. 2012). Despite the growing evidence of agriculture’s considerable contribution to water pollution, the agricultural industry has, in effect, been exempt from paying for their pollution, and more importantly, has failed to meet water quality standards. How to best manage and regulate nonpoint source agricultural water pollution remains a primary concern for policymakers and agricultural operators alike.
This case study focuses on the Conditional Agricultural Waiver in California’s Central Coast, the primary water pollution control policy in one of the highest valued agricultural areas in the U.S. The Central Coast Regional Water Quality Control Board is under increasing pressure to improve water quality within its jurisdiction, especially with the added onus from a 2015 Superior Court ruling that directed the Regional Board to implement more stringent control measures for agricultural water pollution. Pressure on the Regional Board is exacerbated by regulatory budget constraints, interest groups, and by unanticipated events. Given these pressures, choosing appropriate criteria by which to evaluate the success of California’s primary agricultural water quality policies is complicated, but of critical importance.
This policy analysis explores the complex process of negotiations, agendas and conditions at the heart of policy-making, highlighting areas where the 2004 and 2012 Ag Waiver has succeeded in achieving its goals, as well as where it has fallen short. The analysis is divided into two parts. The first employs a within-case method of process tracing to assess the
factors that acted as drivers or limitations to the policy process. Part two, uses six evaluative criteria to assess the effectiveness of specific outcomes, such as water quality improvements and the value of monitoring data.
II. Regulatory Background
The 1972 Clean Water Act employs a technology-based standards approach, whereby any discharger must obtain a permit (valid for five years) that contains the limits on what an individual or industry can discharge into a given water body as well as details their monitoring and reporting requirements, all these provisions are defined and enforced by the National Pollution Discharge Elimination System (NDPES) permit system (CWA § 402). This approach aims to control pollutants at the point of discharge by setting uniform discharge limitations based on the best available technology pertaining to a particular industrial category. The U.S. EPA grants states the primary responsibility of issuing NPDES permits, and monitoring and enforcing performance. When the technology-based approach does not adequately control pollution, an additional control tool, water quality-based standards, is implemented. The EPA and states use a calculation, Total Maximum Daily Load (TMDL), to determine the maximum amount of a pollutant that a waterbody can receive while still meeting water quality standards. Water quality standards are set by designating a “beneficial use” (i.e., fishing, swimming, drinking) for each waterbody as well as the criteria to protect the designated use of that water. The TMDL calculation is a multi-step process: first, the state lists each impaired waterbody within its jurisdiction, called the “303(d) list”; second, using the state’s already-established “beneficial use” categories, a numeric TMDL is calculated for each waterbody; finally, a portion of the load is allocated to each discharger.
However, efforts by the EPA are underway to make water quality modeling, specifically targeted at regulators implementing TMDLs and water quality standards, more easily accessible and affordable (EPA 2015).
Similar to the Clean Water Act, California’s Porter-Cologne Act gives broad authority to nine Regional Water Quality Control Boards (“Regional Boards”) to regulate water quality at a sub-state, localized scale. Regional Boards are responsible for water quality protection, permitting, inspection, and enforcement actions (Water Code §13225(a)). Any discharger that could affect water quality must obtain a permit to pollute (“Waste Discharge Requirement,” which is similar to a NPDES permit). The Regional Board issues permits on the condition that beneficial uses are protected and water quality objectives will be met. The Regional Boards also have the right to waive Waste Discharge Requirements (WDRs) for individuals or groups, including agriculture, if it is in the public interest (Water Code §13269). For agricultural discharges, Regional Boards have historically granted waivers rather than force growers to comply with WDRs. In October of 1999, with water quality high on the political agenda, Senate Bill 390 (S.B. 390) was passed, mandating that Regional Boards attach conditions to waivers and review them every five years (called “Conditional Waivers of Waste Discharge Requirements” or “Conditional Waivers”). All waivers need to include monitoring requirements for discharges that pose a risk to water quality. Such monitoring requirements must be adequate to verify the effectiveness of the Waiver’s conditions (Monterey Coastkeeper, et al. v. SWRCB 2015). In effect, the Conditional Waivers function similarly to Waste Discharge Requirements: the discharger needs to meet conditions specified in the Waiver/Permit.
Each Regional Board has taken a different approach to controlling runoff from agricultural lands within their jurisdiction (Newman 2012), but almost all have issued Conditional Waivers. In 2004, the Central Coast Region (Region 3) was the first to adopt a Conditional Agricultural Waiver (“Ag Waiver”). The conditions attached to the 2004 Waiver required growers to enroll in the Agricultural Waiver program, complete 15 hours of water quality education, prepare a farm plan, implement water quality improvement practices, and complete individual or cooperative water
quality monitoring. The 2004 Agricultural Waiver expired in July 2009, but the Order was extended five times from 2009 until 2012.
protecting regional water quality and needed to develop more stringent conditions.
III. Research Justification
A more contextualized story of adopting the 2004 and 2012 Ag Waivers is laden with complex and contentious trade-offs, negotiations, lobbying efforts, alliance building, scientific findings, and difficult to foresee “focusing events” (see Kingdon 1995). The aim of this research is to use research-driven evidence to assess the Ag Waiver policy process and outcomes. This study pays special attention to assessing the effectiveness of the monitoring program and significance of data collected under the Conditional Agricultural Waiver. Monitoring data is arguably the most pressing concern for nonpoint source pollution control plans. This Central Coast case illustrates a common trend in nonpoint source (NPS) pollution control and what Sunstein (1990) would mark as “regulatory failure due to information limitation.” The current monitoring data on agricultural water discharges are inadequate to allocate TMDLs and therefore implement and enforce water quality standards. In the absence of sufficient data, the Ag Waiver regulatory program cannot comply with state and federal law, and water protections are further delayed (Wittemore and Ice 2001). In an attempt to comply with water quality standards, the Central Coast Regional Board has endeavored to ratchet up monitoring efforts. For example, the updated 2012 Agricultural Waiver program modestly expanded the amount of information it requires of Tier 3 growers to include some individual monitoring. Unfortunately, many are skeptical that this more “robust” monitoring program will, in practice, amount to much more in terms of useful information than the previous (2004) monitoring program, especially given the small number of growers in Tier 3. This study fills a gap in research on where monitoring efforts have succeeded and failed in the Central Coast’s agricultural NPS pollution control policies and in reaching TMDL goals.
There is also a growing need to identify realistic tools for water quality agencies charged with the difficult task of regulating agricultural NPS pollution. While this study will tailor recommendations specifically to the Central Coast Region, other states and localities facing similar difficulties can utilize results from this research to better manage agricultural pollution with their jurisdiction.
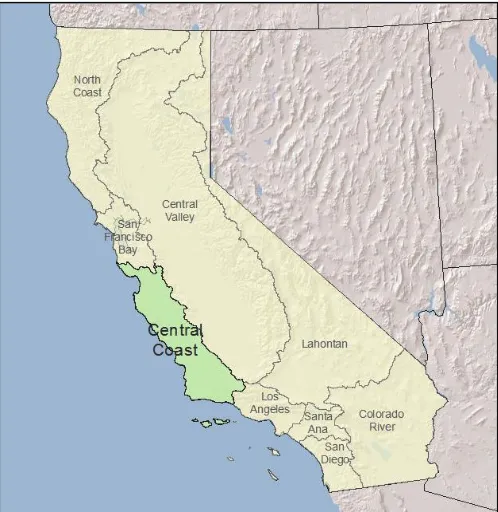
Figure 1. The Central Coast Region
IV. Case Study Selection
The Central Coast Region (Figure 1) stretches 300 miles from San Mateo County in the north to Santa Barbara County in the south, and is composed of 17,000 miles of streams and rivers and 4,000 square miles of groundwater basins. The 2010 Surface Water Ambient Monitoring program report found that the Central Coast had the highest percentage of highly toxic waters in the state, of all sites samples, 22% were considered “highly toxic” (i.e., the mean for all samples from the site was more toxic than the high toxicity threshold) (Anderson et al. 2010). The topography is defined by several coastal mountain ranges including the Santa Lucia Range, closest to the coast, the Gabilan and Diablo ranges in the north, the Cholame Hills in the center and La Panza ranges in the south (DWR 2009). Three major valleys are nestled among mountain ranges. They are, in order of size: the long Salinas Valley, stretching 120 miles from Moss Landing to Santa Margarita and two smaller valleys, the Pajaro Valley in the north adjacent to the Salinas, and the Santa Maria Valley in the south.
strawberries, raspberries, artichokes, asparagus, broccoli, carrots, cauliflower, celery, and herbs (EDD 2012). While several microclimates exist, overall the region has a temperate, Mediterranean climate characterized by mild, wet winters, and warm, dry summers (DWR 2009).
V. Methods
Both analyses will use a within-case method of “process tracing,” also called “historical analysis” or “detailed case studies” (King, Keohane, and Verba 1994) to assess the factors that acted as drivers or limitations to developing the 2004 and 2012 Ag Waiver. Using in-depth qualitative methods and focusing on the single case of the Central Coast Region allows numerous variables and conditions to be explored to see which ones “activate” a particular outcome (George and Bennett 2005). The goal of this process is to tease out which causal factors—be they part of the policy process or mechanisms embedded in the policy tool itself—contributed to the development of the 2004 and 2012 Agricultural Waiver. This strategy utilizes variation in the dependent and independent variables, an approach that has been successfully employed in social science research (George and Bennett 2005).
Though a general causal hypothesis can be made that certain independent variables (factors within the policy and implementation process, such as budgetary and staff constraints) have a causal effect on policy-making, process tracing allows the researcher to narrow down the list of potential influential causes as well as uncover independent variables that otherwise would have been left out (George and Bennett 2005). Process tracing can also identify whether or not these influential variables have a positive or negative effect on the policy outcome. Such a research design is as an iterative, cyclical process—a broad hypothesis can be refined as more data are gathered. King, Keohane, and Verba (1994) explain that this type of “exploratory investigation”—selecting on the basis of variance in dependent and independent variables—generates a more precise hypothesis than that which can be made at the beginning.
Process tracing requires an in-depth understanding of causal mechanisms in the policymaking process in each case, relying on data from newspapers and magazine articles, websites, meeting minutes, policy documents, government reports, public comments, monitoring and enforcement data, and other
archival documents. Key informants for this part of the current research include Regional Water Board staff, university extension specialists, agricultural organizations, growers, water quality agencies, and stakeholders involved in water quality efforts. Interviews were conducted in a semi-structured manner and key informants were identified using “snowball” sampling—starting with a few identified stakeholders who then share names of additional significant individuals to interview. In this study, data from interviews are used help contextualize events, perspectives, language or definitions and reaffirm information identified during the document analysis.
VI. Policy Analysis Part 1: Forces Driving and Impeding Policy
A staff member at the Regional Board described why agricultural water pollution became a priority in the region: “what is different about the Central Coast Region [compared to other Regions], is that there is a real problem with drinking water here. It was the choice of a few people acknowledging that ‘this is a problem’ and it was time to move forward with more enforcements” (Interview with Regional Board staffer, October 3, 2012). At the same time, political alliances were being forged between unlikely interests groups (e.g., the Farm Bureau and environmentalists) and water quality was becoming a statewide concern. According to a UC Extension advisor, during the first 2004 Ag Waiver process, participation and cooperation amongst the agricultural community helped move the regulatory process along:
Recognizing the problem was not going to fade, the Farm Bureau decided to jump on [the water quality issue] when it first started. The [Farm] Bureau became instrumental in calming [the growers] down. They decided to be pro-active and work with others to convince the farming community that [water quality control measures] were worth investing in. (Interview with UC Extension agent, February 4, 2013).
assumption that future Ag Waivers would gradually increase requirements if water quality did not improve.
Just as water quality was rising on the agenda, circumstances changed and priorities shifted. In September 2006, two years after passing the first Agricultural Waiver, an E. coli outbreak traced to the Salinas Valley killed three people and sickened more than 200 (Stuart et al. 2006). Due to public concern, large supermarket chains including Safeway and Costco Wholesale Corporation, demanded that growers have more stringent food safety requirements (Stuart et al. 2006). The E. coli sources of highest concern were from animals passing through crop fields. Subsequently, food safety auditors began requiring a “scorched-earth” policy including minimizing any vegetative habitat around farms that could attract wildlife. One farmer stated that the “Western Growers Association said they wouldn’t buy anything from farms with vegetative buffer strips.” Because maintaining vegetation on a field’s edge protects water quality from discharging into nearby waterbodies, calling for its removal could threaten efforts to address water pollution on the Central Coast (Stuart et al. 2006). The E. coli “focusing event” (see Kingdon 2003) forced the Regional Board to rethink this key provision (vegetative buffer strips), which was already under discussion in drafts of the updated Agricultural Waiver. Mandating vegetative buffer strips for all farms would, quite literally, compete with food safety requirements, which require farms to clear vegetation. The contradictory food safety requirement (remove vegetative buffers) versus water quality requirement (install vegetative buffers) left growers confused about which policies to follow. A representative from the Farm Bureau voiced frustration on behalf of the agricultural community, “ever since E. coli there has been a series of complex overlay of regulations” (Interview with Farm Bureau representative, February, 2013). Two additional issues related to buffer implementation concerned growers: the cost and the science driving the policy. Growers worried about the price not only of installing, irrigating and maintaining the new vegetation around their farms, but also the lost revenue from taking cropland out of production and replacing it with vegetation. Moreover, some agricultural stakeholders contended that the science driving this mandate was inadequate. The improved water quality from
vegetative buffers, including pollutant, nutrient and sediment retention, infiltration, sediment deposition, and absorption are well documented in the literature (see Arora et al. 2010, Mayer et al. 2007, Balestrini 2011). However, regional agronomic research demonstrating the effectiveness of vegetative buffers is limited to only a few studies, and their results are mixed, especially in regards to the most effective width-size and vegetation (Los Huertos 1999, Rein 1999). Buffer width became a cornerstone of debate since the jury was still out on exactly how wide a buffer should be to improve water quality. The results of a meta-analysis of over 80 scientific articles on vegetated buffers and sediment trapping efficacy concluded that while wider buffers provide a longer “residence” time for runoff water and thus, are more effective in reducing sediment, sediment trapping efficacy does not improve significantly when buffer width was increased beyond 10 meters (Liu et al. 2007). In other words, beyond 10 meters, the law of diminishing returns takes effect. The analysis by Liu and colleagues also concludes that buffer width alone only explains about one-third of retention effectiveness, and other factors, such as soil, slope and vegetation play an equally important role. Because of these competing interests, the vegetative buffer requirement was substantially weakened throughout the Agricultural Waiver deliberation process. The 2010 Draft Waiver proposed that all farms should be required to implement a 50-100-foot buffer; by November of that year the mandate was reduced to only Tier 3 farms and the buffer width was reduced to 30 feet, and by the final 2012 Waiver the buffer requirement was left largely to the discretion of the agricultural operator, stating that either a buffer or a proposed alternative must be implemented to protect adjacent polluted waterbodies.
mobilization of several interest groups pushed agricultural water pollution back on the agenda. Water quality data collected over the preceding five years from the 2004 Ag Waiver Cooperative Monitoring Program clearly showed discharges from agricultural lands were a cause of pesticide toxicity as well as a contributing source of nitrate and sediment impairments in the region (CCRWQCB 2012). Due to growing concerns about one contaminate in particular, nitrate, a 2008 Senate Bill (S.B. X2-1) was passed, requiring the State Water Resource Control Board to prepare a report addressing nitrate groundwater contamination. The Center for Watershed Sciences at the University of California, Davis conducted the report, and one of the watersheds they chose to study (because of known nitrate-contamination) was in the Central Coast region. Additionally, the 2010 State Water Resource Control Board Report found that the Central Coast Region had the highest percentage of toxic water sites statewide. Furthermore, several scientific reports found that pesticide use in the Central Coast was contributing to water column and sediment toxicity (Anderson et al. 2003), as well as cause human health problems, such as developmental delays in infants and children (Perera et al. 2006).
The Regional Board staff had the scientific evidence and momentum it needed to develop an ambitious 2010 Draft Waiver. Among the many sweeping reforms, the 2010 Draft Waiver required all discharges to conduct individual surface water discharge monitoring, required Farm Plans to be accompanied by monitoring and site evaluation results, prohibited the use of excess fertilizer, required a comprehensive list of pesticides to be regulated, and required all farms to implement vegetative buffers. Members of the agricultural community voiced their concerns with the Draft in Regional Water Board meetings, through comment letters, on the web, and in newspapers. In a December 2009 meeting, several agricultural representatives reiterated their frustrations about the public input process, their worries regarding the mounting costs, and their opinions that the existing 2004 Ag Waiver was working well and did not need to be amended. Environmentalists, on the other hand, believed the proposed Order should be adopted without further delay. At a standstill, the Board re-issued the existing Conditional Waiver four
more times: November 2010, March 2011, July 2011, and August 2011.
Environmental groups, with agendas ranging from environmental justice to marine ecosystem protections to urban stormwater programs, were highly disappointed that the 2010 Draft Waiver was not adopted. The environmental community was strongly represented by the Santa Barbara Channelkeeper, The Otter Project, and Monterey Bay Keeper, providing extensive comments at Regional Board meetings up until the adoption of the 2012 Agricultural Order.
In 2012, published results from the State commissioned nitrate contamination study, although controversial among the agricultural community, found that cropland was the primary source (96%) of human-generated nitrate contamination in the Tulare Lake Basin and the Salinas Valley (located in the Central Coast), and that 254,000 people in the area are at risk for nitrate contamination in their drinking water. Because nitrate-contaminated drinking water is a well-known human health effects, including “blue baby syndrome” (Knobeloch et al. 2000), the results of this study became a rallying-cry for the Department of Health to encourage a more stringent Agricultural Waiver.
Discharge Elimination System (NPDES) permits. As the City Manager of Monterey, for example, suggested that agricultural industries and municipalities should be held to the same standard (Meurer 2011).
On the other side, Farm Bureaus, individual growers and the Growers and Shippers Association represented the agricultural interests. California’s $43.5 billion agriculture industry comprised of 81,500 farms spread over 25.4 million acres is one of the largest and most influential interest groups in the state (USDA 2011). Historically, the California Farm Bureau has had success at regional and national lobbying efforts. Between the two Agricultural Waivers (2004 and 2012), there were grumblings amongst the agricultural community that the Regional Board was not involving the growers in the deliberation process as much as during the 2004 Ag Waiver negotiations. As one farm stakeholder explained, growers felt they were not involved when figuring out solutions to water quality improvements, rather “[the Regional Board] set the rules without much input and expected growers to comply.” As a lettuce grower in the Salinas Valley stated, “the Regional Board didn’t take into account stakeholder opinion...The elephant in the room...[was] that there was no collaboration between the grower community and the regional water board staff... Discussions about the [Agricultural Waiver] and how to implement it should have been happening during the past four years, but it did not” (as cited in Campbell, 2012). Several board meetings leading up to the March vote were packed with testimonies from agricultural interests assembling to delay the vote and water quality interest groups, encouraging the Board to pass a more stringent updated Agricultural Waiver. Steve Shimek (2012b), spearheading the environmental interests, described the dualistic nature of the unfolding politics: “on one side are community activists seeking tougher pollution limits and public access to water quality data. On the other side are too many farmers trying to avoid cleaning up the waste from their operations.” At the March 15, 2012 Board meeting, the three-year long debate culminated in the passage of an updated Agricultural Waiver.
But the process was not over. As mentioned earlier, five groups requested a deferral on several provisions of the 2012 Ag Waiver. In September of 2013 the State Board adopted the existing Ag Waiver,
which made some modifications to the 2012 version passed by the Regional Board. A few months later, environmentalists filed a lawsuit in Sacramento Superior Court challenging the modified 2012 Ag Waiver as being too weak. The modified waiver and lawsuit will be discussed in more detail in the next section.
Overall, the policy process leading up to the 2012 Ag Waiver was fraught with tension between a variety of stakeholders, including agriculture, cities, environmentalists, scientists and environmental justice groups. Consequently, the Waiver that ultimately passed was more robust than its 2004 predecessor, but weaker than ambitious draft orders that came to the fore during negotiations (e.g., 2010). The next part of this paper will analyze the effectiveness of the resultant provisions embedded in both Ag Waivers.
VII. Policy Analysis Part 2: Policy Outcomes Public policy literature presents several means to assess the efficacy of a policy. The criteria chosen for policy analysis is important, as it could influence the direction of the policy as well as future budget allocations. Cass Sunstein (1990), former Administrator of White House Office of Information and Regulatory Affairs for the Obama administration, asserts that determining the success or failure of a regulation depends on its goals and scope. Dowd and his colleagues (2008) echo this claim in their paper on agricultural nonpoint source pollution policy in the Central Coast, stressing that the success of the Agricultural Waiver largely depends on the evaluative criteria used. Six parameters were carefully selected to measure the effectiveness of the 2004 and 2012 Ag Waivers: 1) complying with mandates set in the Agricultural Waiver, 2) evaluating quantifiable water quality improvements, 3) evaluating the requirements themselves, 4) assessing the significance of monitoring data, 5) comparing costs to growers vs. broader societal and environmental benefits, and 6) evaluating the equity of compliance across growers, including the distributive consequences.
Embedded evaluative criteria in the Agriculture Waiver
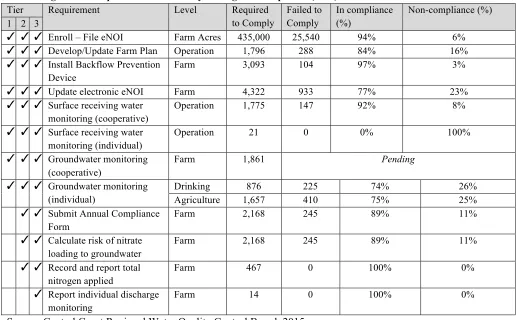
the degree to which growers met the compliance requirements. Based on the high level of enrollment in the 2004 Agricultural Waiver (1,800 operations, who manage 93% of the total regional acreage) the 2004 Waiver has been labeled a success by simple participation among growers. The number that completed The 2012 Ag Order boasts roughly the same enrollment numbers: 1,796 operations managing 94% of farm acreage in the region.
Evaluating compliance based on specific 2012 requirements, however, is more variable (See Table 1). As Table 1 indicates, there is a high compliance rate for simply enrolling in the program, but slightly less so in regards to more complex requirements. For example, close to a quarter of all farms have not reported groundwater monitoring at the individual level for both domestic drinking water and agricultural wells. On the other hand, every farm (100% compliance rate) that is required to report total nitrogen applied to their farm has done so.
Water quality improvements
Despite high compliance rates, the Ag Waiver has resulted in uncertain water quality gains. A number
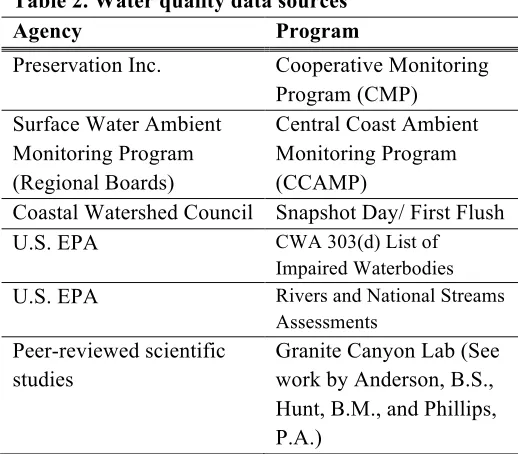
of water quality monitoring programs can be used to determine whether regional waterbodies are getting cleaner or more degraded since the implementation of the Ag Waivers. This assessment summarizes a subset of relevant water quality databases, reports, and scientific studies (see Table 2).
The Clean Water Act Section 303(d)list1 of Impaired Waterbodies for the Central Coast Region can be an indication, albeit a limited one, of how water quality has changed over time. Two relevant listing cycles, 2006 and 2010, indicate a dramatic increase in the number of polluted waterways in the Central Coast. Over these four years, Regional Board staff added 515 listings of impaired waterbodies, totaling 707 in the 2010 listing cycle (CCRWQCB 2009). Agriculture is a source of impairment in the majority of these listed waterbodies. While these numbers are striking,
1 The “303(d) list” is short for the list of impaired and threatened waters that the Clean Water Act requires all states to submit for EPA approval every two years. The states identify all water where required pollution controls are not sufficient to attain water quality standards.
Table 1. Ag Waiver Requirements - Summary of Program Compliance (2014)
Tier Requirement Level Required to Comply
Failed to Comply
In compliance (%)
Non-compliance (%) 1 2 3
✓ ✓ ✓ Enroll – File eNOI Farm Acres 435,000 25,540 94% 6%
✓ ✓ ✓ Develop/Update Farm Plan Operation 1,796 288 84% 16%
✓ ✓ ✓ Install Backflow Prevention Device
Farm 3,093 104 97% 3%
✓ ✓ ✓ Update electronic eNOI Farm 4,322 933 77% 23%
✓ ✓ ✓ Surface receiving water monitoring (cooperative)
Operation 1,775 147 92% 8%
✓ ✓ ✓ Surface receiving water monitoring (individual)
Operation 21 0 0% 100%
✓ ✓ ✓ Groundwater monitoring (cooperative)
Farm 1,861 Pending
✓ ✓ ✓ Groundwater monitoring (individual)
Drinking 876 225 74% 26%
Agriculture 1,657 410 75% 25%
✓ ✓ Submit Annual Compliance Form
Farm 2,168 245 89% 11%
✓ ✓ Calculate risk of nitrate loading to groundwater
Farm 2,168 245 89% 11%
✓ ✓ Record and report total nitrogen applied
Farm 467 0 100% 0%
✓ Report individual discharge monitoring
Farm 14 0 100% 0%
Table 2. Water quality data sources
Agency Program
Preservation Inc. Cooperative Monitoring Program (CMP)
Surface Water Ambient Monitoring Program (Regional Boards)
Central Coast Ambient Monitoring Program (CCAMP)
Coastal Watershed Council Snapshot Day/ First Flush
U.S. EPA CWA 303(d) List of
Impaired Waterbodies
U.S. EPA Rivers and National Streams
Assessments
Peer-reviewed scientific studies
Granite Canyon Lab (See work by Anderson, B.S., Hunt, B.M., and Phillips, P.A.)
trends using these data should be made with caution for at least two reasons: 1) the number of waterbodies assessed for the 303(d) list varies from year-to-year and 2) there may be a latency period between when a waterbody was surveyed and when it is listed.
The most commonly cited monitoring databases used to assess water quality in the region (CCAMP and CMP) also indicate degrading water quality. Reports from these two agencies suggest that many of the same waterbodies, especially in the two areas responsible for most water pollution, are more polluted than they were a decade ago (CCRWQCB 2011). While some waters have improved—47 waterbodies were de-listed as impaired in 2010— the vast majority have not. The lower Salinas watershed and the lower Santa Maria area are responsible for most of the region’s polluted waters; these areas are also the leading agricultural producers in the Central Coast (CCRWQCB, 2011). The 303(d) list, CMP, CCAMP, CWC, and scientific studies from the UC Davis Marine Pollution Studies Laboratory at Granite Canyon, identify a number of water quality concerns, in particular, dissolved oxygen, elevated pH, elevated nitrate and ammonia, water and sediment toxicity, and habitat disturbances. Monitoring patterns show that these pollution parameters are variable throughout the region, and that particular watersheds are hotspots for certain pollutants. When listed together, these parameters are responsible for impairments to the beneficial uses of drinking water, recreation, aquatic
life, and agricultural uses. Of these concerns, nitrate contamination is the most serious and widespread problem in the region.
Regional water quality reflects a larger state and national trend of degrading and variable water conditions. California Water Boards’ Annual Performance Report (2010-2011) found half of all surveyed streams in the state to be degraded or very degraded, as measured by the health of aquatic organism communities that live in the state’s streams. The bioassessment studies show a clear relationship between increased water pollution and increased agricultural and urban land use (Worcester 2011). Agriculture impairs approximately 9,493 miles of streams and rivers and 513,130 acres of lakes on the 303(d) list of waterbodies statewide (SWRCB 2010).
Nationwide, agricultural nonpoint pollution is the chief impediment to achieving national water quality objectives (EPA 2010). The EPA lists the chief components of these nonpoint source agricultural pollutants as nitrogen and phosphorus from
fertilizers, pesticides, animal sources, soil erosion, and salts from irrigated fields. The National Rivers and Streams Assessment, conducted by the U.S EPA in 2004 and again in 2008/9, uses separate monitoring data from the 303(d) listings. Over the course of five years, between 2004 and 2009, the Assessment found seven percent fewer stream miles were in good biological condition. Similar to the Central Coast, throughout the U.S. changes to water quality in streams were variable over time and space. Overall, the report found that U.S. streams and rivers are “under significant stress and more than half exhibit poor biological condition” (EPA 2009). Despite the diverse datasets, frequency and consistency of monitoring data is still not sufficient to verify the effectiveness (measured by improved water quality) of the Agricultural Waiver (Monterey Coastkeeper, et al. v. SWRCB 2015, Worcester 2011). The following two sections will assess the value of the Ag Waivers requirements, particularly the monitoring provisions.
A Closer look at the Ag Waiver Requirements
increasingly improved management practices until the region has achieved clean water. This approach recognizes that progress towards achieving water standards can take time. Logically, the 2012 Waiver should be significantly more rigorous than its predecessor. While Tier 3 farms might have more stringent requirements, a handful of significant provisions for Tier 1 and 2, which make up 99% of all growers, have been so watered-down and in some cases eliminated that the 2012 Ag Waiver has been regarded as “only marginally stronger than the 2004 Ag Waiver” (Monterey Coastkeeper, et al. v. SWRCB 2015).
Several examples illustrate this point. First, in its modifications to the 2012 Agricultural Waiver, the State Board eliminated the only enforceable provision that would control nitrogen pollution— the nitrogen balance ratio target2. Instead, growers now only need to report the total N applied. Even with the 100% compliance rate of this mandate, the total N reporting provides substantially less information about which farms have nitrogen surpluses and might be contributing to pollution. Second, and arguably most importantly, the Ag Waiver does not have any quantifiable mechanisms to determine if management practices implemented by Tier 1 and 2 farms reduce pollution (Monterey Coastkeeper, et al. v. SWRCB 2015). Third, choosing which management practices to implement is largely up to the discretion of agricultural operators. The Ag Waiver does not define what management practices should be implemented or verify if those practices are actually improving water (Monterey Coastkeeper, et al. v. SWRCB 2015). Though management practices are a means to reduce pollution discharges and achieve water quality, the California’s Nonpoint Source Policy establishes that “management practices may not be substituted for actual compliance with water quality standards” (SWRCB 2004).
2 Agricultural nitrogen balance ratios can indicate which farms are at risk to nitrogen pollution. The ratio tracks the amount of nitrogen input to and output from the farm, and calculates the potential surplus of nitrogen on the farm. This surplus nitrogen (the amount not used by crops) can runoff or leach into nearby waterways, causing polluted. The aim is to achieve a one-to-one input-to-output ratio.
One new requirement that can aid the Regional Board in estimating improved water quality is the mandate to report all water quality management practices and outcomes. The online form requires growers to check all nutrient, irrigation, pesticide and sediment management practices that are being implemented and the number of acres on which the practices are applied. While this new tool will provide baseline data for the Regional Board to better understand how growers say they are managing their land and crops, there are no means to verify if those management practices are effective. Growers have the opportunity to report if they have seen a positive outcome from their implemented management practices, yet outcomes are measured by the grower’s perception of change rather than a numeric or quantifiable water quality data. For example, in the 2014 annual compliance form, the most commonly used method to confirm sediment reduction was by walking the perimeter of the property to verify erosion controls were in place and that sediment did not leave the ranch/farm during irrigation events and/or storm events; the least commonly used method to confirm sediment reduction was to measure turbidity in stormwater runoff.
Monitoring, will the data be meaningful?
The Agricultural Waiver has significant monitoring limitations. In the 2012 Ag Waiver, the Regional Board acknowledged that a critical limitation of the 2004 Ag Waiver was “the lack of discharge monitoring and reporting... and the lack of public transparency regarding on-farm discharges” (CCRWQCB 2012). The 2015 Superior Court Judge ruling reiterated this point: “The 2004 Waiver has not been successful because it lacks adequate standards and feedback mechanisms to assess the effectiveness of implemented management practices in reducing pollution and preventing further degradation of water quality.” Despite adding a handful of modest monitoring requirements to contend with these limitations, the updated 2012 Ag Waiver suffers from the same shortcomings as its predecessor.
points to the most controversial Ag Waiver topic: public disclosure and transparency of information. The most effective means of identifying a polluter is to conduct individual discharge monitoring at the edge of a discharger’s field where pollutants enter the water. Because of its controversial nature, and the difficulty to collect data from thousands of individual farms, the 2012 Ag Waiver compromised by mandating that only the highest risk polluters— Tier 3 farms—need to report individual surface discharge monitoring. The biggest fear among growers is that of being identified as a point source polluter, and subsequently regulated under WDRs or NPDES permits, rather than a Waiver. As one Regional Board staff member put it, growers “don’t want to deal with a government agency managing their land and water, and they don’t want to be called part of the problem.” With individual discharge monitoring requirements as the driving force, growers did anything they could to get out of Tier 3. Farm operations split their ranches into sub-parcels, stopped using certain pesticides, or stopped farming altogether. To depict the drastic exodus out of Tier 3, in 2010, over 10% of farms were categorized in Tier 3, yet as of September 2015, only 1% of all farms in the Region are regulated under that Tier. As a result of the shift to lower tiers, monitoring and regulatory provisions, and the overall Ag Waiver itself, have been severely hindered, since most growers are not held to sufficiently strict mandates. A goal of requiring individual surface water monitoring of Tier 3 farms was to evaluate effects of waste discharge on water quality and beneficial uses; it remains to be seen whether data from such a small subset of growers will adequately achieve this objective.
In contrast, the 99% of other growers (Tier 1 and 2) must report surface receiving water monitoring, either cooperatively or individually. Surface receiving monitoring is conduced on the main stem of a river, rather than near a grower’s fields. For growers, this is a much more attractive scenario: data is reported as an aggregate and pollutants detected from surface receiving water data can rarely be traced back to its source. Additionally, the cost is generally less than the fees associated with the individual surface water discharge Sampling and Analysis Plan (SAP) and Quality Assurance Project Plan (QAPP).
Monitoring challenges are exacerbated by the diffuse nature of nonpoint source pollution. Because
agricultural runoff does not enter a stream at a well-defined point, and often occurs episodically (Andreen 2004), continuous or targeted monitoring (i.e., set on a monthly or seasonal basis) are needed to evaluate the rapidly changing and dynamic local environmental conditions. Growers and the cooperative monitoring program are not required to collect data at the same time or even during the same rain event, making it difficult to compare results and establish trends. A nonprofit, the Coastal Watershed Council (CWC), has attempted to address this problem by testing several water parameters in watersheds throughout the region during the first rain event, or “First Flush”, in their annual Snapshot Day. By collecting water quality data during the first rainfall, the CWC attempts to capture the most concentrated pollutants washing off the landscape in significant levels at the same time from year to year. The CWC’s Snapshot Day found nutrients and turbidity from agriculture and urban areas to be a major source of regional water contamination. However, the CWC program is volunteer-based and has a limited capacity to carry out high quality comprehensive monitoring.
Costs vs. Benefits
A related complaint by growers is that they will be substantially harmed by the cost of compliance. A 2012 Ag Alert article reported that the regulatory requirements in the 2012 Order amounted to more than $230 million in lost revenue and an estimated 2,500 to 3,300 in lost agricultural jobs (Campbell 2012). The Growers-Shippers Association of Central California added that the adopted regulations are “over-board and intrusive on grower operations” (as cited in Campbell 2012). Some growers claim that the compliance costs are unwarranted because farm management practices similar to the ones being mandated are already in effect. A representative from the Santa Cruz Farm Bureau voiced the agricultural community’s frustrations, “in general, there has been a lot of concern about the regulations being applied. In particular, the Regional Board did not take into consideration what was already being done on the farm. [The Agricultural Waiver] adds a financial and time burden on growers.”
compliance would amount to 1.3-2.5%, 0.13-0.3%, and 0.8-1.5 % of gross crop revenues per acre for leaf lettuce, strawberry, and head lettuce, respectively. Some asserted that the methods employed in the agricultural group’s cost analysis were “not credible” and the numbers were “inflated,” and “self-serving” (Shimek 2012b). In its argument against the agricultural industry’s estimated compliance costs, the Regional Board claimed that because the potential costs vary widely from farm to farm it is impossible to estimate the range over all farms. Another example of cost discrepancies was in the estimated monitoring expenditures for the two pesticides regulated in the Ag Waiver, diazinon and chlorpyrifos: the Regional Board estimated the total cost to monitor these two pesticides would be $250 per farm, whereas the agricultural petitioners estimated $7,000 to $11,000 per farm.
It is nearly impossible to put a dollar value on the public health and ecological benefits gained from the two Agricultural Waivers, but it is worth mentioning some potential benefits from the Ag Waiver. In their rebuttal to the request for a “stay,” the Regional Board listed several environmental benefits that would result from the 2012 Agricultural Waiver including improved drinking water, overall public health, decreased pollutant loadings in surface and groundwater, reduced threat to sensitive aquatic habitats, and more stabilization of stream banks in riparian areas. Whether these improved societal and environmental conditions outweigh the estimated 0.8-2.5% of gross crop revenues it would cost to comply will largely depend on who is asked.
Equity of Compliance and Distributional Consequences
Issues of equity are at the heart of public policy controversies (Stone 2002), and can be used to measure policy effectiveness two ways: fairness (even distribution of benefits) or redistribution (channels costs disproportionately to those that lack them or channels costs to the biggest hazards) (Salamon 2002). A related distributive conflict concerns communities disproportionately affected by a given policy. Factors that may play a role in measuring equity through the lens of environmental justice include (1) the level of participation among stakeholders and/or (2) distributive outcomes of pollution (OTA 1995). These types of concerns harken back to the founder of policy studies, Harold Lasswell (1936), who encouraged policy scholars to
ask: “Who benefits? Who gets what, when, and how?” Answers to such questions attempt to uncover the inevitable unequal allocation of resources that result the dynamic relationship of power and bargaining inherent in the making of any set of rules and regulations (Mahoney and Thelen 2010).
In the case of the Central Coast Ag Waiver, three main distributional consequences of compliance have been highlighted as unfair. The first two are contestations among growers themselves. First, Tier 3 growers contend that the three-tiered system is imbalanced because it distributes a substantially higher burden on a small number of farms. This assertion represents a classic policy paradox: “equal treatment may require unequal treatment; and the same distribution may be seen as equal or unequal, depending on one’s point of view” (Stone 2002). From the Regional Board’s perspective, requiring more stringent and costly compliance standards for higher-risk farms is more fair than holding all regulated entities to the same standards. “If they are rational,” argues Sunstein (1990), “agencies will bring enforcement actions against the most dangerous violator.”
Another group of growers feel the Agricultural Waiver is unfair for a different set of reasons. This agricultural group asserts that while they are attempting to comply with the Waiver’s provision (i.e., enrolling in the waiver, implementing BMPs, paying an agency to monitor), other growers are able to get away with non-compliance due to a lack of enforcement. A farm advisor told a story of a San Benito County farmer that was “jumping through all the hoops to comply with the Agriculture waiver regulations saying, ‘I’m paying to have my tailwaters and wells tested, but how can I compete in the marketplace if my neighbor’s polluted tailwaters come through my farm and is not doing anything to comply? I cannot ask the market to give me a higher price for my crop to help offset the expenses.’” This statement speaks directly to the uneven impacts resulting from insufficient enforcement as well as the tough political economic conditions under which farmers are operating in the region.
and risk to water quality. The Regional Board received several comment letters from smaller farms, perhaps like the one in the San Benito case, who were concerned about requirements being overly burdensome due to their size. Because of these concerns and because smaller farms may (but not definitely) pose a smaller risk to water quality, they have been placed in Tier 1 with the least costly and onerous requirements. There was also some dialogue of creating an even lesser tier with no requirements for those farms that have very minimal discharges to act as an incentivize curtailing pollution. However, a “Tier 0” would be the equivalent of stopping pollution altogether, and in such a case a farm would not have to apply for a permit at all. For Tier 2 and 3 farms, the option of transferring to a lower Tier does exist, however. Additionally, governmental and third party agencies have established programs to provide technical and financial assistance to help growers achieve compliance mandates. For example, Section 319 of the U.S. Clean Water Act provides territories and tribes with grants for nonpoint source pollution. In 2012, these grants provided $164.5 million for pollution abatement projects throughout the country (EPA 2012). Another department, The U.S. Department of Agriculture Natural Resource Conservation Services (USDA-NRCS), works closely with landowners and growers to provide cost-share, technical assistance, and economic incentives to implement BMPs for water quality improvement. The USDA’s Conservation Reserve Enhancement Programs and the NRCS’s Environmental Quality Incentives Program (EQIP) offer free consultation and financial services to growers who implement best management practices (BMPs) for water quality protection. Nongovernmental agencies, such as the Community Alliance for Family Farmers (CAFF), offer similar assistance to growers, particularly those in need of help financing and installing native vegetative buffer strips, which in the early phases of Ag Waiver negotiations was presented as a particularly challenging hurdle for Tier 3 farms. Consulting groups that aid in the implementation of BMPs in California include the University of California Cooperative Extension, academic and research institutions, and growers’ consortia.
The concept of fairness and equity in regulations and monitoring also exist between different groups of stakeholders. In his opening remarks at a pivotal regional board meeting concerning the 2011 draft
order (March 17, 2011), Assistant Executive Director to the Regional Board, Michael Thomas, aptly addressed this concept of fairness:
[Fairness] depends on who you are. If you’re a farmer struggling to make a living today in this environment of increasing regulations from multiple agencies like ours, of if you are a fisherman…who’s fishing in Oso Flaco Lake, that lake is now posted because of contamination in fish tissue due to pesticides, or if you’re a person who’s relying on groundwater as a drinking water source, and that water is contaminated, [that] picture can look very different.
In his testimony, Mr. Thomas also added that different sectors might perceive an unequal fairness in how much they are being regulated. Urban stormwater is regulated heavily because of its high threat to water quality, yet timber and agriculture are regulated the least, despite agriculture being the primary source of water contamination in the region. Municipalities in the area, such as the City of Monterey (Meurer 2011), agree that the urban sector incurs a higher degree of regulation and costs of compliance than do its agricultural counterpart.
VIII. Conclusion and Policy Recommendations As runoff from crop fields continues to pollute waters throughout the Central Coast, policymakers are increasingly forced to tackle the monumental task of how to best regulate agricultural discharges. Several complicated factors either drive or constrain improved water quality management and pollution control. In California’s Central Coast, conditions that have weakened agricultural water pollution policies in the region include budgetary and staff constraints, the 2006 E. coli breakout, and the powerful agricultural lobby. On the other side, environmentalists, environmental justice groups, health organizations, scientific studies, S.B. 390, and the 2015 California Superior Court ruling have pushed the Regional Board to develop more comprehensive water quality protections.
good thing... And it will inevitably impact growers’ approach to [fertilizer] inputs in the future, including cover cropping and nutrient management plans.” Though best management practices may be better understood as a result of the Ag Waiver, water quality has still not improved as a result.
A top priority of the Regional Board should be to develop strategies for increasing adoption of effective management practices and evaluating their success through numeric water quality monitoring. No panacea exists to magically improve water quality in a short timeframe, except for barring agricultural operations altogether, which is politically, culturally and economically unfeasible. Rather, the Regional Board must use a diversified toolset, one that includes the implementation of science-driven best management practices to control pollution at its source.
A number of policy tools have successfully regulated pollutant inputs, such as the Dirty Input Limit (see Driesen and Sinden 2009) and the Netherland’s Nitrate Tax (see Mayzelle and Harter 2011). The Dirty Input Limits (DIL) approach departs from conventional environmental regulation since its focus is on inputs, or sources of pollutants. Traditionally, environmental regulation focuses on outputs, using control mechanisms (e.g., taxes, tradable permits, effluent limits) to abate pollution at the end-of-the-pipe. Most of the provisions in the Agricultural Waiver are cases in point—by monitoring ground and surface water and mandating certain BMPs in an attempt to control fertilizer runoff after they have been applied (i.e., buffer zones), the Agricultural Waiver’s regulatory tools focus on output, rather than input limits. The provision that most resembled DIL approach was the nitrate balance ratio, but as mentioned previously, the State Board eliminated this mandate in its modifications to the 2012 Agricultural Waiver. In addition to nitrate balance ratios, which targets farmers use of fertilizers, the DIL approach also targets sources of contaminants further upstream. For example, manufacturers of pollutants such as fertilizers or pesticides might be required to cap their production, creating a ripple effect through the whole production stream. In theory, this type of tool could be highly effective in reducing the amount of fertilizers produced, sold, bought, applied and discharged into waterbodies. As suggested by Driesen and Sinden (2009), this approach is useful
beyond the tool choice in that it provokes a new way of thinking about environmental regulation.
This approach has been successfully implemented in the Netherland’s as a nitrate tax, directly targeting inputs. In an attempt to decrease fertilizer use, the Netherland’s federal government implemented a hefty penalty (seven times the cost of fertilizer at the time) on excess input of nitrogen (Harter et al., 2012). The policy proved to be remarkably effective in achieving its intended objective—one monitoring study showed that nitrogen surpluses in agricultural areas fell substantially as a result of its implementation (as cited in Harter et al. 2012). In this case, the federal government had broad authority to impose a highly coercive tool. Coercive tools are likely to be more effective, and yield redistributive results (Salamon 2002); however, they are also the least politically feasible and popular because costs fall most heavily on regulated entities.
the Regional Board’s interest to continue to foster participation and cooperation with the regulated industry, since growers are ultimately the ones implementing on-farm water quality protections.
References
Anderson, Brain S., John Hunt, Dan Markiewicz
and Karen Larsen. 2010. Toxicity in
California waters. Surface Water Ambient
Monitoring Program. California State
Water Resources Control Board.
Sacramento, CA.
Anderson, Brian S., Bryn M. Phillips, John W.
Hunt, Valerie Connor, Nancy Richard, and
Ron S. Tjeerdema. 2006. Identifying
primary stressors impacting
macroinvertebrates in the Salinas River:
Relative effects of pesticides and
suspended particles.
Environmental
Pollution
141: 402-408.
Anderson, Brian S., John W. Hunt, Bryn M.
Phillips, Patricia A. Nicely, Victor de
Vlaming, Valerie Connor, Nancy Richard,
and Ron S. Tjeerdema. 2003. Integrated
assessment of the impacts of agricultural
drainwater in the Salinas River.
Environmental Pollution
124: 523-532.
Andreen, William L. 2004. Water quality today:
Has the Clean Water Act been a success?
Alabama Law Review
55(2): 537-93.
Arora, Kapil, Steven K. Mickelson, Matthew J.
Helmers, and James L. Baker. 2010.
Review of pesticide retention processes
occurring in buffer strips receiving
agricultural runoff.
Journal of American
Water Resources Association
46(3):
618-647.
Balestrini, Raffaella, Cristina Arese, Carlo A.
Delconte, Alessandro Lotti, and Franco
Salerno. 2011. Nitrogen removal in
subsurface water by narrow buffer strips
in the intensive farming landscape of Po
River watershed, Italy.
Ecological
Engineering
37(2): 148-157.
Campbell, Kate. 2012. Central Coast: State water
board issues partial stay of new
regulation. AgAlert: The Weekly
Newspaper for California Agriculture.
Central Coast Regional Water Quality Control
Board (CCRWQCB). 2009. Clean Water
Act Sections 305(b) and 303(d)
Integrated Report for The Central Coast
Region.
Central Coast Regional Water Quality Control
Board (CCRWQCB). 2011. Water Quality
Conditions in the Central Coast Region
Related to Agricultural Discharges.
Central Coast Regional Water Quality Control
Board (CCRWQCB). 2012. Order No. R3–
2012–0011: Conditional Waiver of Waste
Discharge Requirements for Discharges
from Irrigated Lands.
Central Coast Regional Water Quality Control Board. 2015. Regional Water Board Meeting, May 28. Agenda Item 15. Irrigated Lands Regulatory Program Update, Annual Compliance Form and Management Practice Data Summary. Supplemental Attachment.