International Journal of Science Technology
Management and Research
Available online at: www.ijstmr.com
IJSTMR
©
2018 | All Rights Reserved 24Farming Incomplete Values Form Large Dataset Using
Association Rules
Chandrakanta Malviya M Tech IV semester C.S.E Department
Lord Krishna College of Technology Indore M P. India
Vijay Kunar Verma Asst. Professor C.S.E. Department Lord Krishna College of Technology
Indore M P. India [email protected]
Abstract: One of the important stages of data mining is pre-processing, where we prepare the data for mining. Real-world data tends to be incomplete, noisy, and inconsistent and an important task when pre-processing the data is to fill in missing values, smooth out noise and correct inconsistencies Choosing the right technique is a choice that depends on the problem domain — the data’s domain. Some common techniques for handle missing values. There are several methods have been proposed to
construct missing value Cases with missing values pose an important challenge, because typical modelling procedures simply
discard these cases from the analysis. When there are few missing values (very roughly, less than 5% of the total number of cases) and those values can be considered to be missing at random; that is, whether a value is missing does not depend upon other values, then the typical method of list wise deletion is relatively "safe". We design an efficient approach to recover missing values for categorical data set.
Keywords: categorical attribute, missing values, recover, accuracy, incomplete
I. INTRODUCTION
Missing data may be due to – equipment malfunction, inconsistent with other recorded data and thus deleted, data not entered due to misunderstanding, certain data may not be considered important at the time of entry, not register history or changes of the data.
The Missing Value Analysis procedure performs three primary functions. Describes the pattern of missing data. Where are the missing values located? How extensive are they ? Do pairs of variables tend to have values missing in multiple cases? Are data values extreme? Are values missing randomly? v Estimates means, standard deviations, covariance, and correlations for different missing value methods: list wise, pairwise, regression, or EM (expectation-maximization). The pairwise method also displays counts of pairwise complete cases. Fills in (imputes) missing values with estimated values using regression or EM methods; however, multiple imputation is generally considered to provide more accurate results. The patterns of missing data are displayed, tabulated, and found to be random. An EM analysis is used to estimate the means, correlations, and covariance. It is also used to determine that the data are missing completely at random. Missing values are then replaced by imputed values and saved into a new data file for further analysis. List wise, pairwise, and regression estimation depend on the assumption that the pattern of missing values does not depend on the data values. (This condition is known as missing completely at random, or MCAR.) Therefore, all methods (including the EM method) for estimation give consistent and unbiased estimates of the correlations and covariance when the data are MCAR. Violation of the MCAR assumption can lead to biased estimates produced by the list wise, pair wise, and regression methods. If the data are not MCAR, you need to use EM estimation analysis of missing values by following these basic steps:
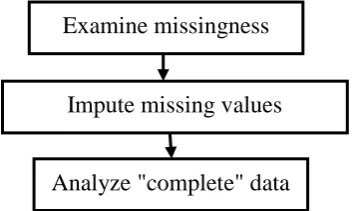
1. Examine missingness. Use Missing Value Analysis and Analyze Patterns to explore patterns of missing values in your data and determine whether multiple imputation is necessary.
2. Impute missing values. Use Impute Missing Data Values to multiply impute missing values.
3. Analyze "complete" data. Use any procedure that supports multiple imputation data. See “Analyzing Multiple Imputation Data” on page 17 for information on analyzing multiple imputation datasets and a list of procedures which support these data.
Figure 1 Missing Value Analysis steps
Examine missingness
Impute missing values
IJSTMR
©
2018 | All Rights Reserved 25 II. TYPES OF VARIABLES FOR MISSING VALUESThe analysis variables can be:
Nominal variables. A variable can be treated as nominal when its values represent categories with no intrinsic ranking (for example, the department of the company in which an employee works). Examples of nominal variables include region, postal code, and religious affiliation.
Ordinal variables. A variable can be treated as ordinal when its values represent categories with some intrinsic ranking (for example, levels of service satisfaction from highly dissatisfied to highly satisfy). Examples of ordinal variables include attitude scores representing degree of satisfaction or confidence and preference rating scores.
Scale variables. A variable can be treated as scale (continuous) when its values represent ordered categories with a meaningful metric, so that distance comparisons between values are appropriate. Examples of scale variables include age in years and income in thousands of dollars. The procedure assumes that the appropriate measurement level has been assigned to all variables; however, you can temporarily change the measurement level for a variable by right-clicking the variable in the source variable list and selecting a measurement level from the pop-up menu. To permanently change the level of measurement for a variable,
SOME OF THE MOST COMMON HABITS TO HANDLE MISSING VALUE
1. Replace missing values with the mean. For this age data, we assume that missing values are distributed similarly to the values that are present. The formal name for this assumption is Missing Completely at Random (MCAR). In this case, substituting values that represent the existing distribution, such as the mean, is a reasonable approach.
2. Replace missing values with the median. This is another justifiable way to handle missing-at-random data, although note that it gives a different answer. For categorical data, it's also common to use the mode, the most commonly occurring value.
3. Replace missing values with an interpolated estimate. Inspection of the data shows that the values in this column, years seniority, is ordered, greatest to least. This structure can be exploited by interpolating the missing value. This approach is very effective when it is appropriate, usually with time-series data.
4. Replace missing values with a constant. Sometimes missing values are Missing Not at Random (MNAR), that is, that they are missing for some reason that is reflected by what their value should be. For income, we assume that values are missing because those with very high incomes preferred not to state them. In this case, we can make a reasonable guess for what "high" means and fill in the blanks. It will still be inaccurate, but more accurate than it was.
5. Replace missing values using imputation. Imputation is a way of using features to model each other. That way, when one is missing, the others can be used to fill in the blank in a reasonable way. This example shows Multivariate Imputation by Chained Equations (MICE) in action on age, years seniority, and income. This approach is particularly powerful when features are somewhat related. In this example, someone with many years seniority is likely to have a higher age. This means that the two features share information, and that when one is absent the other can be used to estimate it.
6. Replace missing values with a missing rank. Our knowledge of how parking spaces are numbered let us make a guess here. All the space numbers from 1-11 are accounted for, so the missing one might be 12. Reasoning along these lines can be applied when data is given in the form of a rank--each item has a positive integer value, and there are no duplicates and no gaps.
7. Replace missing values with a dummy value and create an indicator variable for "missing." When a missing value really means that the feature is not applicable, then that fact can be highlighted. Filling in a dummy value that is clearly different from actual values, such as a negative rank, is one way to do this. Another is to create a new true/false feature tracking whether the original feature is missing. These two approaches work together very nicely and are both illustrated here.
8. Replace missing values with 0. A missing numerical value can mean zero. In the case of an RSVP, invitees who are not planning to attend sometimes neglect to respond, but guests planning to attend are more likely to. In this case, filling in missing blanks with a zero is reasonable.
9. Replace missing values with 0 and create an indicator variable for "missing." Replacing missing values requires making assumptions. Whenever your confidence in those assumptions is low, it is safer to also create a true/false feature indicating that the value was missing. This allows many algorithms to learn to weight those differently. In the case of RSVPs, creating a missing value column is a way of noting that there is less confidence connected to it than to a zero in which an invitee sent their regrets.
III. LITERATURE REVIEW
In 2007 Toon Calders et al. Proposed “Mining Itemsets in the Presence of Missing Values “Missing values make up an important and unavoidable problem in data management and analysis. They proposed an efficient algorithm, XMiner, for mining association rules and frequent itemsets in databases with missing values. They evaluated XMiner and empirically shows gain over a straightforward baseline-algorithm [4].
IJSTMR
©
2018 | All Rights Reserved 26 moving to situations where the optimal solution is elusive. They showed that recent techniques have come far in narrowing the gap between the ideal and the practical [5].In 2009 John W. Graham et al proposed “Missing Data Analysis: Making it works in the real world”. They reviewed and presented a practical summary of the missing data literature; including a sketch of missing data theory and descriptions of normal model multiple imputation (MI) and maximum likelihood methods. They discussed, most notably the inclusion of auxiliary variables for improving power and reducing bias [6].
In 2010 Amanda N. Baraldi et al proposed “An introduction to modern missing data analyses”. They proposed a study over recent methodological and focused on two modern missing data analysis methods: maximum likelihood and multiple imputations. These approaches are advantageous to traditional techniques (e.g. deletion and mean imputation techniques) because they require less stringent assumptions and mitigate the pitfalls of traditional techniques. They explain the theoretical underpinnings of missing data analyses, give an overview of traditional missing data techniques, and provide accessible descriptions of maximum likelihood and multiple imputations [7].
In 2011 Tzung-Pei Hong et al. proposed “Mining rules from an incomplete dataset with a high missing rate”. They introduced an iterative missing value completion method based on the RAR (Robust Association Rules) support values to extract useful association rules for inferring missing values in an iterative way. It consists of three phases. The first phase uses the association rules to roughly complete the missing values. The second phase iteratively reduces the minimum support to gather more association rules to complete the rest of missing values. The third phase uses the association rules from the completed dataset to correct the missing values [].
In 2012 S. S. Dhenakaran et. al proposed “A Perspective Missing Values In Data mining Applications”. They calculated missing set values and estimate the imputation of missing values in data set. Methods are discussed for learning and application of decision rules for classification of data with many missing values [9].
In 2013 James D. Dziura et al proposed “Strategies for dealing with Missing data in clinical trials: From design to Analysis” They proposed a recommendations operationalize by providing specific guidance for each stage of the trial. In proposed the design stage, researchers should anticipate missing data patterns and causes and consider methods/designs that encourage participant retention. Developing detailed study documentation, training study personnel and testing operational aspects of the trial are important during the planning stage. Regular monitoring of missing data and enhanced participant contact is recommended for the conduct stage. While easy to implement, ad hoc methods such as complete case analysis and last observation carried forward are not advocated as primary analytic strategies [10].
In 2014 Adam Kapelner et al proposed “Prediction with Missing Data via Bayesian Additive Regression Trees”. They present a method for incorporating missing data into general forecasting problems which use non-parametric statistical learning. They focus on a tree-based method, Bayesian Additive Regression Trees (BART), enhanced with Missing value. Incorporated in Attributes, an approach recently proposed for incorporating missing value into decision trees. They extend the work to native partitioning mechanisms found in tree-based models and does not require imputation. Simulations on generated models and real data [11].
In 2015 Peter Schmitt et al proposed “A Comparison of Six Methods for Missing Data Imputation” . They presented a study and compare 6 different imputation methods: Mean, K-nearest neighbors (KNN), fuzzy K-means (FKM), singular value decomposition (SVD), Bayesian principal component analysis (BPCA) and multiple imputations by chained equations (MICE). Comparison was performed on four real datasets of various sizes (from 4 to 65 variables), under a missing completely at random (MCAR) assumption, and based on four evaluation criteria: Root mean squared error (RMSE), unsupervised classification error (UCE), supervised classification error (SCE) and execution time [12].
In 2015 Zhongheng Zhang, MMed. et al presented a simple imputation methods. Mean, median and mode imputations are simple, but they underestimate variance and ignore the relationship with other variables. Regression method can preserve their correlation with other variables but the variability of missing values is underestimated. Variability can be adjusted by adding random errors to the regression model. Indicator method is to replace missing values with zeros, which is not recommended for general use[13].
In 2016 Syed Saeed-Ur-Rahman et al “Treatment of Missing Values in Data Mining”. There are several techniques available to control the issue of missing values such as replacing the missing value with: (a) closest value, (b) mean value and (c) median value etc. Some algorithms are also used to deal with the problem of missing values such as k-nearest neighbour. They reviewed certain techniques and algorithms to deal with the puzzle of missing values whereby achieving pure data set (i.e., data set without missing value) which in-turn will lead to path of correct and accurate decision making[14].
In 2016 Rima Houari et al “Handling Missing Data Problems with Sampling Methods”. They proposed a new multiple imputation approach based on sampling techniques to handle missing values problems, in order to improving the quality and efficiency of data mining process. The proposed method is favorably compared with some imputation techniques and outperforms the existing approaches using an experimental benchmark on a large scale, waveform dataset taken from machine learning repository and different rate of missing values (till 95%)[15].
IJSTMR
©
2018 | All Rights Reserved 27 In 2016 Davi E. N. Frossard et al proposed “An approach to dealing with missing values in heterogeneous data using k-nearest neighbors”. Techniques such as clusterization, neural networks and decision making usually rely on algorithms that are not well suited to deal with missing values. However, real world data frequently contains such cases. The simplest solution is to either substitute them by a best guess value or completely disregard the missing values. Unfortunately, both approaches can lead to biased results. They proposed a technique for dealing with missing values in heterogeneous data using imputation based on the k-nearest neighbor’s algorithm. Proposed approach handles real (which we refer to as crisp henceforward), interval and fuzzy data. The effectiveness of the algorithm is tested on several datasets and the numerical results are promising [17].In 2017 Newsom et al proposed “Missing Data and Missing Data Estimation”. In the proposed study they discus about List wise Deletion, MAR and MCAR, Determining Whether Missing Values are MAR or MCAR, full information maximum likelihood (FIML), Other Missing Data Approaches and Other imputation methods [18].
In 2017 Elsayed Sallam et al “Handling Numerical Missing Values via Rough Sets”. They proposed a model based on rough set theory technique to deal with missing data. This model can handle the missing values for condition and decision attributes, the web application was developed to predict these values. The Proposed Model depends on the distance function to detect any missing attributes values. Distance function presents with different attribute values, the proposed model eliminates an attribute which has the smallest effect on the complete information system and repeats the calculation of the distance function again[19].
In 2017 Waseem Shahzad “Missing Data Imputation using Genetic Algorithm for Supervised Learning” . They proposed a technique to deal with missing values. Genetic algorithm (GA) is used for the estimation of missing values in datasets. GA is introduced to generate optimal sets of missing values and information gain (IG) is used as the fitness function to measure the performance of an individual solution. Proposed technique works even better when there is a higher rate of missing values or incomplete information along with a greater number of distinct values in attributes/features having missing values. They compare proposed technique with single imputation techniques and multiple imputations (MI) statistically based approaches on various benchmark classification techniques on different performance measures. They show that proposed methods outperform when compare with another state of the art missing data imputation techniques.
IV. PROPOSED APPROACH
Step 1: Find All Possible Frequent Item sets and Partitions
1. The Dataset Is Transferred to the Bitmap Representation The bitmap representation is illustrated as . For the containing value for particular transaction it takes the value ‘1’ or ‘true’ else ‘0’ or ‘false’.
2. Finds Global Frequent Item Set To find the global frequent item set the support count is calculated for the each item. Then if the support count value be greater than or equal to the predefined min_support count value then the item set is known as global frequent item set. If the item set is not the global frequent then those item sets are further processed for the localization.
3.Perform Localization The item sets which are not global are processed further for the localization. Localization is done using the three operations.
4. Recursively Join the Item sets in Depth-First Order from the Root.
V. EXPERIMENTAL ANALYSIS
We evaluate the performance of proposed approach with three previous approaches like replace a missing value with random value , replace a missing value with higher frequency value, replace a missing value with lower frequency value. We have taken different number of records like 500, 1000 and 1500 transactions. The experiments were performed on Intel Core i3-4200U processor 2GB main memory and RAM: 4GB Inbuilt HDD: 500GB OS: Windows 8. The algorithms are implemented in using C# Dot Framework Net language version 4.0.1. Synthetic datasets are used to evaluate the performance of the algorithms. We have taken SQL R2 (2008) server to store records. We have taken 10 items to test the proposed approach. User can choose item from the list of item and save in the transactional data base. We have taken real life data set from a computer shop. Minimum length of the transactions is 1 items and maximum length is 5 items. We have test proposed approach on 500, 1000 and 2000 records with different number of missing values
For comparing the performance of the proposed algorithms we also implement the random approach and min frequency and max frequency value. We take 500 records with 25 items and a different missing value .
Table1 500 transactions and recover missing values
Missing values Random
value
Max frequency
Proposed approach
12 3 5 9
18 4 8 13
IJSTMR
©
2018 | All Rights Reserved 28 Figure.2 Comparisons graph with 500 transactions and missing valueCONCLUSION
There are several algorithms and methods have been developed for handling missing values. But problem are always arises for finding a new algorithm and process for extracting knowledge for improving accuracy and efficiency. We proposed a new approach to recover missing value for categorical attributes. We compare proposed approach with two existing approaches to evaluate the performance of proposed approach. We have taken different number of records and different number of missing values to check the scalability of the proposed approach .Each and every method can yield totally different results when used on the same dataset, as each has its specific properties. Final conclusion is that the all methods are fine but to select a method for a given data set is depends the nature of the objects. In future enhancement we can also apply various other techniques for like neural network, fuzzy logic, genetic algorithms etc. to enhance the efficiency and accuracy.
REFERENCE
[1] Toon Calders “Mining Itemsets in the Presence of Missing Values” SAC’07, March 1115, 2007, Seoul, Korea. Copyright 2007 ACM
[2] David C. Howell “The Treatment of Missing Data” (Howell, D.C. (2008) The analysis of missing data. In Outhwaite, W. & Turner, S. Handbook of Social Science
Methodology. London: Sage.)
[3] John W. Graham” Missing Data Analysis: Making It Work in the Real World” First published online as a Review in Advance on July 24, 2008
[4] Amanda N. Baraldi “An introduction to modern missing data analyses” 0022-4405/$ - see front matter © 2009 Society for the Study of School Psychology.
Published by Elsevier Ltd. All rights reserved.
[5] Tzung-PeiHong Mining rules from an incomplete dataset with a high missing rate Journal Expert Systems An International Journal with Applications:
archiveVolume 38 Issue 4, April, 2011
[6] Dr. S. S. Dhenakaran” A Perspective Missing Values In Data mining Applications” International Journal of Engineering Trends and Technology- Volume3Issue3- 2012 zJames D. Dziuraa “Strategies for dealing with Missing data in clinical trials: From design to Analysis” YALE Journal of biology and medicine 86 (2013), pp.343-358. Copyright © 2013.
[7] James D. Dziura Strategies for dealing with missing data in clinical trials: from design to analysis jouirnal of bilogy and medicin 2013
[8] Adam Keener ”Prediction with Missing Data via Bayesian Additive Regression Trees” The Wharton School of the University of Pennsylvania February 14, 2014 [9] Peter Schmitt “A Comparison of Six Methods for Missing Data Imputation Peter Schmitt, Jonas Mandel and Mickael Guedj Department of Bioinformatics and
Biostatistics, Pharnext, Paris, France.
[10] Zhongheng Zhang “Missing data imputation: focusing on single imputation” Department of Critical Care Medicine, Jinhua Municipal Central Hospital, Jinhua
Hospital of Zhejiang University, Jinhua 321000, China Correspondence to: Zhongheng Zhang, MMed. 351#, Mingyue Road, Jinhua 321000, China. Email:
[11] Waqas I*, Syed Saeed-Ur-Rahman S, Imran MJ and Rehan A “ Treatment of Missing Values in Data Mining” Waqas et al., J Comput Sci Syst Biol 2016, 9:2DOI:
10.4172/jcsb.1000221
[12] Rima Houari Ahcène Bounceur Handling Missing Data Problems with Sampling Methods LIMED laboratory - University of Abderrahmane Mira Bejaia.
yLab-STICC Laboratory- University of Brest France.z Parallel Computational Research Group (PCRG) laboratory, University College Dublin Ireland
[13] Barnali Das “Missing Data and Imputation” NAACCR Webinar May 2016. Newsom, winter “Missing Data and Missing Data Estimation”. PSY 510/610 Structural
Equation Modeling Little (1988) has a test for MCAR, however, and Enders offers a macro to conduct the test.
[14] Davi E. N. Frossard “An approach to dealing with missing values in heterogeneous data usingk-nearest neighbors” Department of Computer Science, Federal
University of Espirito Santo. Av. Fernando Ferrari, 514, Vitoria, CEP 29075-910, Espirito Santo, ES, Brazil
[15] Newsom, winter “Missing Data and Missing Data Estimation”. PSY 510/610 Structural Equation Modeling Little (1988) has a test for MCAR, however, and Enders
offers a macro to conduct the test.
[16] Waseem Shahzad and Qamar Rehman “Missing Data Imputation using Genetic Algorithmfor Supervised Learning” (IJACSA) International Journal of Advanced