University of New Orleans University of New Orleans
ScholarWorks@UNO
ScholarWorks@UNO
University of New Orleans Theses and
Dissertations Dissertations and Theses
12-15-2007
Luminescent Quantum dots for Cellular Analysis
Luminescent Quantum dots for Cellular Analysis
Lifang Shi
University of New Orleans
Follow this and additional works at: https://scholarworks.uno.edu/td
Recommended Citation Recommended Citation
Shi, Lifang, "Luminescent Quantum dots for Cellular Analysis" (2007). University of New Orleans Theses and Dissertations. 597.
https://scholarworks.uno.edu/td/597
This Dissertation is protected by copyright and/or related rights. It has been brought to you by ScholarWorks@UNO with permission from the rights-holder(s). You are free to use this Dissertation in any way that is permitted by the copyright and related rights legislation that applies to your use. For other uses you need to obtain permission from the rights-holder(s) directly, unless additional rights are indicated by a Creative Commons license in the record and/ or on the work itself.
Luminescent Quantum dots for Cellular Analysis
A Dissertation
Submitted to the Graduate faculty of the
University of New Orleans
in partial fulfillment of the
requirements for the Degree of
Doctor of Philosophy
In
The Department of Chemistry
By
Lifang Shi
Bachelor of Science (1999), Xiamen University
Master of Science (2002), Xiamen University
ACKNOWLEDGMENTS
First I would like to express my gratitude to my research advisor, Professor Zeev
Rosenzweig, for his invaluable guidance, support, and encouragement throughout my
graduate research.
I am also very grateful to my advisory committee members Professor Matthew A.
Tarr, Professor Richard Cole, and Professor Guijun Wang for their advices and
suggestions during my research work.
I also sincerely thank Professor Nitsa Rosenzweig for her imperative role in guiding
me through hurdles presented by the complex biological systems that were the subject of
my studies.
I would like give a special thankthe support of Laurie Locascio and Michael Gaitan’s
research group of NIST and the NIST administration for enabling the completion of the
research project at NIST at the aftermath of Hurricane Katrina.
I would like to thank all past and present group members in Rosenzweig group for
your friendship and kindness. The time I spent with you will be remembered.
I would like to thank my close friends, Ming Zhang, Ying Long, Xiaobo Gu, Yan
Wu, Yun Cai, Jinghong Zheng, Yingli Xu, Meijun Li for their friendships which have
accompanied me through years
Last, but not the least, I would like to thank my beloved family for the love and
support all the time, father Wuhuan, mother Jinsuo, sisters Liyin, Licai, Likun and their
TABLE OF CONTENTS
LIST OF FIGURES……….…..v
LIST OF SCHEMES………...….ix
ABSTRACT………...x
CHAPTER 1 INTRODUCTION………..1
1.1 Objectives and aims………...1
1.2 Significance……….………...1
1.3 Fluorescence principle……….2
1.4 Quantum dots……….….…….7
1.5 References………...19
CHAPTER 2 EXPERIMENTAL...………...……….………24
2.1.Chemicals and supplies ……….….…...24
2.2. Characterization……….……….…...25
2.3. Cell cultures………...27
CHAPTER 3 QUANTUM DOTS FRET BASED PROTEASE SENSOR...29
3.1 Introduction………...29
3.2 Experimental………....33
3.3 Results and discussion…...37
3.4 Conclusions………...60
3.5 References...63
CHAPTER 4 QUANTUM DOTS FRET BASED PH SENSOR……….…………....64
4.1 Introduction……….………64
4.2 Experimental………...66
4.3 Results and discussion…...69
4.4 Conclusions………...……….……….79
4.5 Reference………...……….………80
CHAPTER 5 REVERSIBLE QUANTUM DOTS IRON SENSOR ……...81
5.1 Introduction………...81
5.2 Experimental……….……..85
5.3 Results and discussion……….…...88
5.4 Conclusions...……….……….…..103
5.5 References……….……105
CHAPTER 6 SUMMARY AND DISCUSSION...…...107
LIST OF FIGURES
Figure 1.1 Jablonski diagram………..4
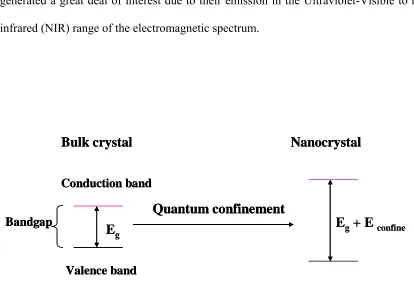
Figure 1.2 blue shift in the band gap energy in nanometer crystal compared to the bulk
crystal……….………..8
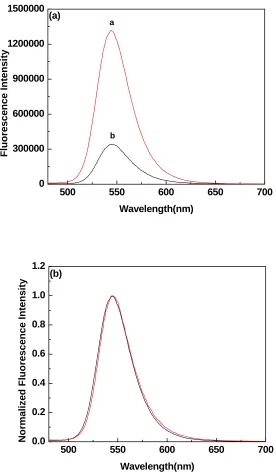
Figure 3.1 a) Emission spectra and b) normalized emission spectra of TOPO coated
quantum dots (red) and peptide-coated quantum dots (black) (λex = 445 nm)..………...39
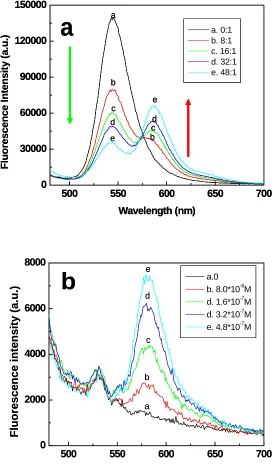
Figure 3.2 a) Emission spectra of rhodamine-labeled peptide-coated quantum dots at
increasing the rhodamine to peptide coated quantum dots ratio: (a)0:1 (black),(b) 8:1 (red), (c)16:1 (green), (d)32:1 (dark blue), e)50:1 (light blue). b) Control experiments-the fluorescence spectra of a rhodamine solution of the same concentration used in a. (λex = 445 nm)………..………..…………..41
Figure 3.3 The emission intensity of peptide coated quantum dots decay percentage
(Fd/Fd0) versus the ratio of rhodamine and quantum dots. Fd0 is the emission intensity of
quantum dots without labeling rhodamine and Fd is the emission intensity of quantum
dots in rhodamine-labled-quantum dots conjugate.……….………….….42
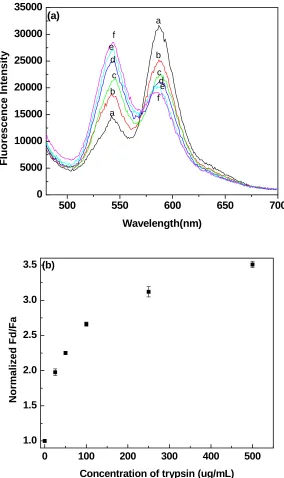
Figure 3.4 a) Emission spectra of the quantum dot FRET-based probes at increasing
trypsin concentration: (a) 0μg/mL, (b) 25μg/mL, (c) 50μg/mL, (d) 100μg/mL, (e) 250μg/mL, (f) 500μg/mL. (λex = 445 nm). b) Trypsin concentration dependence of Fd/Fa , 15 minutes following the addition of trypsin to solutions of quantum dot based probes. Fd/Fa values were normalized to (Fd/Fa) 0, which is the ratio Fd/Fa prior to
adding trypsin to the quantum dot probes solutions.……….45
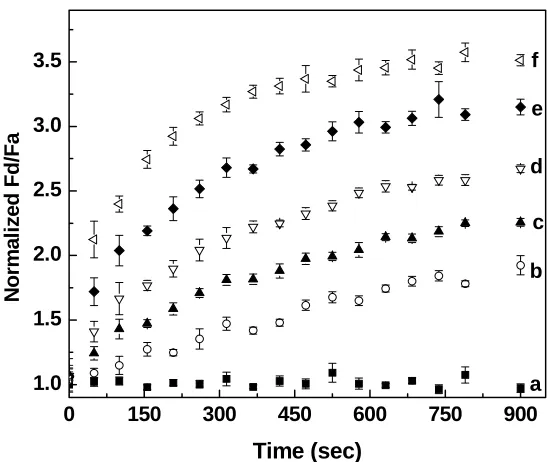
Figure 3.5 Temporal dependence of the rhodamine-labeled peptide-coated quantum dots
at increasing trypsin concentration: (a) 0μg/mL, (b) 25μg/mL, (c) 50μg/mL, (d) 100μg/mL, (e) 250μg/mL, (f) 500μg/mL. The ratio Fd/Fa was normalized to (Fd/Fa)0,
which is the ratio Fd/Fa prior to adding trypsin to the quantum dot probes
solutions.………..………..47
Figure 3.6 (a) Emission spectra and (b) Temporal dependence of the rodamine-labeled
peptide-coated quantum dots with different enzyme: a) buffer (black), b) 50ug/mL trypsin(red), c) 50ug/mL urease(green)……….………48
Figure 3.7 Digital fluorescence images of (a) peptide coated quantum dots showing green
Figure 3.8 Structure of 4-(2-Aminoethyl) benzene-sulfonyl fluoride hydrochloride (1),
4-Amidinophenylmethane-sulfonyl fluoride hydrochloride (2) and 1,10 phenantroline (3)
used for inhibition assay………...……….51
Figure 3.9 - Temporal dependence of Fd/Fa in the presence of 250 μg/mL trypsin and
increasing concentrations of the trypsin inhibitor 4- (2-Aminoethyl) benzene-sulfonyl fluoride hydrochloride. a) a control experiment in the absence of trypsin and trypsin inhibitor, b) 2.50 mg/mL, c) 1.25 mg/mL, d) 250µg/mL, e) 50µg/mL, f) 0µg/mL….…..52
Figure 3.10 Real time monitoring of the inhibition efficiency of 250μg/mL trypsin
inhibitor in the presence of 250μg/mL trypsin. a) A control experiment in the absence of trypsin and trypsin inhibitor (■), b)1,10 phenantroline (○), c) 4-(2-Aminoethyl)benzene-sulfonyl fluoride hydrochloride (▲), d) 4-Amidinophenylmethane-sulfonyl fluoride
hydrochloride (◊) and e) in the absence of trypsin inhibitor
(▼)……….………...……….53
Figure 3.11 Inhibition ability of trypsin inhibitors. a) 1,10 phenanthroline, b)
4-(2-Aminoethyl) benzene-sulfonyl fluoride hydrochloride and c) 4-Amidinophenylmethane-sulfonyl fluoride hydrochloride……….55
Figure 3.12 (a) Emission spectra of rhodamine labeled peptide-coated quantum dots 15
minutes following the addition of collagenase of increasing concentration. (b) Time dependence of the ratio Fd/Fa of the rhodamine-labeled peptide-coated quantum dots at increasing collagenase concentration. The ratio Fd/Fa was normalized to (Fd/Fa)0, which is
the ratio Fd/Fa prior to adding collagenase to the quantum dot probes solutions. a) 0μg/mL
(black), b) 0.5μg/mL (red), c) 2.5μg/mL (green), d) 5.0μg/mL (blue)………..57
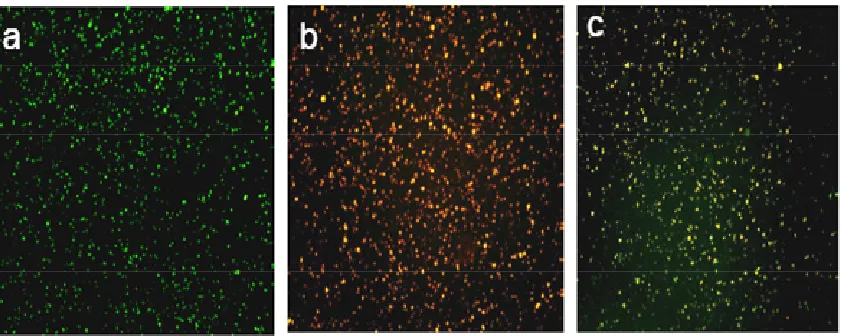
Figure 3.13 Digital fluorescence microscopy images of rhodamine labeled
peptide-coated quantum dots in cell culture. (a) Incubated in HTB 126 cell line for 0 minute, (b) incubated in HTB 126 cell line for 15 minutes; (c) incubated in HTB 125 cell lines for 0 minutes, (d) incubated in HTB 125 cell lines for 15minutes……….59
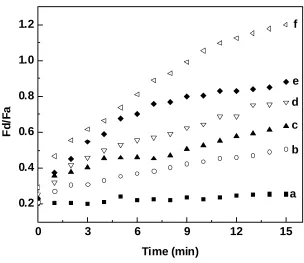
Figure 3.14 Temporal dependence of FRET signal (F /F ) of quantum dot FRET-based
protease sensors in the absence of cells (a) and when attached to the extracellular matrix of normal breast cells (b) and cancerous breast cells (c)………..…….60
d a
Figure 4.1 Effect of pH on the emission images of MT coated quantum dots…...70
Figure 4.2 a) Emission spectra of rhodamine-labeled MT-coated quantum dots at
increasing the rhodamine to peptide coated quantum dots ratio: (a)0:1 (black),(b) 2:1 (red), (c)5:1 (green), (d)10:1 (dark blue), e)20:1 (light blue), f) 40:1 (pink); b) The emission intensity of MT coated quantum dots decay percentage versus the ratio of rhodamine and quantum dots in MOPS buffer at pH 6.5; Fd0 is the emission intensity of
quantum dots without labeling rhodamine and Fd is the emission intensity of quantum
Figure 4.3 Digital fluorescence images of quantum dots-MT-Rhodamine at the different
ratio of rhodamine/quantum dots………..……….……72
Figure 4.4 The emission spectra and fluorescence images of a) MT coated quantum dots,
b) rhodamine and c) rhodamine labeled MT coated quantum dots in MOPS buffer at pH 6.5 with the ratio 20:1 of rhodamine:quantum dots……….……..73
Figure 4.5 pH effect on conjugatioin between MT coated quantum dots and rhodamine.
a) Images and fluorescence emission spectra of MT coated quantum dots and rhodamine at different pH values; b) Plot of intensity the ratio of MT coated quantum dots (Fd) and
rhodamine (Fa) as a function of pH………75
Figure 4.6 pH effect on rhodamine labeled MT coated quantum dots. a) Plot of the
intensity ratio Fd/Fa of MT coated quantum dots (Fd) and rhodamine (Fa) as a function of
pH over time; b) Images of rhodamine labeled MT coated quantum dots at different pH over time………..………..78
Figure 5.1 Effect of capped ligands on the fluorescence intensity of quantum dots…....89
Figure 5.2 Characterization of the response time of the quantum dots iron sensor- the
fluorescence intensity of the EDTA coated quantum dots prior and following the injection of an aliquot of concentrated Fe2+ solution (ferrous ammonium sulfate) is shown...……90
Figure 5.3 Effect of Fe2+ ion concentration on the emission of EDTA capped quantum
dots. a) Fluorescence emission spectra; b) A stern-Volmer plot effectively describes the iron concentration dependence of the luminescence intensity of EDTA capped quantum
dots with a Stern-Volmer constant Ksv=6710 M-1………92
Figure 5.4 Effect of Fe3+ ion concentration on the emission of EDTA capped quantum
dots……….93
Figure 5.5 Digital fluorescence images of EDTA capped quantum dots with increasing
concentration of iron, the images were taken through 40X objectives with numerical apertures of 0.9………...………94
Figure 5.6 Normalized Fluorescence spectra of a) EDTA capped quantum dots and b)
MT capped quantum dots with 200μM iron solution………96
Figure 5.7 The emission of EDTA coated quantum dots with 200mM fluoride ion ([iron]
=200μM)………...……….97
Figure 5.8 Effect of 200uM biologically relevant ions on the fluorescence emission of
EDTA capped quantum dots………..99
Figure 5.9 Reversibility of quantum dots based probes. Temporal dependence of EDTA
quantum dots is quenched by Fe2+, and reversed by adding the chelator EDTA and HPO……….101
Figure 5.10 Temporal dependence of EDTA coated quantum dots in the presence of Cu2+
and tested chelator. Fluorescence of EDTA coated quantum dots is quenched by Cu2+, and not reversed by adding the chelator EDTA and HPO………..………102
LIST OF SCHEMES
Scheme 3.1 Schematic representation of quantum dots FRET based protease sensor…..33
Scheme 4.1 The synthesis of MT coated quantum dots ………..……….68
Scheme 4.2 A schematic representation of the mechanism of signal response to the
change of pH……….….76
Scheme 5.1 Schematic representation of reversible quantum dots based iron sensor…...84
ABSTRACT
Luminescent quantum dots have attracted great interest in recent years among
biological researchers since they provide solutions to problems associated with use of
organic fluorophores in cellular studies. Quantum dots show high photostability, high
emission quantum yield, narrow and symmetric emission peaks and size-dependent
wavelength tunability. The objective of my PhD studies was to develop CdSe/ZnS
quantum dot-based probes and utilize them in cellular assays.
The first phase of the work was to develop luminescent quantum dot fluorescence
resonance energy transfer (FRET) based probes for protease activity. The probes were
based on FRET interactions between quantum dots that serve as donors and rhodamine
molecular acceptors that were immobilized to the surface of the quantum dots through
peptide linkers, which contained selective enzymatic cleavage sites. Upon enzymatic
cleavage of the peptide linkers, the rhodamine molecules no longer provided an efficient
energy transfer channel to the quantum dots, which brightened the previously quenched
quantum dots. The probes were applied to detect enzyme activity, screen enzyme
inhibitors, and discriminate between normal and cancerous cells primarily because of the
difference in the proteolytic activity in extracellular matrices.
The second phase of my work was to take advantage of FRET and quantum dots to
develop pH sensor. First quantum dots were modified with metallothionein (MT) to be
water-soluble and biocompatible. The MT-coated quantum dots were labeled with
Rhodamine through the formation of amide bonds with ε-amine group of lysine in MT
peptide to form the probes. FRET efficiency between quantum dots (donor) and
The final phase of my studies focused on the first preparation of reversible quantum
dot-based cellular probes for labile iron. The MT coated quantum dots was modified with
EDTA to form probes. When captured by the EDTA molecules, iron ions quenched the
emission of quantum dots. Removal of iron from the quantum dot surface by free EDTA
or other iron chelators with higher binding affinity resulted in a rise in the luminescence
of quantum dots. The analytical properties of the probes including sensitivity, selectivity,
and reversibility were characterized. Intracellular assays in iron-enriched astrocytes will
be carried out.
CHAPTER 1 INTRODUCTION
1.1 Objectives and aims
The main objective of my work was to develop luminescent quantum dots based
bioanalytical probes for cellular analysis, which enable simultaneous analysis of a large
number of cells and optical response to cellular signaling events in real time. Because of
the discrete electronic state of each particle, the photophysical properties of quantum dots
are sensitive to the presence and characteristics of ligands or molecules on their surface.
The newly developed quantum dots respond to changes in the cellular environment by
changing their luminescence intensity. The specific aims of my study were: i) to develop
quantum dots FRET based protease sensor for real time monitoring of Matrix
Metalloproteinases (MMPs) in cell cultures, ii) to develop quantum dots FRET based pH
sensor, and iii) to develop reversible quantum dots based sensors for labile iron in iron
rich cells.
1.2 Significance
The detection of biomolecules at the molecular level using state-of-the-art imaging
techniques has been one of the most important tasks in life sciences (1), especially the
development of high sensitivity and high specificity sensors for cancer research,
including basic tumor biology, in vivo imaging and early detection. Fluorescence methods
are the most common method of detecting biomolecules in cells. Many of the organic dye
and protein-based fluorophores suffer from serious chemical and photophysical
chemical stability. They are also limited in long term imaging and multicolor detection.
Further progress in the field has been realized through the development of agents that
have small size and high photostability. Luminescent quantum dots have attracted the
attention of biological researchers due to the unique electronic and optical properties.
Since water-soluble and biocompatible quantum dots were first reported in 1998(2, 3),
luminescent quantum dots have been a new promising approach to fluorescent chemical
sensing and cancer detection (4). An important goal in quantum dots research is to
develop nanoscale assemblies to continuously monitor targets in cell. My PhD project
focused on the development of quantum dots based probes for cellular analysis.
1.3 Fluorescence principle (5-6)
Luminescence is the emission of light from any substance and occurs from
electronically excited states. Based on the nature of the excited state, luminescence is
divided into fluorescence, phosphorescence and chemiluminescence. Fluorescence and
phosphorescence are similar because the excitation is formed by absorption of photos.
Fluorescence occurs when a molecule in an excited singlet state returns to the electronic
ground state by emission of a photon. Phosphorescence is the emission of light from the
triple state to the ground state. Fluorescence and phosphorescence are different because
fluorescence does not involve the change in electron spin. Chemiluminescence occurs
when the excitation is bought by a chemical reaction and excited species returns to the
1.3.1 Jablonski diagram
The process on light absorption and emission are usually illustrated by Jablonski
diagrams (figure 1.1). S0, S1 and S2 represent the singlet ground state, first and second
excited states respectively. T1 is the first triplet state. Usually the energy of the first
excited triplet state is lower than the energy of the corresponding singlet states.
Numerous vibration energy levels exist in each of these electronic energy levels. The
light absorbed by a molecule excites an electron from the singlet ground state, S0, to
excited states S1 or S2 according to the magnitude of the absorbed energy. This transitions
process happens in 10-14 ~ 10-15 s. The routes for the excited molecules return to its
ground state can be divided into two categories: radiative and nonradiative deactivation
process.
Fluorescence and phosphorescence are two different radiative transitions. If the
photon emission occurs from singlet excited states to ground state (S1 to S0), it is termed
fluorescence. These emission rates of fluorescence are typically108 s-1. If the photo
emission occurs from triplet excited states to ground state (T1 to S0), it is termed
phosphorescence. Transitions from triplet excited state to the ground state are forbidden
and the emission rates are slow (103-100 s-1), so phosphorescence lifetimes are typically
milliseconds to seconds. Phosphorescence is usually not seen in fluid solutions at room
temperature.
There are four significant nonradiative deactivation processes: vibrational relaxation
(VR), internal conversion (IC), intersystem crossing (IsC) and external conversion (EC).
The transition from higher vibrational energy level to lower vibrational energy level is
energy states of the same spin state (e.g. S2 to S1). This process takes place 10-12 s or less.
Intersystem crossing is a radiationless transition between different spin states (e.g. S1 to
T1). The deactivation of an excited electronic state involves interaction and energy
transfer between the excited molecule and the solvent or other solutes is called external
conversion.
ABS
ABS - Absorbanc S0- ground state V.R.- Vibrational relaxation FL – Fluorescence S1– Singlet first excited state IsC - Intersystem Crossing PH - Phosphorescence S2- Singlet second excited state I.C - Internal Conversion
T1- Triplet excited State E.C -Exteral conversion
FL PH
IsC
S
1T
1S
0EC
EC VR
S
2IC
1.3.2 Characteristics of fluorescence emission
Florescence always occurs from the lowest vibrational level of the first singlet excited
electronic state. Therefore, fluorescence emission spectra are generally independent of
the absorption wavelength. Fluorescence emission spectra vary widely and are dependent
upon the chemical structure of the fluorophore, pH, temperature and the solvent in which
it is dissolved. Since the same transitions are involved in both absorption and emission,
and due to the similarities of the vibrational levels of S0 and S1, the emission is the mirror
image of absorption. The energy of emission is usually less than that of absorption. Thus,
fluorescence occurs at longer wavelength. The energy difference is called the Stokes’
Shift. The Stokes’s Shifts can be caused by energy losses due to relaxation to ground
vibrational states, solvent effects, excited state reactions, complex formation, and energy
transfer. The fluorescence lifetime and quantum yield are important characteristics of a
fluorophore. The quantum yield is defined as the number of emitted photons relative to
the number of absorbed photons. The lifetime of the excited state is defined by the
average time the molecule spends in the excited state prior to return to the ground state. A
typical fluorescence lifetime is near 10 ns.
1.3.2 Fluorescence resonance energy transfer (FRET)
Fluorescence resonance energy transfer (FRET), a non-radiative energy transfer from
the excited state of a donor (D) to an acceptor (A), is the result of long-range
dipole-dipole interactions between the donor and acceptor (5, 7). As a result, the fluorescence
intensity and lifetime of the donor is decreased and shortened, while the acceptor
the following conditions: (i) spectral (or energy) overlap between the absorption spectrum
of the acceptor and the fluorescence emission spectrum of the donor; (ii) the donor and
acceptor molecules must be in close proximity (typically 10-100 Å). (iii) Donor and
acceptor transition dipole orientations must be approximately parallel. The rate of energy
transfer depends on the extent of spectral overlap between the emission spectrum of the
donor and the absorption spectrum of the acceptor, the relative orientation of
donor/acceptor transition dipoles and the distance between the donor and acceptor. The
rate of energy transfer is given by the equation (1).
6 0 1 ⎟ ⎠ ⎞ ⎜ ⎝ ⎛ = − R R
kt τD [1]
τDis the measured lifetime of the donor in the absence of the acceptor. R0 is termed the
critical radius of the transfer or the Forster distance, which is the distance at which the
energy transfer efficiency is 50%. The Forster distance, R0, depends on the spectral
characteristics of the donor-acceptor pair and is expressed in equation (2).
3 / 1 2 / 1 0 4 3000 ⎟ ⎟ ⎠ ⎞ ⎜ ⎜ ⎝ ⎛ = A N R
π [2]
N is Avogadro number and A1/2is the concentration of the acceptor at which the energy
transfer efficiency E is 50%. For a donor and acceptor pair that is covalently bound, the
energy transfer efficiency, E, is expressed as:
6 6 0 6 0 R R R E +
The FRET efficiency can be experimentally measured by monitoring changes in the
donor or/and acceptor fluorescence intensities, or changes in the fluorescent lifetimes of
fluorophores.
FRET, incorporated with optical microscopy, is a powerful photophysical technique
because of its high sensitivity to changes in distance and relative dipole orientations
between donor and acceptor. FRET has been widely used in probing biological
phenomena, including studying protein-protein interactions (binding affinity), diffusion
dynamics, protein conformational changes, and detecting nucleic acid and peptides
(8-12).
1.4 Quantum dots
1.4.1 Structural properties of quantum dots
Quantum dots are semiconductor nanoparticles of 1-10nm in diameter. Luminescent
nanocrystals are composed of atoms from groups II–VI (CdS, CdSe, CdTe, ZnO, ZnSe),
III–V (InP, InAs, GaN, GaP, GaAs), and IV-VI (PbS, PbSe, PbTe) of the periodic table.
Quantum dots are neither atomic nor bulk semiconductors. They are spherical, crystalline
particles of a given material consisting of hundreds to thousands of atoms. Quantum dots
are smaller than the electron-hole pairs (exciton) Bohr radius. When the size of a
semiconductor is small enough to approach the size of the materials exciton Bohr radius,
the electron energy levels can no longer be treated as a continuum. They must be treated
as discrete. This situation of discrete energy levels is called quantum confinement.
Quantum confinement leads to increased stress on the exciton, which results in increased
separation, and more energy is required to form the exciton. The behavior of the excited
electron can be described by a simple “particle-in-a-box” model (13). The Quantum
confinement causes a blue shift in the band gap energy (figure 1.2) and increases the
probability of overlap between the electron and hole which increases the rate of radiative
recombination. This results in quantum dots with unique optical and electric properties
(14-18). As the size of quantum decreases, the absorption onset shifts to higher energy,
indicating an increase in bandgap energy. CdX (X= S, Se, Te) quantum dots have
generated a great deal of interest due to their emission in the Ultraviolet-Visible to near
infrared (NIR) range of the electromagnetic spectrum.
Valence band Conduction band
Bandgap
Quantum confinement
Bulk crystal Nanocrystal
E
gE
g+ E
confineValence band Conduction band
Bandgap
Quantum confinement
Bulk crystal Nanocrystal
Valence band Conduction band
Bandgap
Quantum confinement
Valence band Conduction band
Bandgap
Quantum confinement
Bulk crystal Nanocrystal
E
gE
g+ E
confineFigure 1.2 blue shift in the band gap energy in nanometer crystal compared to the bulk
1.4.2 Optical properties of quantum dots
In semiconductors, the electron in the valence band can be excited by photon
absorption and promoted to the conduction band, creating a “hole” in the valence band.
The excited electron will relax back to fill in the hole and emit light. This is conceptually
the same as conventional fluorescence. However, quantum dots have several optical
characteristics which distinguish them from conventional organic fluorophores because of
the strong confinement of excitons in quantum dots in such small size (quantum
confinement effect). (i) Size-tunable luminescence (2, 19); the wavelength of emitted
light is determined by the band gap energy between valence and conduction band of
quantum dots. As the size of the quantum dots decreases, the energy gap increases. Since
the band gap energy of the quantum dots is size dependent, the emission color of the
quantum dots is also size dependent. The emission peak changes from ultraviolet to
infrared by varying the size and composition of quantum dots (20, 21). (ii) Organic
fluorophores have narrow absorption. They can only be excited by a narrow range of
wavelengths. On the other hand, the absorption of quantum dots has an increased
probability at higher energies, which leads to broad absorption spectrum and enable
quantum dots to be excited by a wide range of wavelengths. Quantum dots with different
sizes can be excited with a single wavelength. This enables multiplexing or simultaneous
detection of multiple signals of quantum dots (16). Additionally, the molar extinction
coefficients of quantum dots are larger than that of organic dyes (22, 23) (iii) Quantum
dots have symmetric and narrow emission spectra without a red tail. This reduces
cross-talk between emission signals (24). (iv) The long fluorescence lifetime of quantum dots
shorter lifetime species, like autofluorescence encountered in cells. This increases the
analytical sensitivity of quantum dots (25, 26). (v) A major advantage of quantum dots is
their high photostability and chemical stability compared to organic dyes, which enables
their use in imaging applications that require long exposure times (27-33).
1.4.3 Synthesis of quantum dots
The size and shape of quantum dots are controlled by altering the duration,
temperature, and ligand molecules used in their synthesis. To date, quantum dots, such as
CdSe, CdS, CdTe, have been synthesized in various media including aqueous solution
(34, 35), reverse micelles (36), polymer films (37,38), sol-gel systems (39) and
trioctylphosphine oxide (TOPO) / trioctylphosphine (TOP) (19, 40-42). High quality
quantum dots have been achieved by pyrolysis of organometallic precursors in
TOP/TOPO media, which was first reported by Murray in 1993 (19). The synthesis is
carried out by injecting dimethylcadmium (Cd(CH3)2) and sulfur, selenium, or tellurium
dissolved in TOP solution to hot TOPO media. However, dimethylcadmium is very toxic,
pyrophoric, unstable and expensive. The synthesis procedure was later refined by Peng
and coworkers who replaced the toxic cadmium precursor Cd(CH3)2 with CdO, Cd(Ac)2
and CdCO3 and lead to green synthesis (40-42). The method developed by Peng is used
extensively for the synthesis of luminescent quantum dots with some quantum dot
products already available commercially (Evident Technologies (NY), Quantum Dots
Corporation (CA)).
Confining the electrons to the bulk of luminescent quantum dots is imperative to their
as vacancies, local lattice mismatches, dangling bonds, or adsorbates at the surfaces, and
lead to the nonradiative recombination, which will result in the low quantum yield (13).
Additionally, the uncapped quantum dots are so reactive that they readily undergo
photochemical degradation. To decrease the effect of surface defects and to protect
surface atoms from oxidation and other chemical reactions, an additional thin layer made
of a higher band gap semiconductor material, for example ZnS, is grown on the surface of
the quantum dots(43-47). This process, often described in the literature as surface
passivation, increases the emission quantum yield, improves chemical stability and
photostablility, and reduces the toxicity by preventing leakage of Cd or Se to the
surrounding environment. Due to the availability of precursors and the simplicity of
crystallization, CdSe/ZnS core/shell quantum dots have been the most well-studied and
popular for biological applications.
1.4.4 Surface modification of quantum dots
When high quality quantum dots are synthesized in organic solvents, they are
insoluble in water, non-biocompatible and don’t have functional groups for
bioconjugation. To facilitate their application in aqueous biological systems, the
hydrophobic TOPO molecules that serve as capping ligands of luminescent quantum dots
must be replaced with bifunctional hydrophilic capping ligands or overcoated with
amphiphilic protective layer to impart water-solubility and potential bioconjugation sites.
To address this, various methods on the improvement of quantum dots biocompatibility
and stability have been developed during the past few years. These solublization
(i) Ligand exchange is a process involving the replacement of hydrophobic ligands
with bifunctional ligands in which one end that has anchoring groups can bind to the
inorganic QD surface and an opposing end imparts water solubility via hydrophilic
groups. Various ligand exchange methods were developed in recent years to form water
soluble quantum dots. Thiols (-SH) are often used as anchoring groups on the ZnS
surface. The TOPO ligands are often exchanged with thiol functionalized compounds like
mercaptoacetic acid (MAA) (3), dihydrolipoic acid (DHLA) (48), dithiothreitol
(DTT)(49), and dendrons (50). In our laboratory, we found that the amino acid cysteine
is also an effective capping ligand to create hydrophilic quantum dots (51). Weiss and
coworkers reported that cysteine containing peptides could also be used as effective
capping ligands to facilitate the water miscibility of quantum dots (52). Since the bond
between thiol and ZnS is not very strong, quantum dots will tend to aggregate over time,
the solubility of quantum dots capped with thiol chemistry is limited (53). Also the ligand
exchange processes usually disturbs the chemical and physical state of the surface atoms
of quantum dot and reduce quantum efficiency (54).
(ii) Silica encapsulation involves growth of a silica layer on the surface of quantum
dots. Also, functional organosilicone molecules are incorporated into the shell and
provide surface functionalities for bioconjugation (2, 55-58). The silica coated quantum
dots are extremely stable because the silica layer is highly cross-linked. However, the
method is very laborious and the silica layer may be hydrolyzed (59).
(iii) Another approach is to coat quantum dots with amphiphilic polymer and
phospholipids, which interleave with the hydrophobic TOPO ligands through
(33, 60-62). This process maintains the native ligands (TOPO) on the surface of quantum
dots to retain the high quantum yield of quantum dots and protect the quantum dots
surface from deterioration in biological solution. However, the final size of quantum dots
is larger, which could limit many biological applications (59).
Although several methods for solubilization of quantum dots in aqueous solution have
been devised, each has its own benefits and liability. Progress on the synthesis of high
quality water-soluble quantum dots is still playing a crucial role in the area of quantum
dots based nanobiotechnology.
1.4.5 Biological Application of quantum dots
Because of unique properties, quantum dots have been promising tools in biological
applications as an alternative to common organic fluorophores and have been a new
generation of fluorescent probes. Water soluble quantum dots are widely used in protein
assays (63-67), DNA and RNA hybridization assays (68-72), and fluorescence resonance
energy transfer (FRET) (73-77). They are also used as labels in in vitro imaging of cells
and tissues (78-82) and in in vivo imaging applications in whole animals (83-87).
1.4.5.1 Quantum dots as FRET donors
Fluorescent conventional organic molecules have been widely used as FRET donors
and acceptors because of small size, compatibility with covalent coupling, and relatively
large detectable optical signal. However, organic dyes have some problems as FRET
agents: (i) The narrow absorption spectrum leads to direct excitation of the acceptor; (ii)
spectrum of the acceptor and results in spectral cross-talk; (iii) Low photobleaching
thresholds prevent monitoring dynamics over long period. Quantum dots provide a
potential solution to the above problems.
Quantum dots have been investigated as FRET donors as alternatives to traditional
organic dyes because of their high photostability and their unique spectral properties (60,
88-90). (i) A broad absorption spectrum enables choosing an excitation wavelength that
does not excite the acceptor molecules directly. This prevents “bleeding” of energy into
the acceptor channel, which often increases the fluorescence intensity of the acceptor and
therefore leads to over-estimation of the FRET efficiency between the donor and acceptor
fluorophores. (ii) A narrow and symmetric emission spectrum makes it easier to
distinguish the emission of the quantum dots from that of the acceptor and reduces the
donor spectra leakage into the acceptor channel. (iii) The size-tunable spectrum enables
control of the spectrum overlap between quantum dots and acceptor by controlling the
size of quantum dots. (iv) Multiple acceptor sites can enhance FRET efficiency.
In 1996, Kagan and his coworker first reported energy transfer between quantum dots
(91, 92). After a couple years of silence, in 2001, several research groups reported FRET
between quantum dots and organic dyes (93-95). For example, Willard and his coworker
developed quantum dots as a FRET donor in a protein-protein binding assay (93).
Quantum dots were conjugated to BAS as FRET donors and tetramethylrhodamine was
bound to the protein as the FRET acceptor. Medinta and coworkers first reported
quantum dots based self-assembled nanoscale FRET biosensors for maltose in 2003 by
coating CdSe/ZnS quantum dots capped with DHLA with maltose binding protein (MBP)
acceptor molecules. Maltose molecules displaced the fluorescent acceptor molecules,
which resulted in a maltose concentration dependent increase in the emission of the MBP
coated quantum dots. Since that, quantum dots based FRET biosensor have been
interesting fields for researchers. So far, the quantum dots based FRET biosensors have
been reported to detect TNT (97), toxins (98), β-lactamase (99), collagenase(100),
DNA(101), RNA (102) and protein(103), etc.. In these probes, the quantum dots are used
as donors while the organic fluorophores serve as fluorescent acceptors. The FRET
mechanism allows the quantum dots to respond to environmental changes while avoiding
direct chemical interaction with the quantum dots that could negatively affect their
photo-physical properties and decrease their brightness.
Although quantum dots based FRET measurements have great potential as
biosensors, there are also a number of limitations with quantum dots for FRET. It must be
noted that the Forester theory commonly used to describe energy transfer between
molecular donor and acceptor molecules was never tested in heterogeneous systems
consisting of a luminescent nanoparticle as a donor and fluorescent molecules as
acceptors. The heterogeneity in quantum dots size can affect the precision of
single-molecule FRET measurements. From a theoretical standpoint, this process is yet to be
studied. The FRET efficiency between the luminescent nanoparticles and a fluorescent
acceptor molecule is not as high as in molecular FRET due to the larger size of quantum
dots. The presence of multiple acceptor molecules on the surface of the luminescent
quantum dots leads to a substantial accumulative effect, which is easily observed using
conventional spectroscopy and microscopy instrumentation. Quantum dots are not
1.4.5.2 Quantum dots in cellular studies
As previously mentioned, the objective of my PhD project is to develop quantum dot
based sensors for cellular measurements. Due to their unique spectroscopic properties,
luminescent quantum dots have been used in cellular studies. The broad excitation of
quantum dots enables simultaneous detection of different quantum dots-tagged cells with
a single excitation light source. The size dependent tunability of quantum dots facilitates
their use in an emission spectral range which minimizes the effect of cellular
auto-fluorescence. Most importantly, quantum dots are highly resistant to chemical and
enzymatic degradation in living cells and photobleaching, which allows for real time
monitoring of cellular dynamic events, such as cell migration, differentiation, and
metastasis (104). Since the first report of quantum dots that were used to stain F-actin in
fixed cells (2), quantum dots have been extensively used in the cell-based studies,
including cellular labeling, cellular tracking, and cellular imaging.
Cellular membrane protein and receptors, such as prostate specific membrane antigen
(PSMA) (60), mortalin (105), band 3 protein (106), Epidermal Growth Factor(EGF)
(107), Glycine receptors (GlyRs) (108), serotonin (109), and membrane
glycoprotein(110) can be labeled with quantum dots. For example, Wu and his coworker
used quantum dots coated with an amphiphilic polymer linked to immunoglobulin G and
streptavidin to localize the breast cancer marker Her2, cytoskeleton fibers, and nuclear
antigens in fixed and live cancer cells (28). They compared the brightness and
photostability of quantum dots labels to organic dyes. One of the challenges for using
Quantum dots can be delivered into live cells by microinjection (33), electroporation
(111), peptide mediated transport (112-115), receptor mediated transport (3), and
nonspecific endocytosis (31, 32, 116). For example, Jaiswal and colleagues used quantum
dots for the long term multiple color imaging of live cells (31). Quantum dots can be
internalized by cells via nonspecific endocytosis and accumulated in vesicles in the
perinuclear region. With endosome-specific marker Pgp-EGFP, quantum dots can
undergo uptake to endosomes. The mechanism and pathway of incorporating quantum
dots into cells via endocytosis is still not very clear. However, the high photostability of
quantum dots enables long-term cell studies (i.e., up to two weeks), which can’t be
achieved with organic dyes (59).
Quantum dots have shown great potential as in vivo tumor imaging and targeting
probes. Akerman first reported peptide-coated quantum dots used to target tumor
vasculatures in mice (83). Gao and his coworker described encapsulating luminescent
quantum dots in ABC tri-block copolymers for cancer cell targeting and imaging in live
animals (60). The ABC tri-block copolymer addresses problem of aggregation and
fluorescence loss that occurred when quantum dots were in physiological buffer or inside
the live animal. Ballow and coworkers examined the in vivo behavior of injected
PEG-coated quantum dots into the mouse blood stream (117). Cai and coworkers used RGD
peptide conjugated quantum dots to target giloblastoma tumor vasculate in mice. The
RGD peptide showed specific affinity for the angiogenic factor integrin αvß3, which is
upregulated in growing tumors (87). Although there are some successful reports on
quantum dots as tumor targeting and imaging probes on mouse model, more research
The required advances include synthesis of high quality non-Cd based quantum dots,
synthesis of high-efficiency NIR emitting quantum dots, and improvement of the stability
of quantum dots in physiological buffers or inside the live animal via surface
1.5 References
1. Murcia, M. J.; Naumann, C.A. Biofunctionalization of fluorescent nanoparticles In
Biofunctionalization of nanomaterials. By Kumar,Challa S. S. R. (Editor), 2005:1-38.
2. Bruchez, M.; Moronne, M.; Gin, P.; Weiss, S.; Alivisatos, A. P. Science, 1998, 281,
2013–2016
3. Chan, W. C. W.; Nie, S.M. Science, 1998, 281, 2016–2018
4. Willard, D. M.; Mutschler, T.; Yu, M.; Jung, J.; Van Orden, A. Anal. Bioanal. Chem.,
2006, 384, 564–571
5. Lakowicz, J.R., Principles of Fluorescence Spectroscopy, 3nd Edition; Springer: New
York, 2006
6. Skoog, D.A.; Holler, F.J.; Nieman, T.A.; Principles of Instrumental Analysis, 5th Edition, Sanders Golden Publishing, 1998
7. Haugland, R.P., Handbook of Fluorescent Probes and Research Products, 9th Edition, 2002
8. O’Connell, P.J., Guilbault, G.G., Anal. Lett.,2001, 34, 1063-1078,
9. Bensin, D.E., Conrad, D.W., de Lorimer, R.M., Tranmel, S.A., Hllinga, H.W., Science
2001, 293, 1641-1644,
10. Hellinga, H. W.; Marvin, J. S., Trends Biotechnol. 1998, 16, 183-189
11. Looger, L. L.; Dwyer, M. A.; Smith, J. J.; Hellinga, H. W. Nature2003, 423, 185-190
12. Jares-Erijman, E. A.; Jovin, T. M., Nat. Biotechnol.2003, 21, 1387-1395
13. Murphy, C.J., Anal. Chem, 2002, 74(19), 520A-526A
14. Alivisatos, A. P. Science 1996, 271 (5251),933-937
15. Efros, A.L.; Rosen, M. M., Ann. Rev. Mater. Sci, 2000, 30, 475-521
16. Chan, W. C.W; Maxwell, D. J.; Gao, X.; Bailey, R. E.; Han, M.; Nie, S., Curr. Opin.
Biotechnol.2002, 13, 40-46
17. Gao, X.H.; Yang, L.; Petrsos, J.A.; Marshall, F.F.; Simons, J.W.; Nie, S.M., Curr.
Opin. Biotechnol.2005, 16, 63-72
18. Michalet, F. X.; Pinaud, F. ; Bentolila, L. A.; Tsay, J. M.; Doose, S.; Li, J. J.; Sundaresan, G.; Wu, A. M.; Gambhir, S.; Weiss, S. S., Science, 2005, 307, 538-544
19. Murray, C.B.; Norris, D.J.; Bawendi, M.G.; J. Am. Chem. Soc., 1993, 115, 8701-15
20. Alivisatos, A.P., J. Phys.Chem., 1996, 100, 13226-29
21. Eailey, R.E.; Smith, A.M.; Nie, S.M., Physica E, 2004, 25, 1-12,
22. Striolo, A.; Ward, J.; Prausnitz, J.M.; Parak, W.J.; Zanchet, D.; Gerion, D.; Milliron, D.; Alivisatos, A.P. J. Phys. Chem. B., 2002, 106, 5500-5505
23. Leatherdale, C.A., Woo, W.K.; Mikulec, F.V.; Bawendi, M.G., J. Phys. Chem. B.,
2002, 106, 7619-7622
24. Parak, W.J.; Pellogrino, T.; Plank, C., Nanotechnology, 2005, 16, R9-R25
25. Dahan, M.; Laurence, T.; Pinaud, F.; Chemla, D.S.; Alivisatos, A.P., Opt. Lett, 2001,
26, 825-27
26. Hohng, S., Ha, T., J. Am. Chem. Soc., 2004, 126, 1324-25
27. Michalet, X.; Pinaud, F., Lacoste, T.D.; Dahan, M.; Bruchez, M., Single Mol.2001, 2,
261-276
28. Wu, X.; Liu, H.; Liu, J.; Haley, K.N.; Treadway, J.A., Nat. Biotechnol., 2003, 21,
41-46
30. Ness, J.M.; Akhtar, R.S.; Latham, C.B.; Roth, K.A.; J. Histochem. Cytochem., 2003,
51, 981-87
31. Jaiswal, J.K.; Mattoussi, H.; Mauro, J.M.; Simon, S.M.; Nat. Biotechnol., 2003, 21,
47-51
32. Hanaki, K., Momo A., Oku, T., Komoto, A., Maenosono, S., Biochem. Biophys. Res.
Commun., 302, 496-501
33. Dubertret, B., Skourides, P., Norris, D.J., Noireaux, V., Brivanlou, A.H., Libchaber,
A., Science, 2002, 1759-62
34. Gaponik, N.; Talapin, D. V.; Rogach, A. L.; Eychmuller, A.; Weller, H.; Nano Lett.
2002; 2(8); 803-806
35. Ni, T.; Nagesha, D. K.; Robles, J.; Materer, N. F.; Mussig, S.; Kotov, N. A.; J. Am.
Chem. Soc. 2002; 124(15); 3980-3992
36. Hirai, T.; Watanabe, T.; Komasawa, I. J. Phys. Chem. B. 1999, 103 (46).
10120-10126
37. Farmer, S. C.; Patten, T. E.; Chem. Mater. 2001; 13(11); 3920-3296
38. Mansur, HS, Vasconcelos WL, Grieser F, Caruso F. J. Mater. Sci. 1999, 34 (21),
5285-5291
39. Zelner M, Minti H, Reisfeld R, Cohen H, Tenne R. Chem. Mater. 1997, 9 (11),
2541-2543
40. Peng, Z. A.; Peng, X.; J. Am. Chem. Soc.2001; 123(1), 183-184
41. Peng, Z. A.; Peng, X. J. Am. Chem. Soc. 2001; 123(7), 1389-1395
42. Yu, W. W.; Qu, L.; Guo, W.; Peng, X.; Chem. Mater. 2003; 15(14); 2854-2860
43. Hines, M. A.; Guyot-Sionnest, P. J. Phys. Chem. 1996, 100, 468-471.
44. Dabbousi, B. O.; Rodriguez-Viejo, J.; Mikulec, F. V.; Heine, J. R.; Mattoussi, H.; Ober, R.; Jensen, K. F.; Bawendi, M. G. J. Phys. Chem. B 1997, 101, 9463-9475.
45. Li, J. J.; Wang, Y. A.; Guo, W.; Keay, J. C.; Mishima, T. D.; Johnson, M. B.; Peng,
X.; J. Am. Chem. Soc. 2003, 125, 12567-12575
46. Mekis, I.; Talapin, D. V.; Kornowski, A.; Haase, M.; Weller, H. J. Phys. Chem. B
2003,107, 7454-7464
47. Malik, M. A.; O’Brien, P.; Revaprasadu, N. Chem. Mater. 2002, 14, 2004-2010
48. Mattoussi, H.; Mauro, J. M.; Goldman, E. R.; Anderson, G. P.; Sundar, V. C.; Mikulec, F. V.; Bawendi, M. G.; J. Am. Chem. Soc.2000, 122, 12142-12150 .
49. Pathak, S., Choi, S. K., Arnheim, N., Thompson, M. E., J. Am. Chem. Soc. 2001,
123, 4103-4104 .
50. Guo, W.; Li, J.J.; Wang, Y.A.; Peng, X.; Chem. Mater.,2003, 15, 3125-3133
51. Chen, Y., Rosenzweig, Z.; Anal. Chem.;2002; 74(19); 5132-5138
52. Pinaud, F., King, D., Moore, H.P., Weiss, S., J. Am. Chem. Soc. 2004,126, 6115.
53. Aldana, J.; Wang, Y.A.; Peng, S., J. Am. Chem. Soc., 2001, 123, 8844-8850
54. Yu, W.W.; Chang, E.; Drezek, R.; Colvin, V.L, Biochem. Biophys. Res. Commun.,
2006, 348, 781-786
55. Mulvaney, P.; Liz-Marzan, L.M.; Giersig, M.; Ung, T., J. Mater. Chem., 2000, 10,
1259-1270
56. Gerion, D.; Pinaud, F.; Williams, S.C.; Parak, W.J.; Zanchet, D.; Weiss, S.; Alivisatos, A.P.; J. Phys. Chem. B.; 2001, 105, 8861-8871
58. Rogach, A.L.; Nagesha, D.; Ostrander, J.W.; Giersig, M.; Kotov, N.A.; Chem.
Mater.,2000, 12, 2676-2685
59. Alivisatos, A.P.; Gu, W.W.; Larabell, C., Annu. Rev. Biomed. Eng., 2005, 7, 55-76
60. Gao, X.; Cui, Y.; Levenson, R.M.; Chung, L.W.; Nie, S.; Nat. Biotechnol.,2004, 22,
969-976
61. Pellegrino, T.; Manna, L.; Kudera, S., Liedl, T.; Koktysh, D.; Rogach, A.L. Keller, S.; Raedler, J.; Natile, G.; Parak, W.J.; Nano. Lett.,2004, 4, 703-707
62. Fan, H.; Leve, E.W.; Scullin, C.; Gabaldon, J.; Tallant, D.; Bunge, S.; Boyle, T.; Wilson, M.C.; Brinker, C.J.; Nano. Lett.; 2005, 5, 645-648
63. Goldman, E. R.; Balighian, E. D.; Mattoussi, H.; Kuno, M. K.; Mauro, J. M.; Tran, P. T.; Anderson, G. P. J. Am. Chem. Soc.; 2002; 124(22); 6378-6382.
64. Lingerfelt, B. M.; Mattoussi, H.; Goldman, E. R.; Mauro, J. M.; Anderson, G. P.
Anal. Chem., 2003, 75(16), 4043-4049.
65. Aoyagi, S.; Kudo, M.; Biosens Bioelectron. 2005 15; 20(8):1680-4.
66. Ravindran, S.; Kim, S.; Martin, R.; Lord, E. M.; Ozkan, C. S.; Nanotechnology 2005,
16(1), 1-4.
67. Zhang, Y.; So, M.-k.; Loening, A. M.; Yao, H.; Gambhir, S. S.; Rao, J. Angewandte
Chemie, International Edition2006, 45(30), 4936-4940.
68. Tholouli, E. ; Hoyland, J. A.; Di Vizio, D.; O'Connell, F.; MacDermott, S. A.; Twomey, D.; Levenson, R.; Yin, J. A. Liu; G., Todd R.; Loda, M.; Byers, R.
Biochem. Biophys. Res. Commun., 2006, 348(2), 628-636.
69. Srinivasan, C.; Lee, J.; Papadimitrakopoulos, F.; Silbart, Lawrence K.; Zhao, M.; Burgess, D. J. Molecular Therapy, 2006, 14(2), 192-201.
70. Crut, A.; Geron-Landre, B.; Bonnet, I.; Bonneau, S.; Desbiolles, P.; Escude, C.,
Nucleic Acids Research, 2005, 33(11), e98/1-e98/9.
71. Gill, R.; Willner, I.; Shweky, I.; Banin, U., J. Phys. Chem. B 2005, 109, 23715-23719.
72. Zhang, C.Y.; Yeh, H.C.; Kuroki, M.T.; Wang, T.H. Nature Materials 2005, 4,
826-831.
73. Medintz, I.L.; Goldman, E.R.; Lassman, M.E.; Mauro, J.M. Bioconj. Chem. 2003, 14,
909-918.
74. Patolsky, F.; Gill, R.; Weizmann, Y.; Mokari, T.; Banin, U,; Willner, I. J. Am. Chem.
Soc. 2003, 125, 13918-13919.
75. Kim, J.H.; Morikis, D.; Ozkan, M. Sensors Actuators B-Chemical 2004, 102,
315-319.
76. Medintz, I.L.; Clapp, A.R.; Melinger, J.S.; Deschamps, J.R.; Mattoussi, H. Adv. Mat.
2005, 17, 2450-2455.
77. Pons, T.; Medintz, I.L.; Wang, X.; English, D. S.; Mattoussi, H., J. Am. Chem. Soc.,
2006, 128(47), 15324-15331
78. Dubertret, B.; Skourides, P.; Norris, D. J.; Noireaux, V.; Brivanlou, A. H.; Libchaber,
A. Science2002, 298(5599), 1759-1762.
79. Wu, X.; Liu, H.; Liu, J.; Haley, K.N.; Treadway, J.A.; Larson, J. P.; Ge, N.; Peale, F.; Bruchez, M. P. Nature Biotechnology 2003, 21(1), 41-46
80. Fu A.; Gu W.; Larabell C.; Alivisatos A. P. Current opinion in neurobiology, 2005,
15(5), 568-75.
81. Smith, A. M.; Dave, S.; Nie, S.; True, L.; Gao, X. Expert Review of Molecular
82. Weng, J.; Song, X.; Li, L.; Qian, H.g; Chen, K.; Xu, X.; Cao, C.i; Ren, J.. Talanta
2006, 70(2), 397-402
83. Akerman, M. E., Chan, W. C. W., Laakkonen, P., Bhatia, S. N., Ruoslahti, E., P. N.
A. S. U. S. A. 2002, 99, 12617-12621
84. Larson, D.R.; Zipfel, W. R.; Williams, R. M.; Clark, S. W.; Bruchez, M.l P.; Wise, F. W.; Webb, W. W.; Science2003, 300(5624), 1434-1437.
85. Hoshino, A.; Hanaki, K.; Suzuki, K.; Yamamoto, K. Biochemical and Biophysical
Research Communications 2004, 314(1), 46-53.
86. So, M.-K.; Xu, C.; Loening, A.M.; Gambhir, S. S.; Rao, J. Nature Biotechnology
2006, 24(3), 339-343.
87. Cai, W.; Shin, D.-W.; Chen, K.; Gheysens, O.; Cao, Q.; Wang, S..; Gambhir, S.S.; Chen, X.. Nano Letters2006, 6(4), 669-676.
88. Clapp, A.R.; Medintz, I.L., Mattoussi, H., Chemphyschem. 2006; 7:47-57
89. Clapp, A. R.; Medintz, I. L.; Mauro, J. M.; Fisher, B. R.; Bawendi, M. G.; Mattoussi,
H., J. Am. Chem. Soc.; 2004; 126(1); 301-310
90. Willard, D.M.; Van Orden, A.; Nat. Mater., 2003, 2 (9): 575-576
91. Kagan, C.R.; Murra, C.B.; Bawendi, M.G. solids. Phys. Rev. B-Condens. Matt. 1996;
54, 8633-8643
92. Kagan, C.R.; Murray, C.B.; Nirmal, M, Bawendi, M.G. Phys.Rev.Lett. 1996; 76,
1517-1520
93. Willard, D.M., Carillo, L.L., Jung, J., Orden, A.V. Nano Lett., 2001; 1, 469-474.
94. Finlayson, C.E., Ginger, D.S., Greenham, N.C. Chem.Phys.Lett.2001; 338, 83-87
95. Mamedova, N.N., Kotov, N.A., Rogach, A.L., Studer, J. Nano Lett. 2001; 1, 281-286
96. Medintz, I.L.; Clapp, A.R.; Matoussi, H.; Goldman, E.R.; Fisher, B.; Mauro, J.M.,
Nat. Mater.2003, 2, 630-638
97. Goldman, E.R.; Medinta, I. L.; Whitley, J. L., J. Am. Chem. Soc., 2005; 127,
6744-6751.
98. Goldman, E. R.; Clapp, A. R.; Anderson, G. P.; Uyeda, H. T.; Mauro, J. M.; Medintz, I. L.; Mattoussi, H. Anal. Chem.;2004; 76(3), 684-688
99. Xu, C.; Xing, B.; Rao, J.; Biochem. Biophys. Res. Commun., 2006; 344, 931-935
100. Chang, E.; Miller, J.S.; Sun, J., et al. Biochem. Biophys. Res. Commun. 2005;
334(4), 1317-1321.
101. Zhang, C.Y.; Yeh, H.C.; Kuroki, M.T.; Wang, T.H., Nat. Mater.,2005; 4,826-831.
102.Bakalova, R.; Zhelev, Z., Ohba, D.; Baba, Y., J. Am. Chem. Soc., 2005,
127,11328-11335.
103. Medintz, I.L.; Konnert, J.H.; Clapp, A.R.; Proc. Natl. Acad. Sci. U.S.A. 2004, 101,
9612-9617
104. Nie, S.M.; Xing, Y.; Kim, G.J.; Simons, J.W., Annu. Rev. Biomed. Eng., 2007, 9:
12.1-12.32
105. Kaul, Z.; Yaguchi, T.; Kaul, S.C.; Hirano, T.; Wadhwa, R.; Taira, K.; Cell Res.,
2003, 13, 503-7
106. Tokumasu, F.; Dvorak, J.; J. Microsc.,2003, 211, 256-61
107. Lidke, D.S.; Nagy, P.; Heintzmann, R.; Arndt-Jovin, D.J.; Post, J.N.; Grecco, H.E.; Jares-Erijman, E.A.; Jovin, T.M.; Nat. Biotechnol.,2004, 222, 198-203
108. Dahan, M.; Levi, S.; Luccardini, C.; Rostaing, P.; Riveau, B.; Triller, A.; Science,
109. Rosenthal, S.J.; Tomlinson, A.; Adkins, E.M.; Schroeter, S.; Adams, S.; J.Am.
Chem. Soc.,2002, 124, 4584-94
110. Minet, O.; Dressler, C.; Beuthan, J.; J. Fluoresc., 2004, 14, 241-47
111. Ramachandran, S.; Merrill, N.E.; Blick, R.H.; Van der Weide, D.W.; Biosens.
Bioelectron., 2005, 20, 2173-2176
112. Mattheakis, L.C.; Dias, J.M.; Choi, Y.J.; Gong, J.; Bruchez, M.P.; Liu, J.; Wang, E.;
Anal. Biochem., 2004, 327, 200-8
113. Delehanty, J.B.; Medintz, I.L.; Pons, T.; Brunel, F.M.; Dawson, P.E.; Mattoussi, H.;
Bioconjugate Chem.,2006, 17, 920-927
114. Chen, F.; Gerion, D.; Nano Lett., 2004, 4, 1827-1832
115. Rozenzhak, S.M.; Kadakia, M.P.; Caserta, T.M.; Westbrook, T.R.; Stone, M.O.; Naik, R.R., Chem. Commun., 2005, 2217-2219
116. Parak, W.J.; Boudreau, R.; LeGros, M.; Gerion, D.; Zanchet, D.; Adv. Mater. , 2002,
14, 882-85
117. Ballou, B.; Lagerholm, B.C.; Ernst, L.A.; Burchez, M.P.; Waggoner, A.S.;
Bioconju.Chem., 2004, 15, 79-86
118. Rhyner, M.N.; Smith, A.M.; Gao, X.H; Mao, H.; Yang, L.; Nie, S.M.;
Nanomedicine,2006, 1, 209-217
119. Cai, W.B.; Hsu, A.R.; Li, Z.B.; Chen, X.Y.; Nanoscale Res. Lett, 2007, 2(6),
CHAPTER 2 EXPERIMENTAL
This chapter describes the general experimental information, which includes
chemicals and supplies, instrumentation for characterization, and the cell culture
procedures. The specific and detailed experimental procedures will be discussed in the
appropriate chapter.
2.1 Chemicals and supplies
Cadmium oxide (CdO, Sigma), lauric acid (Sigma), trioctylphosphine (TOP, Sigma),
trioctylphophine oxide (TOPO, Sigma), hexadecylamine (HDA, Sigma), selenium
powder (Sigma), diethylzinc (Zn(Et)2, Sigma), hexamethyldisllathiane ((TMS)2S, Sigma),
chloroform (Sigma), methanol (Sigma), peptide RGDC (American Peptide Company),
dimethyl sulfoxide (DMSO, Sigma), tetramethylammonium hydroxide pentahydrate
(TAMOH, Sigma), pyridine (Sigma), Rhodamine RedTM-X, succinimidyl ester 5-isomer
(Rhodamine, Invitrogen), trypsin from porcine pancreas (trypsin, Sigma), collagenase
(Sigma), urease (Sigma), 1,10-phenantroline (Sigma), 4-(2-Aminoethyl)
benzene-sulfonyl fluoride hydrochloride (Sigma), 4-Amidinophenylmethane-benzene-sulfonyl fluoride
hydrochloride (Sigma), Dulbecco’s PBS buffer solution at pH 7.4 (1X) (2.67 mM KCl,
1.47 mM KH2PO4, 137.93 mM NaCl, and 8.06 mM Na2HPO4.7H20) (Invitrogen),
HTB126 breast cancer cells (ATCC), HTB125 normal breast cells (ATCC), Dulbecco’s
modified Eagle’s medium (Invitrogen), Dulbecco’s PBS buffer (Invitrogen), Fetal bovine
pyruvate (Invitrogen), Epidermal Growth Factor(EGF, Invitrogen), Sodium
Bicarbonate(sigma), Bovine Insuline(invitrogen), Hybri-care cell culture media(ATCC),
trypan blue (invitrogen), Mercaptohexadecanoic acid (MHDA, Sigma),
Metallothionein(MT, Sigma), Aminobenyl-EDTA(Sigma), Glutaraldehyde(Sigma),
Sodium cyanoborohydride(Sigma) , manganese chloride (Sigma), Calcium chloride (J.T.
Barker), ferrous ammonium sulfate (Mallinckrodt), Zinc chloride(E.M), cupric sulfate
pentahydrate (E.M), ferric chloride (Sigma), Sodium Chloride(E.M), Sodium fluoride
(E.M.), ethylenediaminetertaacetic acid disodium salt dehydrate (EDTA, J. R. Barker),
3-hydroxy-1,2-dimethyl-4(1H)-pyridone(HPO, Sigma), 3-(N-Morpholino)
propanesulfonic acid (MOPS, USB), sodium hydroxide (sigma), hydrogen chloride acid
(sigma),
All aqueous solutions were prepared with 18 MΩ deionized water produced by a water
purification system (Barnstead Thermolyne Nanopure) and all chemicals were used as
received without further purification. Amicon Centricon YM30 spin dialysis tubes were
purchased from Microcon. Microscope glass cover slips used for microscopy and
Lab-Tek II chambered coverglass were purchased from VWR.
2.2. Characterization
2.2.1. Absorption Spectra
Absorption spectra of free quantum dots in solution and their nanoassemblies were
obtained in two systems: a Varian UV-VIS-NIR spectrophotometer system (CARY 500
2.2.2. Fluorescence Emission Spectra
Emission spectra of free quantum dots solution and their nanoassemblies were taken
in a quartz cuvette using a spectrofluorometer (PTI International, Model QM-1), or LS 55
Luminescence spectrometer (Perkin Elmer), both equipped with a 75-W continuous Xe
arc lamp as a light source.
2.2.3. Digital Fluorescence Imaging Microscopy and Spectroscopy
Emission spectra and images of free quantum dots solution and their nanoassemblies
were obtained using digital luminescence imaging microscopy and spectroscopy system,
equipped with a 100 W mercury lamp as a light source. Emission spectra were measured
by Olympus (IX-71) inverted fluorescence microscope equipped with a 250 mm
spectrograph and a high performance 16-bit back-illuminated CCD camera (Roper
Scientific) The Roper Scientific software Win Spec/32 was used for spectral analysis.
Images were monitored by Olympus (IX-71) inverted fluorescence microscope equipped
with a high performance color CCD camera (Olympus DP 70). The software Image-pro
Plus was used for image analysis. A filter cube containing a 425 ±20 nm band-pass
excitation filter, a 465 nm dichroic mirror, and a 475nm long pass emission filter was
used to ensure spectral purity. The spectra and images were taken through 10X, 20X, and
2.3. Cell culture of HTB 125 and HTB 126
2.3.1. Cell maintenance
HTB 125 is a normal breast cell line and HTB 126 is one type of breast cancer cells.
These two cell lines were used to study extracellular MMPs activity. The cells were
maintained following protocols provided by the American Type Tissue Culture
Collection (ATCC). For HTB125, the media was specially prepared by Hyclone in order
to have the same composition as the Hybri-care cell culture media used by ATCC but
without phenol red. The basic media was supplemented by adding 30 ng/mL of EGF, 1.5
g/L of Sodium Bicarbonat,e and 10% of Fetal Bovine Serum Qualified. For HTB126, 4
mM of L-glutamine, 0.01 mg/mL of Bovine Insuline, and 10% of Fetal Bovine Serum
were added to DMEM supplemented media used as growth media. The cells were grown
at 370C under 5% CO2. The medium was renewed every 3 days. Cell cultures were
planted in a 4-well chamber. The following procedures describe the cell preparation steps
of trypsinizing the cells, counting the cells, and planting the cells.
2.3.2 Trypsinization
5 mL of Trypsin-EDTA was added to the confluent 75 cm2 T-culture flask and, after a
brief washing of the cells surface, the trypsin was removed and discarded. Thus, 5 mL of
Trypsin-EDTA was added to the flask. The flask was put in the incubator (37 0C) for
10-15 minutes, or until we see the cells detached from the flask surface. The trypsinized cell
suspension were homogenized with a 5 mL pipette and 1-2 mL of this cell suspension
were transferred for a new 75 cm2 T-culture flask, The cells were dispersed in 25 mL of
2.3.3 Counting
200 μL of the cell suspension solution was mixed very well with 200 μL of trypan
blue, and then 12 μL of the mixed solution was injected into the hemacytometer. The
hemacytometer was placed under the microscope to count the number of cells. If the
number of cells counting on the hemacytometer is X, the number of the cells/mL is
20,000 times of X.
2.3.4 Planting
Cell suspension (106 cells/mL) was seeded onto a glass slide chamber. Then, 1 mL of
growth media was added to the chamber it was incubated at 37 0C under 5% CO2 for 48
CHAPTER 3 QUANTUM DOTS FRET BASED PROTEASE SENSOR
3.1 Introduction
My PhD study targets a unique family of enzymes called matrix metalloproteinases
(MMPs). MMPs are nautral proteinasesthat share a common modular domain structure
and are capable of degrading the extracellular matrix (ECM) components(1-3). The main
components of ECM are various glycoproteins, proteoglycans and hyaluronic acid. The
most abundant glycoproteins in the ECM are collagens. There are over 20 different
enzymes in the MMP family. Most MMPs appear to be secreted from cells in their
inactive form, making their activation a key step in regulating the amount of degradative
activity outside the cells. MMPs have the following functions: i) they regulate the level
of ECM degradation and remodelling; ii) they participate in mechanisms enabling cell
migration, wound healing, and angiogenesis; iii) they activate other MMPs; iv) they
release or activate growth factors and other bioactive molecules. The motivation to target
MMPs and develop sensors to detect their activity arises from their largely higher level in
tumors compared to normal tissues. Numerous studies have shown a correlation between
the expression of MMPs and the invasive behavior and metastasis potential of tumors (4,
5). For example, MCF-7 breast cancer cells in culture produce both soluble and
membrane-bound factors that stimulate the production of pro-MMPs (6). A higher level
of MMP1 was found in the breast cancer cell lines MDA-MB-231 and MCF-7 compared
to normal breast cell lines (7). Clearly, it is of high importance to develop tools for the
measurement of MMPs as a mean for the detection of breast cancer cells in biopsies. A
understanding of the functions of MMPs in cancer development. These include the design
of biocompatible near infrared fluorochromes, novel imaging probes specific to MMPs,
fluorescent nanoparticles and fluorescence molecular tomography (FMT)(8, 9). Recently
Bremer and co-workers described a probe which is based on FRET between organic
fluorophore donor and acceptor molecules via a peptide linker that is amenable to
cleavage by MMPs (10). Here, we take advantage of quantum dots as FRET donors in
place of organic dyes and we have designed quantum dot FRET based probes to real time
monitoring of MMPs in cell cultures and effectively discriminate between MMPs activity
in normal and cancerous breast cell cultures.
As we discussed in the chapter 1, quantum dots based FRET biosensors have been
devised over the past few years. Recently, quantum dots were linked to peptide molecules
that were labeled with quenchers or molecular acceptors were used probes for proteolytic
activity (11-13). West and her coworkers first developed protease probes for collagenase
based on the FRET between quantum dots and gold nanoparticles via a proteolytically
degradable peptide linker (11). They reported a 52% rise in luminescence of quantum
dots over 47 hours of exposure to 0.2 mg/mL collagenase. The quenching mechanism is
still not clear. Possibly, the response time of these probes was long due to aggregation of
the quantum dots-gold nanocrystals clusters that do not involve peptide linking and steric
hindrances that decrease the rate of enzymatic cleavage of molecular peptides trapped
between the larger nanoparticles. Also, the use of gold as FRET acceptor will not allow
the use of ratiometric detection due to the absence of re-emission of gold nanoparticle.
Mattoussi and coworkers recently developed a modular peptide structure that allowed the