University of New Orleans University of New Orleans
ScholarWorks@UNO
ScholarWorks@UNO
University of New Orleans Theses and
Dissertations Dissertations and Theses
Fall 12-17-2011
Exchange flows in an urban water body: Bayou St. John
Exchange flows in an urban water body: Bayou St. John
responses to the removal of flood control structures, future water
responses to the removal of flood control structures, future water
elevation control, and water quality
elevation control, and water quality
Robin L. Schroeder
UNO, [email protected]
Follow this and additional works at: https://scholarworks.uno.edu/td
Part of the Hydrology Commons
Recommended Citation Recommended Citation
Schroeder, Robin L., "Exchange flows in an urban water body: Bayou St. John responses to the removal of flood control structures, future water elevation control, and water quality" (2011). University of New Orleans Theses and Dissertations. 1394.
https://scholarworks.uno.edu/td/1394
This Thesis is protected by copyright and/or related rights. It has been brought to you by ScholarWorks@UNO with permission from the rights-holder(s). You are free to use this Thesis in any way that is permitted by the copyright and related rights legislation that applies to your use. For other uses you need to obtain permission from the rights-holder(s) directly, unless additional rights are indicated by a Creative Commons license in the record and/or on the work itself.
Table of Contents
LIST OF FIGURES...V
LIST OF TABLES...VIII
ABSTRACT ... IX
CHAPTER 1 ... 1
1.1 INTRODUCTION... 1
1.2 LITERATURE REVIEW AND REVIEW OF NUMERICAL METHODS... 2
General hydrologic characteristics ... 2
Contamination Sources and Documentation... 4
Sediment Characteristics... 6
KEY HYPOTHESES... 7
SCIENTIFIC QUESTIONS... 7
OBJECTIVES... 9
CHAPTER 2. STUDY AREA AND SIGNIFICANCE... 10
NEW ORLEANS AND LAKE PONTCHARTRAIN... 10
BAYOU ST. JOHN... 10
Inlet ... 10
Bayou ... 11
HISTORICAL TRENDS IN BAYOU ST. JOHN... 11
CHAPTER 3. METHODS ... 14
FIELD STUDIES... 14
Objective of Field Studies ... 14
Field Methods... 14
NUMERICAL MODELING... 16
Model Skill Assessment ... 17
Hydrologic Analysis of Simulations... 18
CHAPTER 4. NUMERICAL MODELING ... 21
DESCRIPTION OF 1‐D NUMERICAL METHODS:... 21
DESCRIPTION OF ECOMSED ... 23
ECOMSED INITIAL CONDITIONS... 26
ECOMSED BOUNDARY CONDITIONS... 27
ECOMSED SIMULATIONS... 28
CHAPTER 5. RESULTS... 29
RESULTS OF FIELD ACTIVITIES... 29
Geophysical and Sediment Contamination Analysis ... 29
Water Elevation... 31
Analysis of Water Parameter Variability... 33
RESULTS AND IMPLEMENTATION OF 1‐D MODEL... 35
ECOMSED Model Calibration... 37
Sensitivity Testing... 38
MODEL VALIDATION... 39
Mixing and Tidal Exchange Flow ... 43
Shear Stress Analysis ... 47
ANALYSIS OF SIMULATIONS... 48
Surface Water Elevation Simulation Results ... 48
Salinity Simulation Results ... 50
Temperature Simulation Results ... 53
Mixing and Tidal Exchange Flow Simulation Results... 55
Shear Stress Simulation Results... 62
CHAPTER 6. DISCUSSION ... 63
EVALUATION OF HYPOTHESIS 1 ... 63
EVALUATION OF HYPOTHESIS 2 ... 64
CONCLUSIONS... 65
FUTURE RECOMMENDATIONS: ... 66
REFERENCES:... 68
VITA... 72
List of Figures
Figure 1. The insets show the location of Bayou St. John in relation to the state of Louisiana
and close‐up aerial photographs of the sector gates and waterfall structure located in
the inlet. The large image is an aerial photograph of Bayou St. John next to City Park
and encompasses a portion of New Orleans, LA and Lake Pontchartrain. The legend
details symbols that delineate locations of the different discharge control features,
anthropogenic structures, and field data collection. ...8
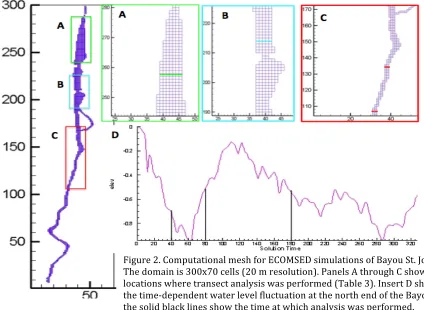
Figure 2. Computational mesh for ECOMSED simulations of Bayou St. John. The domain is
300x70 cells (20 m resolution). Panels A through C show locations where transect
analysis was performed (Table 3). Insert D shows the time‐dependent water level
fluctuation at the north end of the Bayou and the solid black lines show the time at
which analysis was performed...20
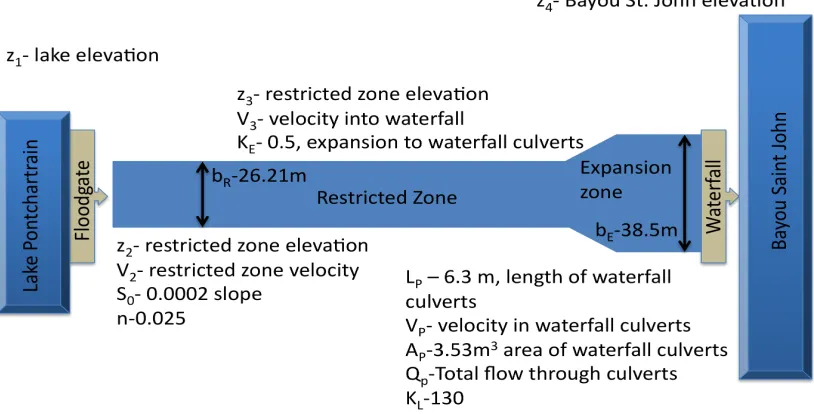
Figure 3. Schematic representation of the inlet into Bayou St. John detailing both
anthropogenic structures, local geometry of the channel, and constants determined
through field methods and calibration of the 1‐D model. ...23
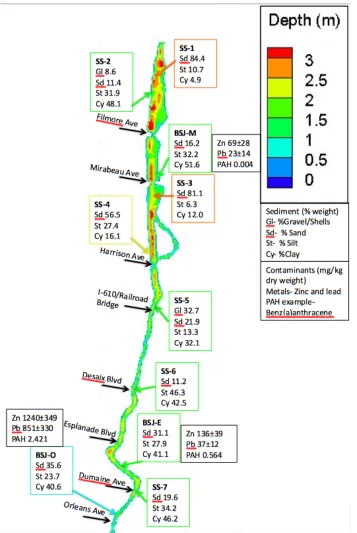
Figure 4. Representation of bathymetry in Bayou St. John (Martinez et al., 2008) as it
relates to grain size in the bottom sediment. The SS‐x samples were collected during
this study and the BSJ‐x samples were collected and analyzed by Mowat and Bundy
(2001). The color of the outline surrounding each sediment sample and arrow links
the sample to the approximate location and depth the sample was collected from. The
black boxes are examples of contamination recorded at each BSJ‐x location (Mowat
and Bundy, 2001). The black arrows delineate the location of bridges crossing Bayou
St. John. ...30
Figure 5. Time dependent water surface elevation in meters (relative to NAVD 88 m) in
Bayou St. John compared to those of Lake Pontchartrain (denoted by the two outfall
canals), the restricted zone, and north and south Bayou St. John as observed during
field data collection. ...32
Figure 6. Water velocities recorded at the north end of Bayou St. John indicative of forward
and reverse flow through the waterfall structure. ...33
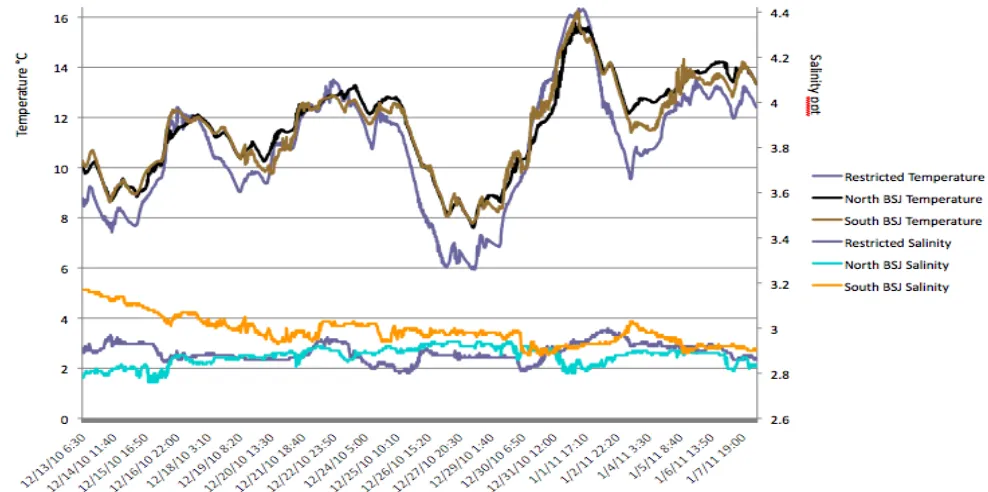
Figure 7. Temperature and salinity recorded within Bayou St. John during December 2010
and January 2011 field data collection. ...35
Figure 8. Results of predicted water surface elevation in Bayou St. John based on the 1‐D
equations shown in comparison to field observations during field deployment. A K
Lvalue of 130 was used for this simulation...37
Figure 9. Comparison of the predicted water surface elevations of the calibrated model at
10% meteorological forcing to the observed water surface elevations at the north and
south end of Bayou St. John. ...38
Figure 10. Predicted time‐dependent salinity at the north and south locations within Bayou
St. John for the base calibration compared to each sensitivity test and the observed
values. ...42
Figure 11. Predicted time‐dependent temperature at the north and south locations within
Figure 12. Bulk Richardson number comparison between the base calibration and
sensitivity testing. Values are expressed as time‐dependent, daily averages. ...45
Figure 13. Bulk Richardson number comparison between the base calibration and 25%
Meteorological Forcing sensitivity test between the south and far south locations. ...46
Figure 14. Comparison of time‐dependent flow for the base calibration and all sensitivity
tests. Flows are shown as daily averages through the simulation period. Positive flow
is into the Bayou (toward the south) and negative flow is to the north. ...47
Figure 15. Shear stress analysis for the base calibration compared to sensitivity tests for
both north and south locations...48
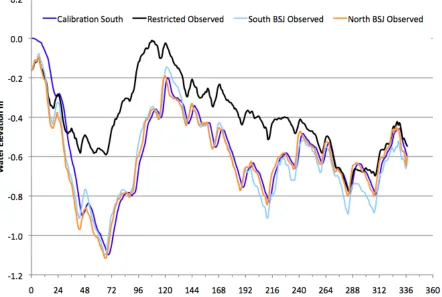
Figure 16. Evaluation of predicted water surface elevations at the south end of the Bayou
for simulations plotted alongside observed water elevations of the inlet, Lake
Pontchartrain, and North Bayou St. John...49
Figure 17. Time dependent salinities predicted by the calibration and simulations at the
north and south end of Bayou St. John compared to observed salinities at both
locations. The lighter time series represent the...51
Figure 18. Time dependent salinities predicted by the calibration and the Lake
Pontchartrain forcing simulation compared to the observed salinities at south Bayou
St. John. The lighter time series represent bottom salinities and the darker time series
represent surface salinities. ...52
Figure 19. Time dependent predicted salinities for the far south within Bayou St. John for
the calibration and Lake Pontchartrain forcing compared to observed salinities at the
south end of the Bayou. The lighter time series represent the bottom salinities and the
darker time series represent the surface salinities...53
Figure 20. Analysis of temperature for simulations 1 through 4 showing the north, south,
and far south locations with reference to the inlet salinities ...54
Figure 21. Time dependent predicted temperature comparison of surface and bottom
temperatures for the Lake Pontchartrain forcing simulation from north to far south.
The blue time series represent the north, the green time series represents the south,
and the red series represents the far south...55
Figure 22. Bulk Richardson number evaluation through Bayou St. John from north to far
south. Vertical stratification is observed only for the far south locations indicated by
red boxes...57
Figure 23. Bulk Richardson number evaluation from north to south within Bayou St. John in
reference to the calibration. ...57
Figure 24. Predicted time dependent flow through Bayou St. John for the calibration
compared to Lake Pontchartrain forcing at the south location...59
Figure 25. Predicted time dependent flow through Bayou St. John for the calibration
compared to Restricted zone forcing at the south location...59
Figure 26. Time dependent flow for the Calibration forcing simulation from north to south
showing flow dissipation with increasing distance from the open boundary. ...60
Figure 27. Time dependent flow for the Restricted zone forcing simulation from north to
south showing flow dissipation with increasing distance from the open boundary...60
Figure 28. Time dependent flow for the Lake Pontchartrain forcing simulation from north
Figure 29. Time dependent shear stress values for the Restricted zone forcing simulation
extracted in the center of each restriction caused by Mirabeau and Filmore Ave
List of Tables
Table 1. LSUAgricultural Center Historical Data Summary for Bayou St. John (2009‐2010)
...12
Table 2. Simulation table describing model scenarios, objectives, input details, and
numerical methods for hydrodynamic modeling. ...17
Table 3.Transect description including location, time segment, and number of points...18
Table 4. Representative sample of sediment contamination levels in Bayou St. John from
South to North taken from Mowat and Bundy (2001) compared to Canadian federal
guidelines. ...31
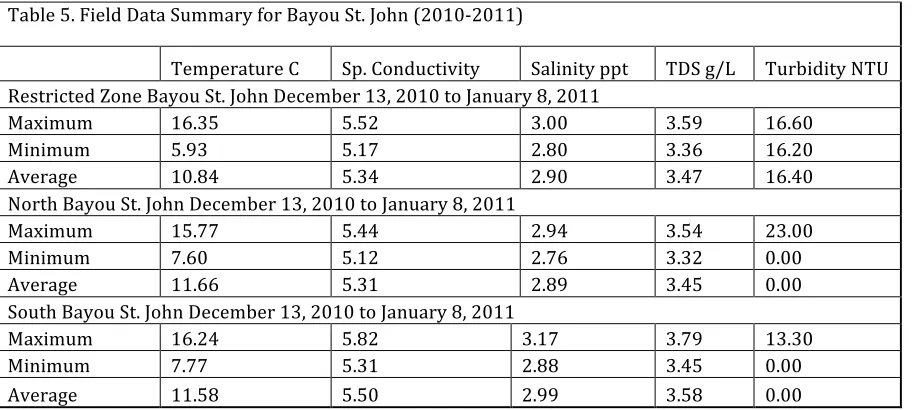
Table 5. Field Data Summary for Bayou St. John (2010‐2011)...34
Table 6. Statistical analysis of 1‐D predicted water surface elevations in North Bayou St.
John compared to observed values. ...37
Table 7. Statistical analysis of ECOMSED predicted water surface elevations in Bayou St.
John compared to observed values. ...39
Table 8. Statistical analysis of ECOMSED predicted temperature and salinity in Bayou St.
John compared to observed values. ...41
Table 9. Statistical analysis of vertical mixing in Bayou St. John for the calibration and
sensitivity simulations using bulk Richardson number (Ri
L) relative to velocity (U) and
density gradient (Δρ) from surface to bottom. Values were averaged across transects
at the North and Mid locations and sampled as a discrete value at the South location.
Values were derived after a simulation time of 40, 80, and 180 hours...45
Table 10. Analysis of Flow, Average bottom velocity, and maximum bottom velocity
predicted across transects at the north and mid and as discrete samples at the south
location within Bayou St. John for each calibration and sensitivity analysis for
instantaneous times at simulation hour 40, 80, and 180. ...46
Table 11. Statistical analysis of differences between the calibration, open boundary
Abstract
Bayou St. John, an urban water body extending south from Lake Pontchartrain, has
two anthropogenic structures that regulate flow from the Lake . The City of New Orleans
has plans to remove the inner control structure to improve water quality. Field and
numerical methods used in this study show removing this structure increased water
elevations throughout the Bayou but resulted in lower water elevation signal amplitudes
that caused a lower tidal flow exchange from north to south. Bulk Richardson numbers
showed mixing was inversely related to flow and the Bayou generally remains stratified.
Resuspension of contaminated sediment could negatively impact the local ecology but
predicted shear stress values did not reach a critical value (0.1 N/m
2) for resuspension.
Removal of the waterfall structure will benefit Bayou St. John by decreasing energy losses
from the Lake, however a more pronounced tidal signal from Lake Pontchartrain is
required to flush the Bayou.
Chapter 1
1.1 Introduction
Bayou St John is a historically important waterway that lies along the eastern side of City Park in New Orleans, Louisiana (Figure 1). This Bayou has traditionally been a location for families and local fisherman to enjoy recreational activities and played an important role in the settlement of the city of New Orleans (Freiberg and Chase, 1980). Local businesses, residents and
environmental advocacy groups, notably the Lake Pontchartrain Basin Foundation (LPBF, 2006) and the Bayou St. John Alliance, have made efforts to restore Bayou St. John to an ecologically healthy environment that the local community can enjoy for both educational and recreational benefit. Efforts have included dredging to decrease growth and subsequent decay of aquatic plant life, shoring the banks to reduce erosion (Ward, 1982), and restocking the Bayou with red drum (Brogan, 2010). The next phase of restoration is focused on improving water quality in the Bayou.
Flow into the Bayou is primarily from Lake Pontchartrain and to a lesser degree atmospheric input (precipitation) and storm water runoff (via bridges) from the surrounding residential neighborhoods. Flow between Lake Pontchartrain and Bayou St. John is restricted internally by two anthropogenic flood control structures. Sector gates located close to Lake Pontchartrain were initially designed to close only during storm events, however the gates
generally remain closed. Sluice gates, on either side of the sector gates, however, have the ability to allow some flow and are operated manually. An older flood control structure, known as the
waterfall structure, containing three culverts is located downstream (toward the Bayou) of the sector gates and is in poor condition. Two separate groups control water management (inflow and outflow) from the Bayou. These groups extract water from the Bayou for undisclosed time periods and flow. For example, City Park officials pump Bayou water into Lakes located within City Park to combat algae and hyacinth growth, to periodically flush the Lakes, and for other general water needs. The higher salinity water of Bayou St. John acts as an effective algaecide. The Sewerage and Water Board (SWB) controls two discharge valves in Bayou St. John that are opened in response to rising, or the anticipated rise, of water elevations in addition to sector gate control. These
cumulative anthropogenic alterations have radically altered the normal hydrologic response within Bayou St. John.
problems have been attributed to the flow restrictions caused by the waterfall structure and sector gates. Though there is little doubt aquatic wildlife migration is hindered by these anthropogenic structures, little is known about the internal hydrodynamics of the Bayou.
The local officials in the City of New Orleans government recently allocated funds to remove the culverts inhibiting flow at the waterfall structure, between the Bayou and the Lake. Removing the culverts will potentially increase the tidal exchange between the Bayou and Lake Pontchartrain. The resulting increase in tidal mixing and circulation is expected to alter water quality, which could potentially improve the ecological and environmental conditions of Bayou St. John. However, previous studies have identified the presence in high concentrations of toxic and otherwise harmful constituents harbored in the sediment of Bayou St. John (Mowat and Bundy, 2001). After removal of the waterfall structure, resuspension or general disturbance of this material from increased bed shear stress could have unforeseen negative consequences on the ecology and general water quality of the Bayou. This paper focuses on delineating the present tidal exchange between Bayou St. John and Lake Pontchartrain, identifying the governing controls of the exchange and through field data and use of numerical models predict future water quality and hydrodynamics.
1.2 Literature Review and Review of Numerical Methods
General hydrologic characteristics
Bayou St. John no longer acts as a natural waterway because the Bayou has restricted access to Lake Pontchartrain and no natural discharge. The flood control and water control structures limit flow, attenuate tidal fluctuations, and have stabilized Bayou St. John with respect to sediment flux, by establishing a low velocity environment. Removal of the waterfall structure, with a
subsequent opening of the sector gates could change these conditions allowing for an increase in the amount of sediment into and out of the Bayou and potentially redistribute sediments within the Bayou itself.
Analysis System (HEC HMS and HEC RAS) to both model flow within subbasins of Bayou St. John, the City Park Lakes, and associated drainage canals and to model flow across the subbasins. The models did not consider meteorological conditions other than precipitation. The results from this modeling showed that though the city prefers to maintain the Bayou at ‐0.8 m NAVD88, the Bayou can support water elevations as high as 0.27 m NAVD88 with little impact to the surrounding area due to the levees surrounding the Bayou. The poor water quality in Bayou St. John is attributed to poor Lake water quality entering the standing body of water (BKI, 2000), rather than runoff from the urban interior. The waterfall structure was shown to block water flow into the Bayou when the sector gate valves were opened due to the rapid change in head and high degree of blockage within the waterfall culverts. Water backing up in the inlet upstream of the waterfall structure was shown to cause more than 1 m of water elevation difference between the inlet and north Bayou. BKI (2000) recommended removing the waterfall structure to improve flow into the Bayou from the Lake using recommended control strategies at the sector gates only. Opening discharge valves maintained by the SWB was also recommended to increase flow from north to south in the Bayou but was not modeled (BKI, 2000).
(Glenn and Grant, 1987). However, Bayou St. John is narrow with limited fetch and therefore currents may prove to be the dominant process controlling sediment transport. Storm induced waves can have a significant impact on sediment deposition and transport depending on their zone of intensity and duration (Ranasinghe and Pattiaratchi, 2003). Flow at the culmination of a storm could cause sediment redistribution by effectively flushing disturbed sediment from the Bayou, either through discharge or return flow to the Lake (Ranasinghe and Pattiaratchi, 2003). Increased flow after the removal of the waterfall structure could increase the impact these events have on Bayou St. John.
Lake Pontchartrain is a large, shallow Lake that is susceptible to large changes in water elevation due to wind‐induced setup or set‐down and barometric effects, all of which occur generally during storm events. These fluctuations directly impact water elevations in Bayou St. John. Storm surges from hurricanes have been observed to triple the tidal amplitudes and cause increased water elevations of over a meter lasting for several days (Li et al., 2010). Lake
Pontchartrain has a small average tidal range of approximately 11 cm, which generally allows surface currents to be dominated by wind action (Stone et al., 1972). In 1996 a constant easterly wind led to setup from Lake Pontchartrain into the Amite River causing localized flooding (Hsu et al., 1997). Wind setup in shallow water bodies can balance tidal forcing if the tidal prism is small with strong predominant winds such as between two estuarine systems (Traynum and Styles, 2008). In Bayou St. John, wind from the south could potentially counter the tidal prism from Lake Pontchartrain, or retard tidal exchange. During stronger winds from the south, set‐down in the Lake, accompanied by a small setup in the Bayou, could create pressure gradients that would result in increased exchange between these two water bodies. Historically however large storms in this area are generally associated with the stronger winds from the north following the passage of cold fronts. Without proper control, these storm events have the potential to steadily raise water elevations in Bayou St. John as was observed in the Amite River.
Contamination Sources and Documentation
a high correlation to incomplete automobile combustion and sampling shows both high PAH and higher metals concentrations at the south end of the Bayou. This can be attributed to higher vehicle traffic from run‐off associated with the many bridges that cross Bayou St. John as well as from run‐ off directed to the south end of Bayou St. John from the interior of the city of New Orleans (Wang et al., 2004). A study conducted on Hurricane Katrina floodwater in New Orleans found that lead and arsenic levels were present in small quantities but above EPA drinking water standards (Pardue et al., 2005). Though the levels were not considered overly hazardous, the Katrina study shows many of the contaminants found in Bayou St. John can be attributed to accumulation of contaminated runoff (Pardue et al., 2005). Toxicity bioassays conducted in Bayou St. John also show much higher toxicity associated with sediment samples at the southern end of the Bayou than closer to Lake Pontchartrain (Mowat and Bundy, 2001). Temperature, salinity, dissolved oxygen, and conductivity were not found to be significantly different from north to south in the Bayou during 2009 field observations, however tagged red fish were not observed to travel south of I‐610 (Brogan, 2010). This behavior may be linked to the heavily contaminated sediments found in the southern portion of the Bayou, reducing mixing conditions, and generally a lower velocity environment.
There is additional evidence suggesting some contaminants coming into Bayou St. John originate from Lake Pontchartrain (Boyd et al., 2004; McCorquodale et al., 2004). Trace metals, including lead, copper, and cadmium, are common constituents of re‐suspended sediment samples taken from Lake Pontchartrain (Manheim et al., 1998). Lead and arsenic levels adsorbed to sediment in Lake Pontchartrain are above EPA criteria for clean soil and are consistent with long term accumulation (Dortch et al, 2008). Broken sewer lines due to subsidence (McCorquodale et al., 2001) allow raw sewage into the canals and waterways surrounding New Orleans including both Lake Pontchartrain and Bayou St. John. Fecal coliform are routinely discharged into Lake Pontchartrain along with storm water runoff gathered in New Orleans (Houck et al., 1989). Two discharge canals are located near Bayou St. John and field data and modeling of fecal coliform transport shows that concentration of these bacteria increases at the mouth of the inlet during discharge events and lasts for several days (McCorquodale et al., 2004; Carnelos 2003). Boyd et al. (2004) studied the concentration of raw sewage related chemicals in Bayou St. John and based on trends with rainfall concluded the source of these chemicals was most likely from Lake
Pontchartrain. Furthermore, fecal coliform were shown to persist in sediments deposited along the south shore much longer than free bacteria in the water column (McCorquodale et al., 2004). Both sediment resuspended by wind‐induced waves (List and Signell, 1996) and contaminated
Bayou St. John. Previous studies have delineated the path of certain sediment bound contaminants (Chilmakuri, 2005). Flow into the Bayou could be regulated to avoid inflow during the peak transport of these and other associated contaminants (Boyd et al., 2004) and thereby minimize transport of contaminants into Bayou St. John. With these considerations, increased tidal mixing may produce benefits in terms of salinity, temperature and increased movement of marine organisms into and out of the Bayou that may outweigh the possible risks associated with Lake borne contamination.
Sediment Characteristics
Bayou St. John is an inlet to a Lake system and therefore has innumerable analogs in the modern world. Sand grain size in ebb‐tidal deltas generally consists of coarse and medium sized grains responding to the high‐energy wave and tidal action found at the mouth of inlets and have alternating flood and ebb sand morphologies (Fitzgerald et al, 2010). Wave orbital velocity, resulting shear stress from waves and currents, and grain size are important equilibrium factors in maintaining the depth and width of an inlet system (Gerritsen et al., 2003) and in determining distribution of sediments. Mowat and Bundy (2001) identified the north portion of Bayou St. John is dominated by sands and the southern portion is dominated by silts and clays corresponding to decreasing transport energy.
The majority of sediment in Bayou St. John and in Lake Pontchartrain are composed of silts and clays (Flocks et al., 2009), which generally contain large amounts of organic content, PAH, and metals (Mowat and Bundy, 2001). Resuspension of this material has the potential to negatively impact the local ecology. Once the sediment is suspended, transport distance is related to the viscosity of the water and the size of the sediment grain (Cheng, 1997) in conjunction with the forcing of the current (Glenn and Grant, 1987). Erosional properties of benthic materials are difficult to predict and direct measurement of these properties is outside the scope of this study. However, experiments conducted with SEDFLUME on poorly consolidated organic cores can be used as a guideline for probable erosional response to increased bed shear stress (McNeil et al., 1996). Additional data are available from Haralampides (2000) where the critical shear stress of Lake Pontchartrain bottom sediments was approximately 0.1 N/m2 with an average porosity of 0.8.
Sediment burial rate is negligible due to a low sediment accumulation rate and heavy bioturbation normally associated with Lake Pontchartrain benthic communities (Flocks et al., 2009).
Key Hypotheses
Hypothesis 1:The increased tidal mixing in Bayou St. John resulting from the removal of the “waterfall” structure will increase flushing, which will cause temperature and salinity values to more closely follow Lake Pontchartrain values.
Hypothesis 2: Removal of the “waterfall” structure will increase bottom shear stress leading to sediment resuspension, which will redistribute contaminated sediment in Bayou St. John.
Scientific Questions
The specific scientific questions to be answered in this study are:
1. How much energy is lost between Lake Pontchartrain and Bayou St. John? 2. How much energy will be recovered from removing the waterfall structure? 3. How will the energy recovered from the removal of the structure affect water
elevations within Bayou St. John?
4. Will temperature and salinity gradients mimic Lake Pontchartrain in response to increased flow and resulting exchange from the Lake?
Objectives
The specific objectives of this study are as follows:
1. Develop a model to predict flow and water elevations between Lake Pontchartrain and Bayou St. John through the anthropogenic control structures.
2. Develop and calibrate a model to characterize the current hydrodynamics inside Bayou St. John.
3. Apply the different flow inputs to the model to identify possible changes in flow characteristics, primarily water elevation, shear stress, temperature, and salinity.
a. Flow when the waterfall structure is removed with the sector gates closed. b. Flow if the sector gates remain open and the waterfall structure is removed. c. Flow if the sector gates are opened with the waterfall structure in‐place
4. Use shear stress calculated by the model to analyze the potential for sediment resuspension in Bayou St. John.
5. Analyze the resultant flushing and tidal mixing with respect to salinity and temperature.
Chapter 2. Study Area and Significance
New Orleans and Lake Pontchartrain
New Orleans and the surrounding area receive approximately 61 inches of rain annually with an average temperature of 25.33°C in the summer and 14.78°C in the winter resulting in a humid, subtropical climate. Winds are seasonal with northwest winds dominating in the winter and southeast winds dominating in the summer. The average evaporation, estimated with pan evaporation, varies greatly by month (Fontenot, 2004) due to changes in temperature and
humidity. Lake Pontchartrain is a brackish estuarine Lake that is approximately 1,630 km2. During
the winter, from approximately November to April, cold fronts periodically come across Lake Pontchartrain resulting in a hydrologic set‐up at the connection of Bayou St. John to Lake Pontchartrain accompanied by precipitation and storm water runoff. The predictable nature of these storms generally triggers a response from the New Orleans Sewerage and Water Board to drain the Bayou and close the sector gates for an undetermined length of time to prevent excessive water elevations.
Bayou St. John
Bayou St. John is a brackish, natural water body that lies on the eastern side of City Park in New Orleans, LA (Figure 1). The Bayou receives water from Lake Pontchartrain from the north and this process is the primary driver for water level fluctuations in the Bayou. Anthropogenic
operations in the inlet and within Bayou St. John control the range of water elevations locally to prevent flooding of surrounding neighborhoods. The geometry of the Bayou, and the location of these extraction locations from operations, separate the Bayou into two distinct hydrologic sections: the inlet near the north end of the Bayou, and the Bayou itself.
Inlet
E. Lee blvd (Brogan, 2010; LPBF, 2006; Ward, 1982). The sector gates remain closed, however there are two sluice gates covered by a wire mesh on either side that allow water to enter the concrete channel even when the gates are at the closed position (Brogan, 2010). The waterfall structure is a dam containing three culverts equipped with butterfly valves. Two of these culverts are 1.5 m in diameter and one is 0.5 m in diameter (Ward, 1982). The culverts are presumably partially blocked with only two pipes open at approximately 1.5 and 0.6 m respectively (Brogan, 2010).
Bayou
Bayou St John is approximately 6 km long and varies in width from 210 m at its widest point to 61m wide further inland. Figure 1 shows the location of associated internal water control
structures. Martinez et al. (2008) completed a partial hydrographic survey, which provides enough information to extrapolate the missing segments for this study. From this dataset the average water depth of the Bayou is approximately 2.5 m. Several internal water control structures regulate the water elevation of Bayou St. John. A gravity weir and two storm water pumps are used to
extract water from Bayou St. John into small ponds located within City Park (LPBF, 2006). Two additional manual valves are located south of I‐610 operated by the New Orleans Sewerage and Water Board to lower water levels in the Bayou. However the discharge from these locations is assumed to have minimal impact on the flow dynamics of the Bayou. Bayou St. John has 12 bridges, one walkway, and a railroad traversing its length, all of which create localized constrictions.
Historical Trends in Bayou St. John
Water quality parameters are characteristics of the water column that change in response to outside forces such as climate and precipitation. The LSU Agricultural Center has a historical database that captures the variability in water characteristics in Bayou St. John. Table 1 shows the range and average temperature, salinity, conductivity, depth, and dissolved oxygen recorded by the LSU Agricultural multi‐parameter sondes in 2009 and 2010.
Lake Pontchartrain supplies brackish water to Bayou St. John through the inlet. In general, Lake Pontchartrain receives salt water from the Gulf of Mexico through Lake Borgne, and receives
through tidal mixing with its connection to the Gulf. Bayou St. John also follows this trend (Table 1). At the north end of Bayou St. John, salinities are near 6 ppt in August and between 3 to 4 ppt in December. The observed salinity in the central section of the Bayou and towards the south end, show decreased salinity from August to December 2009, which may be attributed to an intermittent connection with Lake Pontchartrain and an increase in precipitation and associated run‐off during cold fronts.
Table 1. LSUAgricultural Center Historical Data Summary for Bayou St. John (2009‐2010)
Temperature °C Sp. Conductivity Salinity ppt Depth ft % D.O. D.O. mg/L North Bayou St. John August to December 2009
Maximum 29.72 11.15 6.36 8.48 105.20 8.97 Minimum 11.43 6.27 3.44 5.48 28.61 2.17 Average 21.65 9.59 5.39 7.19 65.20 5.76 South Bayou St. John August to December 2009
Maximum 34.25 9.84 5.49 10.28 105.51 10.47 Minimum 5.51 2.99 1.54 4.97 34.82 2.74 Average 23.34 5.24 2.83 8.28 68.10 5.90 Middle Bayou St. John August to December 2009
Maximum 30.65 9.6 5.36 9.52 102.53 Minimum 11.35 6.27 3.44 1.89 65.81 Average 21.85 8.35 4.66 7.16 88.12 Middle Bayou St. John January to June 2010
Maximum 33.36 6.47 3.54 8.66 97.85 11.55
Minimum 5.64 3.71 1.93 6.88 57.08 4.11 Average 20.88 4.89 2.62 7.95 80.50 7.38
The average water temperature in Bayou St. John in 2009 was approximately 20°C with a range from 34°C in the summer to 5°C in the winter. The southern end of Bayou St. John is narrower and not as deep as the north, and has less access to Lake Pontchartrain, which is effectively a large heat sink. This allows the temperatures at the south end of Bayou St. John to vary more rapidly than the temperature in the north. This data correlates with the salinity data showing the southern end of Bayou St. John is less buffered from environmental factors than the north.
middle of the Bayou had the largest range in water surface or depth above the sensor, however the average depth measured at all three locations was fairly similar between 2 and 2.5 m.
Dissolved oxygen concentrations vary from 8.97 mg/L in the north to above 11 mg/L in the south. A second data set shows the dissolved oxygen levels within Bayou St. John are general aerobic with observed values between 4 and 7 mg DO/L depending on the depth sampled (Smith 2011, unpublished data), which is an acceptable range for a natural waterway. Dissolved oxygen levels were not observed to have large fluctuations between the north and south Bayou.
Chapter 3. Methods
Field Studies
Objective of Field Studies
The purpose of the field studies was to characterize the physical and chemical properties of Bayou St. John that is not present or not described in previous datasets or studies, and provide data to aid in the development of boundary conditions and in the calibration of numerical models. Specifically, synchronous fluctuations in water surface at various locations along the length of the Bayou, accompanied by temperature and salinity data, collected using moored deployments were required for initial model conditions. Deployment in the inlet provided inflow data upstream of the waterfall structure for analysis of water surface elevations dominated by Lake Pontchartrain forcing and floodgate control. Deployments within the Bayou were used to calibrate the numerical model with respect to water surface elevation in order to analyze the hydrologic characteristics of Bayou St. John. Sediment characteristics derived from analysis of grab samples were conducted to supplement previous geophysical data reported by Mowat and Bundy (2001) to determine the potential for sediment redistribution.
Sediment samples were collected on December 6, 2011. The continuous water monitoring data were collected from December 10, 2010 to January 8, 2011 to capture a series of cold front storm events. These storms provided a large contrast in water elevation and also signify events where anthropogenic controls would be activated. Data collected during the field studies and from data reviews were later used as input to a numerical model to develop a generalized representation of Bayou St. John predicting general hydrologic relationships of temperature, salinity, and water elevation as well as predictive shear stress based on various inflow scenarios.
Field Methods
Pressure, temperature, and salinity variability were continuously monitored using three multi‐ parameter sondes model YSI 6600. The height of each sonde was measured from the depth sensor to the base of the mooring and used to calculate the total depth from pressure readings. One sonde was deployed at a mid‐point between the floodgates and the waterfall structure in the inlet
(33.25°N, 78.14°E) and the depth sensor was positioned 0.31 m above the bed. A second sonde was deployed just south of the waterfall structure (33.25°N, 78.13°E) and the depth sensor was
positioned 0.28 m above the bed. A third sonde was deployed near the first set of SWB control valves (33.21°N, 78.11°E) and was positioned 0.33 m above the bed. The sondes were attached to weighted stands and placed towards the middle of the channel in each respective location. Each YSI sonde was equipped with probes for temperature, specific conductivity, conductivity, total
dissolved solids, turbidity, salinity, and pressure. Discrete samples were collected every 10
minutes. The sondes were deployed from 12‐11‐2010 to 1‐8‐2011. The recorded dataset was used as input and validation for numerical modeling and to analyze the hydrologic characteristics of the Bayou.
Currents in Bayou St. John were obtained using a Nortek Aquadopp, 3‐D acoustic Doppler current meter. The Aquadopp acoustic meter was in an inverted position (northeast, southwest, down) facing upstream (northeast) and collected single point samples every 6 minutes. The instrument samples at 2 MHz for 2 minutes every 6 minutes and reports an average velocity resulting from that burst. The Aquadopp meter was attached to a weighted stand opposite the YSI 6600 sonde located just south of the waterfall structure (33.25°N, 78.13°E) and collected data from 12‐11‐2010 to 12‐20‐2010.
Water surface elevations (relative to a common datum) of each field station were established using a Magellan dual magnitude GPS base station and receiver. The vertical accuracy of the base station is 0.020m and the horizontal accuracy is 1.5mm (0.0049 ft) over a distance of up to 1,500 m; this is approximately 3 mm over a 1km survey distance. These elevations were collected while YSI sondes were deployed in the Bayou to provide a direct correlation between water elevation and depth. Using measured elevations collected using DGPS and survey methods, the recorded pressures were converted to a unified and common datum (NAVD 88). This water surface
adjustment ensured that all data collected were referenced to the same datum, in order to obtain a direct measure of energy through the constricted section, and to better describe the dynamics of the Bayou.
by the US Army Corps of Engineers at two pumping stations located at London Avenue Canal and Orleans Outfall Canal that are juxtaposed on either side of the inlet to Bayou St. John
(www.rivergages.com). Wind direction, wind speed (m/s), temperature (C), salinity (ppt), and pressure (mb) affecting Lake Pontchartrain during the field studies was collected from a weather station site monitored by the Louisiana Universities Marine Consortium (www.lumcon.edu). The LSU Agricultural Center has three continuous monitoring stations in the Bayou that collect depth, temperature, pressure, salinity, specific conductivity, and dissolved oxygen approximately every half hour. These data are available at:
http://www.ysieconet.com/public/WebUI/Default.aspx?hidCustomerID=200. Another
deployment to qualify water level dynamics over time was conducted by Schindler (2009), where an attempt to correlate changes in water levels, temperature, and salinity to wind and precipitation patterns over a two‐month period. To date, no further analysis has been completed using either data set to study a dynamic response of the Bayou to similar events.
Numerical Modeling
Hydrodynamic models were used to understand the tidal mixing and potential changes in shear stress in Bayou St. John related to changes made at the inlet. To reduce complexity near model boundaries and to overcome model limitations, a 1‐D energy‐equation with minor losses was used to relate the corresponding water level changes across the restricted zone from the floodgates to the culverts. The interior of Bayou St. John will be modeled using a three‐dimensional
hydrodynamic model with a computational grid starting at the waterfall structure and
encompassing the geometric and bathymetric variability of the Bayou. Bridges are represented as localized restrictions to flow. The model will be driven by results from either the 1‐D equations or by observed field water elevations and by meteorological forcing (wind stress, heat flux,
precipitation and evaporation). Table 2 summarizes the model simulations and the objective of each simulation. Specifics regarding the model and simulations are discussed in Chapter 4. Model results were calibrated and validated using the field data collected at the moored locations.
Model Skill Assessment Several statistical methods were used to compare the time dependent datasets between observed and predicted values. The predicted values from the 1‐D model are all scalar and therefore can be directly compared or correlated. Additional statistical methods were used to compare model results to observations. The root mean error (RME), root mean square error (RMSE), and index of agreement (d) (Willmott et al., 1985) compare observed (O) time dependent values to the predicted (P) values of the model then return an average fit value. For RME and RMSE, a value close to 0.0 indicates a good fit. The value of RME and RMSE will give an indication of deviation between observed and predicted values. The index of agreement measures the amount of agreement between time dependent responses. A d value closer to 1.0 indicates a better fit. The equations used have the following form: (1) (2) Table 2. Simulation table describing model scenarios, objectives, input details, and numerical methods for hydrodynamic modeling.
Simulation Objective Details Methods
1. Calibration Characterize the present day hydrodynamics in Bayou St. John Forced with 1‐D model using restricted zone field data 1‐D model ECOMSED 2. Opening flood gates with waterfall in place Characterize aspects of the
waterfall structure Forced with 1‐D model using Lake Pontchartrain field data 1‐D model ECOMSED 3. Removing waterfall with sector gates closed Characterize the anticipated
future hydrodynamics Forced with restricted zone field data Field Data ECOMSED
4. Open inlet‐ no
restrictions Characterize the potential water elevations of an unprotected Bayou
Forced with Lake
(3)
The model skill assessment used temperature, salinity, and water elevations at the north and south field observations sampled by the deployments. Additionally, a transect was extracted across the width of the Bayou at each of the listed locations in Table 3. The transects for each of these locations are shown in Figure 2 as panels. Table 3 describes the transect locations, discrete time segment the transects represent, and number of equidistant points extracted from the model along each transect. Field data were statistically compared to predicted values.
Table 3.Transect description including location, time segment, and number of points
Name Transect Location Time at which analysis was carried out
(model simulation hour) Number of points across Bayou width
A. North Transect 40, 80, 180 20
B.
Mid Transect 40, 80, 180 20
C. South Transects 40, 80, 180 20
Hydrologic Analysis of Simulations
Results from the hydrodynamic model simulations were analyzed for changes in free water surface elevation, shear stress, bottom and surface temperature, bottom and surface salinity, mixing, and tidal flow. Tidal exchange flow and mixing potential were assessed at three locations in the Bayou as described in Table 3 for instantaneous averages and as time dependent variables at the same locations. Mixing was evaluated by assessing the potential for the Bayou to produce stratification based on surface to bottom salinity and temperature gradients. The bulk Richardson number (RiL) approximates the impact of freshwater induced buoyancy on mixing. For this study
the formulation of RiL suggested by Uncles and Stephens (2011) was used and has the following form:
(4)
where ρ is the density of water, Δρ is the density gradient, h is the local water depth, and U is the depth‐averaged velocity at that location.
€
ρ − ρ
o=
−
a T
(
−
T
o)
+
b S
(
−
S
o)
+
k
p (5)where the temperature constant is 0.15 kg/m3 per °C, the salinity constant is 0.78 kg/m3
per ppt, the density constant is 4.5x10‐3 kg/m3 per decibar, initial density is 1027 kg/m3, initial
temperature is 10°C, and initial salinity is 35 psu. Instantaneous model predictions for temperature and salinity were used. The pressure effect on density was ignored in the evaluation of density given the shallow nature of the Bayou.
Tidal exchange flow was characterized by analyzing each transect described in Table 3 for instantaneous velocity and flow. Local velocity is calculated by the hydrodynamic model and flow is derived by integration of the velocity field over the area of the transect. Additionally,
instantaneous flow, bulk Richardson number, and shear stress were also evaluated at these locations as time dependent variables. A loss of velocity or flow indicates mixing limitations from Lake Pontchartrain into Bayou St. John and within Bayou St. John from north to south.
Shear stress was evaluated at each transect described in Table 3 to determine the maximum value achieved as a result of changes made to the inlet of Bayou St. John and during sensitivity testing. A critical value of 0.1 N/m2 (Haralampides, 2000) was used to evaluate the potential for
sediment resuspension. The drag coefficient, Cd, is based on streamflow alone and was set at 0.01
after Mariotti et al. (2010). Density was calculated as an average using predicted salinity and temperature values at each location using an equation of state. The shear stress equation has the form of:
€
τ
b=
ρ
C
dV
2 (6)Chapter 4. Numerical Modeling
Description of 1D Numerical Methods:
Flow entering Bayou St. John from Lake Pontchartrain is complex due to multiple changes in channel size and flood control structures. To reduce complexity of the final hydrodynamic model of Bayou St. John, this upstream segment was simplified by treating the water fall structure as a boundary defined by a series of one‐dimensional equations driven with field data collected upstream of the waterfall structure. The 1‐D model assumes the stream‐wise flow in the inlet is balanced by a non‐linear bottom friction, which is a good approximation for long inlets as seen in Bayou St. John (Hench et al., 2002). The time period considered for the 1‐D model captures a cold front induced amplitude in water elevation and maintains Lake Pontchartrain water elevations above the inlet and inlet water elevations above Bayou St. John. Stream‐flow equations were used to characterize energy losses through the inlet during this time period. The geometry of the upstream segment of Bayou St. John along with a description of variables used in the one‐
dimensional model is available in Figure 3. Lake Pontchartrain and associated variables are termed Zone 1. The restricted zone, termed Zone 2, refers to the segment of flow through the concrete channel leading to Bayou Saint John located downstream of the sector gates and upstream of the waterfall structure. Zone 3 covers an expansion in the restricted zone channel immediately upstream of the waterfall structure. Flow through the culverts in the waterfall structure is associated with Zone P and Zone 4 is Bayou St. John.
Flow into the restricted zone from Lake Pontchartrain is unknown due to several
complicating variables. The flow from Lake Pontchartrain crosses a mobile sand bar, a transition in channel size, and flows through sluice gates as part of the sector gates structure located near the mouth of the inlet. The mobility of the sand bar and operation of the sector gates is difficult to predict and introduces unnecessary complication to the proposed model and difficulty in
entering the restricted zone and greatly decrease ability of wind to directly impact water in the restricted zone. These considerations among others prevent the one‐dimensional model from accurately predicting the water surface elevation in the restricted zone using Lake Pontchartrain water surface elevations. Therefore the assumption is made that the water surface elevation inside the restricted zone will emulate the water elevation of Lake Pontchartrain if the sector gates are opened, i.e. frictional dissipation is assumed to be small relative to that presently imposed by water control structures. Flow in the restricted zone between the sector gates and the waterfall structure is determined by gravity driven flow from Lake Pontchartrain and can be determined using Manning’s equation.
Q=(1/n) AR ⅔S
o½ (7)
Manning’s n is set at 0.025 from a roughness table (rubble in cement) (Roberson et al., 1988). The slope is assumed to be very small, 0.0002, from Lake Pontchartrain to Bayou St. John. Field data water surface elevations inside the restricted zone were used as the boundary condition of the 1‐D model to calibrate the culvert constants in the waterfall structure. The restricted zone expands in a wedge transition immediately upstream of the waterfall structure. The continuity equation can be used to determine the velocity within the transition zone.
V2A2 = V3A3 (8)
To determine the water surface elevation immediately upstream of the culverts the transition equation can be used replacing head loss with an expansion term: €
α
2 V2 22g +z2=
α
3 V32
2g+z3+Ke V2
2
+V3 2
2g (9)
The two unblocked culverts are both 1.5 m in diameter and 6.3 m long. Both culverts are blocked by butterfly valves that are rusted closed at different angles. The head loss through the culverts can be equated to the water surface elevation change across the waterfall structure:
z
3−
z
4=
0.5
V
P2
2
g
+
V
P22
g
+
K
LV
P22
g
+
L
Pn
D
5 / 3
2KL is a friction term that takes the butterfly valves into account. The KL value can range
from below 1 to above 300 based on the degree that the valve is closed (Chaiworapeuk, 2007). D is the diameter of the culverts.
From this series of one‐dimensional equations the water surface elevation of Bayou St. John and the velocity exiting the waterfall culverts can be determined using the water surface elevation just inside the sector gates.
Figure 3. Schematic representation of the inlet into Bayou St. John detailing both anthropogenic structures, local geometry of the channel, and constants determined through field methods and calibration of the 1‐D model.
Description of ECOMSED
The model selected to assess circulation within Bayou St. John is the Estuarine, Coastal and Ocean Modeling System with Sediments (ECOMSED) developed within Hydroqual Inc. from an earlier form originally developed by Blumberg and Mellor (1987). The Estuarine, Coastal, and Ocean Model with Sediment (ECOMSED) is a three dimensional model that has previously been used to model several physical aspects of circulation within Lake Pontchartrain including wind‐ driven circulation without buoyancy forcing (Signell and List, 1997), fate and transport of pathogenic organisms in the north and south shores of the Lake (Chilmakuri 2005), and to study cohesive sediment dynamics with spatial variability in response to frontal weather using satellite moderate spectrometer data (Georgiou et al.2007). For additional examples outside Lake
Pontchartrain, refer to the ECOMSED manual (Hydroqual, 2002).