in the population sciences published by the Max Planck Institute for Demographic Research Konrad-Zuse Str. 1, D-18057 Rostock · GERMANY www.demographic-research.org
DEMOGRAPHIC RESEARCH
VOLUME 21, ARTICLE 27 PAGES 803-842
PUBLISHED 04 DECEMBER 2009
http://www.demographic-research.org/Volumes/Vol21/27/ DOI: 10.4054/DemRes.2009.21.27
Research Article
Regional child care availability
and fertility decisions in Spain
Pau Baizán
© 2009 Pau Baizán.
This open-access work is published under the terms of the Creative Commons Attribution NonCommercial License 2.0 Germany, which permits use, reproduction & distribution in any medium for non-commercial purposes, provided the original author(s) and source are given credit.
1 Introduction 804
2 Fertility and childcare 805
3 Childcare system 813
4 Data sources and methods 815
5 Results 823
6 Conclusion 829
7 Acknowledgments 831
References 832
Regional child care availability and fertility decisions in Spain
Pau Baizán1
Abstract
In this paper I explore two hypotheses: (1) Formal childcare availability for children under 3 has a positive effect on fertility; and (2) Formal childcare availability has different effects across contexts, according to the degree of adaptation of social institutions to changes in gender roles. Event history models with regional fixed effects are applied to data from the European Community Household Panel (1994-2001). The results show a significant and positive effect of regional day care availability on both first and higher order births, while results are consistent with the second hypothesis only for second or higher order births.
1 ICREA and Universitat Pompeu Fabra, Department of Political and Social Sciences. C/25 Ramon Trias
1. Introduction
A growing body of research points to the crucial role of the social context, and in particular certain institutions such as parental leave policies, labor market arrangements, and access to affordable childcare, in allowing the combination of childrearing and employment. The Spanish context is characterized not only by low day care availability overall, but also by important regional differentials in fertility and female labor force participation. Furthermore, during the last few decades, labor force participation of women and the proportion of children under 3 in childcare have increased substantially, while fertility has shown only small increases at the aggregate level since the mid-1990s.
The specification of relationships between these variables form the core of the existing theoretical arguments that support the hypothesis that childcare availability has a positive effect on fertility, since day care is presumed to influence principally through reducing the conflict between labor force participation and childrearing (e.g. Ermisch 1989; Bernhardt 1993). In spite of well-founded theoretical arguments, previous empirical studies focusing on the association between availability of childcare services and fertility have provided inconsistent findings (e.g. Kravdal 1996; Hank and Kreyenfeld 2003; Andersson, Duvander, and Hank, 2004; Del Boca 2002; Rindfuss et al. 2007). According to Rindfuss et al. (2007), these mixed findings may be due to the false assumption that childcare is an exogenous variable with respect to fertility. Yet the coverage rate of day care may to a certain degree be endogenous to fertility and other (unobserved) characteristics of a given place, such as particular values, income, or labor force participation. This may be particularly the case in countries, such as Spain, with large regional variations in fertility, female employment rate, and day care coverage for children under 3 (in Spain, some regions have provisions of less than 5%, while others have currently reached nearly 45%). This study’s focus is on the years 1993-2000, a period in which enrolment between ages 3 and 5 were essentially universal, while the coverage rate for children under 3 was (and still is) very heterogeneous at the regional level, and where enrolment for the latter age group increased rapidly in some regions, in connection with particular regional policies.
2. Fertility and childcare
Different theoretical perspectives, including those of welfare regimes perspectives, neoclassic economics, and theories of cultural norms and individual values, offer insight into the link between childcare and fertility. A brief discussion of some key arguments of these approaches may be useful to evaluate how childcare availability can be related to fertility, and particularly in which situations it may matter most. As will be explained, all these theoretical perspectives basically lead to the hypothesis that an increased level of regional availability of childcare should lead to higher fertility at the individual level.
Research on the impact of welfare regimes on individual life courses state that institutional variation provides an explanation for cross-country variations in the relationship between women labor force attachment and fertility (Esping-Andersen 1999; Mayer, 2001). They point to the important mediating effects of the availability of childcare, among other variables, in explaining such cross-national variation. This institutional feature is part of a larger “regime” of welfare, in which different elements do not vary randomly, but form part of qualitatively different systems of welfare. Individual countries cluster in each of the regimes. Thus, a characteristic of the “conservative” welfare states, in particular the Southern European version of this type of welfare state2, is their “familialism”, consisting in the internalization of welfare
responsibilities by families (Orloff 1996; Saraceno 1996). Apart from the important exceptions of the health care and educational systems, the welfare state is largely an income-transfer system, and is only marginally dedicated to provide services to families. This kind of welfare state basically assumes that married women are housewives who can care for their children, and thus provide little support in the form of public funding for childcare. In fact, the existing public childcare services are mainly considered to serve educational purposes and only to provide childcare as a secondary goal (Eurostat 2002). These Southern European welfare regimes also have a strongly regulated labor market that focuses its support in a “family wage” and creates several impediments to part-time jobs.
However, several of these prototypical characteristics of the Southern European welfare state have eroded considerably in Spain in the last few decades. Several reforms have taken place, including a partial de-regulation of the labor market, an increase in social services, changes in family policy (e.g. an increase in family benefits, extension of parental leave), and an important expansion of the childcare system (see below) (de Polavieja 2003; Arriba and Moreno 2005; Azmat and González 2008).
2 One could argue that these welfare regimes are partially the outcome of long standing cultural patterns and
Nevertheless, there is substantial variation among different regions regarding some of these changes, partly related with the political decentralization of the country.
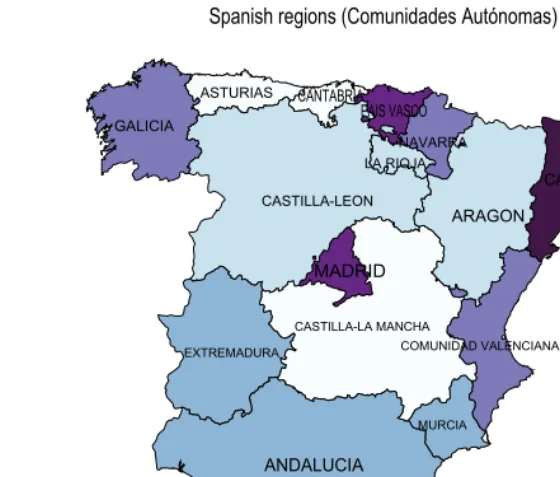
Parallel to the above, an important increase in labor force participation of women has taken place, in particular of those with small children (Figures 1 and 2). Current proportions are close to those prevalent throughout west European countries, with the particularity that the large majority of jobs are full time, including the jobs of mothers (Rubery, Smith, and Fagan 1999). Cross-country comparisons have found that an institutional adaptation to the higher labor force participation of mothers is the expansion of (formal) non-parental childcare. There are signs of a similar evolution in Spain, as larger increases in childcare coverage have taken place in regions with high participation rates for women. Furthermore, the highest increases in total fertility rate have taken place in regions with a relatively high female participation rate (Figure 3)3.
As is known, Spanish TFR reached its lowest level in 1998 (1.16) and eventually this indicator recovered up to 1.39 in 2007 (Figure 6). The largest increases during the 1990s and early 2000s took place in areas that previously had the lowest fertility rates, already late age fertility patterns, and better economic performance.
Figure 1: Women’s labor force rate (age 25-49) by number of children and age of the youngest child in Spain and the EU-12 (1987-2005)
50 52 54 56 58 60 62 64 66 68 70 72 74 76 78 80 82 84 86 88 90
1987 1988 19891990 1991 1992 1993 1994 1995 1996 1997 1998 1999 2000 2001 2002 2003 2004 2005
%
Spain (no children) Spain (a child of age 0-2 )
EU-12 no children EU-12 (a child of age 0-2)
Source: Data from Labor Force Surveys, Eurostat, second trimesters (http://epp.eurostat.ec.europa.eu/; at 18/10/2006). EU-12 includes Belgium, Denmark, Germany, Greece, Spain, France, Ireland, Italy, Luxembourg, the Netherlands, Portugal and the United Kingdom.
Figure 2: Women’s labor force participation (age 16-64), in 2000
ASTURIAS CANTABRIA PAIS VASCO
ARAGON
LA RIOJA
CASTILLA-LA MANCHA
EXTREMADURA
MURCIA
ANDALUCIA
BALEARES
CANARIAS GALICIA
CASTILLA-LEON
MADRID
COMUNIDAD VALENCIANA
NAVARRA
CATALUNYA Spanish regions (Comunidades Autónomas)
33.75 - 36.19 36.19 - 38.03 38.03 - 41.15 41.15 - 42.12 42.12 - 46.32 46.32 - 48.24
Source: Instituto Nacional de Estadística, 2009
Figure 3: Change in TFR and female labor force participation in Spanish regions
40 45 50 55 60 65 70
-0.15 -0.05 0.05 0.15 0.25 0.35
change in TFR 1995-2005
L
F
P
i
n
2005
Source: Data from the Instituto Nacional de Estadística, 2008 (www.ine.es).
Figure 4: Change in TFR and formal childcare coverage in Spanish regions
0 5 10 15 20 25 30 35 40 45 50
-0.15 -0.05 0.05 0.15 0.25 0.35
change in TFR 1995-2005
ch
il
d
care i
n
20
05
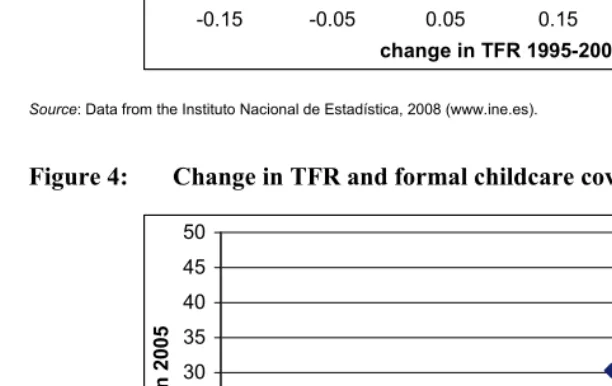
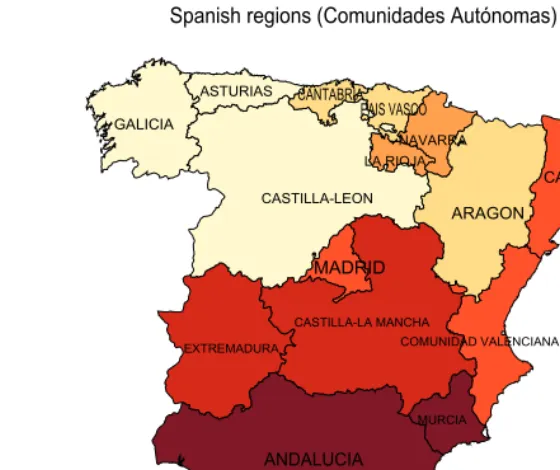
Figure 5: Proportion of children 0-2 enrolled in formal childcare, 2000
ASTURIAS CANTABRIA
PAIS VASCO
ARAGON
LA RIOJA
CASTILLA-LA MANCHA
EXTREMADURA
MURCIA
ANDALUCIA
BALEARES
CANARIAS GALICIA
CASTILLA-LEON
MADRID
COMUNIDAD VALENCIANA
NAVARRA
CATALUNYA Spanish regions (Comunidades Autónomas)
,
0.9 - 1.9 1.9 - 2.6 2.6 - 5 5 - 11.8 11.8 - 21.3 21.3 - 26.6
Source: Spanish Ministry of Education (2008)
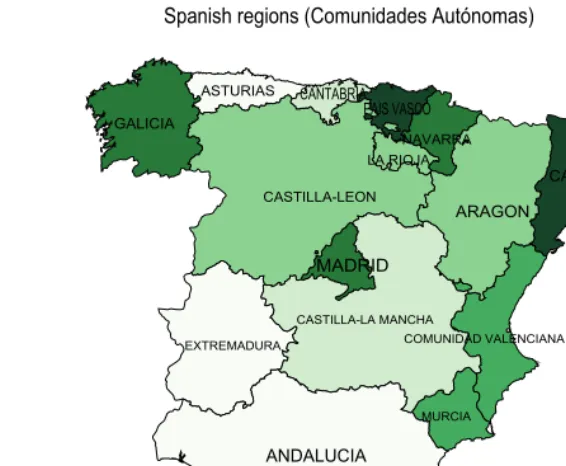
Figure 6: Total fertility rate in 2000
ASTURIAS CANTABRIA
PAIS VASCO
ARAGON
LA RIOJA
CASTILLA-LA MANCHA
EXTREMADURA
MURCIA
ANDALUCIA
BALEARES
CANARIAS GALICIA
CASTILLA-LEON
MADRID
COMUNIDAD VALENCIANA
NAVARRA
CATALUNYA Spanish regions (Comunidades Autónomas)
0.861 - 1.039 1.039 - 1.156 1.156 - 1.254 1.254 - 1.287 1.287 - 1.355 1.355 - 1.474
Source: Instituto Nacional de Estadística (200)
unemployment benefits, the ease with which women return to the labor market after an interruption, or the availability of protected public employment (Aaberge, Colombino, and Del Boca 2005; Baizán 2007). Therefore, the interactions between policies and between policies and particular structural contexts should be considered. The opportunity costs of childbearing will be greater where social institutions do not facilitate the combination of parental and worker roles. These differences may be an important part of the explanation of the fertility differentials between southern European countries and the Nordic countries (Kohler, Billari, and Ortega 2006). By the same token, differences in social institutions and policies may by relevant in explaining regional differences in Spain.
In particular, the availability of subsidized childcare should influence participation and fertility decisions, by reducing potential wage losses and earnings depreciation. At the same time, childcare availability may induce some women to enter (or remain) in the labor market; and being in the labor market could lead to a reduction of their fertility. But for a majority of young women already present in the labor market, as is the case in most European countries, affordable childcare should lead to an increase of their fertility. Other things being equal, the overall effect on fertility of the availability of non mother childcare will depend on the proportion of women in the labor market: if a majority of women participate, its aggregate effect should be to increase fertility. In addition, an increase in labor force participation of women will reduce the available pool of informal caregivers in a society, further exacerbating the childcare deficit. Therefore, when a majority of women in a society participate in the labor market, formal day care will enhance the compatibility between paid work and childrearing.
Furthermore, if men and women’s family values and attitudes about gender roles shape fertility behavior (Bernhardt and Goldscheider 2006), then these are themselves closely linked to the prevalent care regime and gender arrangements (Pfau-Effinger 2004; Bettio and Plantenga 2004; Lewis 1998). This suggests that the percentage of children in day care may be correlated to other contextual variables, such as labor force participation, norms on the acceptability of childcare by non relatives and family obligations (e.g. a grandmother’s obligations towards her grandchildren), gender equality norms, or the degree of flexibility in working time arrangements. In a context of difficult compatibility between labor force participation and childrearing, like that which has been prevalent in Spain in the last few decades, increases in labor force participation may lead to postponement and reduction of childbearing. But the continued expansion of the availability of formal childcare (stimulated by the demand created by the increase in participation) reduce this incompatibility, allowing for increases in fertility. In addition, the effect of more women in the labor market may be more important than a simple compositional effect, as it may contribute to changing the norms about care. For instance, if the acceptability of formal childcare for children under 3 in a region is high, fewer women will withdraw from the labor market in connection with maternity and the effect of formal childcare availability will be stronger than in regions lacking this norm. It can be assumed that an extended provision of care facilities has a positive impact on the transition to a birth in regions where it is widely accepted that working mothers send their pre-school children to formal childcare. In regions where social acceptance for formal care arrangements is low, the formal care system is less relevant in individuals’ childbearing decisions.
3. Childcare system
Consistently with the predictions derived from the “welfare regime” perspective, in Spain the coverage of formal childcare services for infants aged less than 3 years is low: only 16.9 % of children aged 0 to 2 years had access to childcare services in 2005, while the corresponding figure for 1993 was 5.2 % (Ministry of Education 2008). In contrast, educational enrolment is close to universal for the 4-5 age group (99.0 % in 1993), while the enrolment ratios for age 3 were 53.0% in 1993 and 98.8% in 2005. The percentage was close to universal by the mid-1990s in several regions. Here these enrolment ratios refer to formal childcare during the official timetables; after school care and non-registered day care centers are not included in the figures. In fact, since 1983, when the Law of Education was issued, day care centers have been progressively included, through established curricula and quality requirements, in the general education system (González López 2003).
Childcare services in pre-primary schools are provided by both public and private sectors. The private sector accounts for 57 % of enrolment for children under 3, while the public sector is largely dominant for the 3-5 age group (69 %). Note, however, that public subsidies contributed to the financing of the private sector to some extent4.
While the quality of publicly provided childcare services is generally high in terms of staff qualifications and child to staff ratio, and parents pay a fraction of the real cost of the services, there are only a limited number of slots available. Furthermore, opening hours of childcare centers in the public sector are typically too limited to combine with a full time job5. It can be argued as well that long and inflexible work timetables in
most jobs are responsible for the mismatch. Characteristics of the childcare provided are much more heterogeneous in the private sector, although opening hours are often longer and parents face higher costs. Parents who cannot access a public childcare slot, either because of long waiting lists or because it is located too far away, may find a private sector slot available of satisfactory quality. Nevertheless, private services might be too expensive for lower income groups and, as is the case for public childcare, its availability is very uneven. Increasing quality requirements may have hindered the expansion of the private sector to a certain extent (González López 2003).
As has been argued for several other European countries with heavily regulated childcare provision, where public provision and subsidizing are important, the availability of childcare should be of crucial importance in fertility decisions, while its
4 In addition, during the 1990s, parents had access to income tax deductions that covered part of the costs of
formal childcare (Azmat and González 2008).
5 Typically, public day care centers open on weekdays, from 9am to 5pm (sometimes from 8am to 6pm),
price may be less so (Hank and Kreyenfeld 2003; Del Boca 2002). Furthermore, some evidence exists that in the context of southern Europe, informal care arrangements predominate (Nicodemo and Waldman 2009). In particular, certain studies point to the crucial role of grandmothers, not only as main providers of non-parental care, but also to supplement formal arrangements during school holidays and to bridge the timetables of parents and children (Fernández Cordón and Tobío Soler 2005).
Table 1: Percentage of children 0-2 enrolled in formal childcare NUTS 1 region or
Autonomous Community
1993 1994 1995 1996 1997 1998 1999 2000 2007
North West 3.41 4.1 4.8 5.5 6.2 6.8 7.6 8.31 16.2
Galicia 4.8 5.8 6.8 7.8 8.8 9.8 10.8 11.8 17.6
Asturias 0.7 0.8 0.7 1.2 1.1 1.1 1.9 1.8 10.5
Cantabria 1.1 1.3 1.5 1.5 1.5 1.5 1.5 1.9 19.2
North East 3.7 5.4 7.3 8.7 9.9 11.2 12.3 13.5 37.0
País Vasco 4.5 7.8 11.6 14.0 16.1 18.3 19.9 21.3 48.1
Navarra 4.7 5.9 7.1 8.3 9.5 10.7 11.9 13.1 27.3
Aragón 2.5 1.9 1.6 1.8 1.6 2.0 2.5 3.3 30.4
Rioja 0.8 2.3 2.3 2.5 2.2 2.1 2.2 2.6 6.4
Center 1.1 1.3 1.2 1.5 1.6 1.7 1.8 2.1 6.4
Castilla y León 1.5 1.7 1.6 1.7 1.7 1.9 2.4 2.9 12.3
Castilla-La M. 1.0 1.0 1.0 1.6 1.8 2.0 1.8 2.1 2.5
Extremadura 0.6 0.9 0.9 1.0 1.1 1.1 1.2 0.9 2.7
Madrid 4.7 5.8 6.3 6.7 7.7 9.6 12.4 13.8 35.8
East 13.8 14.4 14.5 14.9 15.2 15.4 16.0 16.9 24.5
Cataluña 19.9 21.8 23.8 24.5 24.6 25.0 25.5 26.6 33.1
Baleares 2.4 3.1 4.1 4.1 5.4 5.5 5.4 6.5 11.2
C. Valenciana 7.2 5.9 3.1 3.1 3.6 3.5 4.3 5.0 14.6
South 0.7 0.9 1.3 1.4 1.4 1.8 1.8 1.9 8.0
Andalucía 0.6 0.6 0.7 0.7 0.7 0.9 0.9 1.0 6.6
Murcia 1.5 1.5 3.0 5.1 6.0 6.2 7.1 7.7 16.1
Islas Canarias 1.3 1.3 1.5 1.5 1.7 2.4 2.2 2.2 *
Total 5.2 5.5 5.8 6.2 6.6 7.3 8.0 8.9 19.9
Source: Ministry of Education (2009; www.mec.es). Data on each Comunidad Autónoma was grouped, when necessary, into NUTS 1 regions, according to their population of children 0-2. NUTS 1 region refers to the standardized classification of the Statistical Office of European Communities. Since figures for each year were not available for Galicia and Navarra, several data has been interpolated. * not available.
preschool education was 5.2 % in 1993-94, 8.9% in 2000-01 and 19.9% in 2007-086.
Yet, it should be noted that in the regions of the south and the center of Spain (excluding Madrid) the development of day care centers has been very slow (for instance, the coverage rate was 6.6% in Andalusia in 2007-08, while in the Basque Country it reached 48.1% in the same year).
4. Data sources and methods
The individual level data used for the analyses are from the Spanish sample of the European Community Household Panel survey (ECHP). This data source has several features that make it suited for the purposes of the paper, as well as several limitations. The longitudinal design of ECHP makes it possible to follow up and interview the same set of private households and persons over several consecutive years. It thus supplies data on all household members in a dynamic way. The ECHP offers detailed data on fertility and partnership careers, and particularly on the labor market trajectories of each member of the household. For instance, it contains monthly data on labor force status, yearly income of each member of the household, the educational level attained, and health status. The first wave of the survey took place in 1994, and the panel was stopped after the 2001 wave. Although most of the data refers to the wave year or the previous year, the survey also offers a limited amount of retrospective information.
The levels of attrition are similar to those of other panel surveys (Watson 2002; Eurostat 2001). For the Spanish sample, out of an initial sample size of 17893 individuals, 44.7 % are attritors, i.e. individuals who, at a certain wave, left the sample forever, while 10.8 % are returnees (individuals who were missing in one or more intermediate waves and answered later on). However, this rate of attrition would only be problematic if it were correlated with the outcome studied. Several studies have analyzed in detail the nature of attrition in the ECHP with respect to a wide range of variables, including age, sex, income, marital status, number of children, activity status, among others (Watson 2002; Gallo, Mastrovita, and Siciliani 2004). These studies conclude that the impact of attrition on sample structure is small, including the Spanish sample, and that it is not likely to lead to significant bias in the analyses. Although none of these studies focus specifically on fertility, it appears that individuals with children have significantly lower probabilities of dropping out from the panel. These studies also show that married individuals have lower probabilities of attrition, and that individuals living in high income households show somewhat higher probabilities of attrition in Spain. The only characteristic that has a strong impact on attrition is previous
6 The rate of expansion of day care provision may be somewhat overestimated, because of deficiencies in the
geographic mobility of the individual. Nevertheless, geographic mobility in Spain is very low and concerns only a small fraction of the sample7. Using data from the ECHP,
Tatsiramos (2004) estimated that only 0.53 % of individuals in the Spanish sample migrated inter-regionally. Given that the regions studied are relatively large and the fact that an important fraction of inter-regional migration is work-related, it is very unlikely that parents-to-be would migrate to another region just to find a childcare service (if that were the goal of migration, migrating within a region would be much less costly). Therefore, the possible bias arising from the endogeneity of migration with respect to the main variables analyzed in this paper should not significantly affect the results presented here.
For this paper, I studied women born between 1957 and 1978 (i.e. they were between 16 and 42 years of age during the panel years), from January 1993 to December 2000, with at least one valid interview8. This resulted in a sample of 4303
women (11 cases were excluded because no information on the region of residence was available). The analyses were performed on 3080 first birth spells leading to 598 first births. In the case of second and higher order births, only women living in a partnership (marriage or cohabitation) were included, resulting in a sample of 2189 spells (of which 1077 for second births, 891 for third births, and 221 for higher order births), and 545 births. Censoring may occur if: the woman reaches the end of the year 2000; drops-out from the survey; or, for 2nd or higher order births, in case the woman divorces or separates from her partner, whatever comes first. Left censoring is avoided by including the age of the women (for first births) or the age of a previous child in the baseline (for 2nd + births); however, the period before the individual enters the panel is not included
in the computations (Guo 1993).
The dependent variables of the analyses are the transition to a first birth or to a higher order birth. However, I backdate the date of birth by nine months, to approximate as much as possible the conditions of the woman when she decided to have a child, and to avoid reverse causation, i.e. the change in the values of the variables (for instance, labor force status) as a consequence of a pregnancy.
An important independent variable in this study is the woman’s labor force status. I construct this variable using the monthly calendar of activities. These answers indicate the main activity performed by the women each month during the previous calendar year, i.e. student, working in the labor market, unemployed, not in the labor market. A key dimension of the Spanish labor market is the type of job contract, as individuals with a temporary contract suffer a high risk of unemployment. Therefore, a distinction
7 Several studies show that internal migration and residential mobility in Spain is among the lowest in Europe
(Antolin, and Bover1997; OECD 2000; Recaño and Cabré 2003). These rates are particularly low for individuals in a union (married or cohabiting), parents, and homeowners; while they are much higher for the highly educated, and young individuals no longer living in the parental home (Baizán 2002).
was made among the employed individuals according to the type of contract they held (permanent/temporary) or whether they were self-employed (thus, this dimension has to be interpreted together with the “activity status” variable, where the reference category are individuals with a permanent contract). I had also included an indicator for private or public sector, since public sector employees often enjoy work conditions that are more easily compatible with childrearing. However, this was dropped from the final models, as it did not result in significant differences.
The partner’s income level may provide an indication of the capacity of the household to meet the expenses of a newborn, and can be considered as exogenous with respect to fertility (unlike women’s income). The respondents to the ECHP were asked to provide their individual earnings during the calendar year preceding the interview. In order to make answers comparable through time, I deflated the earnings by using International Labor Organization price index information (base year: 1992). And in a second step, I classified the gross incomes into three groups: low (less than 33.3 of the men’s earnings distribution), middle income (from 33.3 to 66.6), and high income (more than 66.6 of the distribution).
The ECHP provides very basic information concerning the level of education, classifying into only three levels: low, corresponding to less than second stage of secondary education (ISCED levels 0-2); higher secondary (ISCED level 3); and tertiary education (ISCED levels 5-7). Moreover, this information was only asked in the first wave the individual entered the panel, and was not updated until 1997. Finally, individual date of birth information allows the creation of the variables “age” and “age of the youngest child”, updated each month.
Crucial to this analysis, the ECHP identifies the individual’s region of residence in each wave. This feature makes it possible to link individual level information with other data sources at the regional level. Unfortunately, information is provided only at a relatively low level of desegregation, i.e. according to the European Union standardized classification of regions, NUTS, at level 1. Sometimes this level corresponds to administrative regions (Comunidad Autónoma), but is more often a grouping of neighboring Autonomous Communities. Seven regions have been studied. The large size of the regions suggests that the actual availability of childcare is heterogeneous across households belonging to the same region9. This also implies that the effects of
childcare will be underestimated statistically (see below).
The regional level indicator of the availability of childcare utilized is the percentage of children 0-2 enrolled in formal day care out of the total children of that age. In most of the models presented below, this variable was measured as a continuous
9 Ideally, one would be able to know the availability of childcare for particular households in geographical
variable; this specification was preferred since the number of regions studied is only seven, and thus a risk of collinearity exists with the values of the childcare levels. Nevertheless, in Model 5 and 6, a categorical specification was tested, with 4 categories: less than 4% of coverage, from 4% to 8%, from 8% to 12%, and 12% or higher. This data was obtained from the Ministry of Education10. This is not an
indicator of availability of childcare strictly speaking, but rather use of childcare; however, as argued in the previous section, since childcare is severely rationed, it is safe to assume that it reflects available day care opportunities in each region. The regional level women’s labor force participation rate was included in some of the analyses, available from the National Institute of Statistics.
The empirical approach uses an event history model with fixed regional effects. Regional dummy variables are included in order to capture time invariant unobserved characteristics at the regional level, such as norms concerning childcare and fertility, and particularly the placement of childcare centers. Furthermore, in a multi-level model with random effects, it would be assumed that the error term is uncorrelated with the percentage of children enrolled in preschools and the other independent variables included (Goldstein 1995; Allison 2005). However, as explained above, the placement of childcare centers may in fact be endogenous to other (unobserved) regional characteristics that also affect fertility, leading to biased estimates (Angeles, Guilkey and Mroz 2005). Therefore, a fixed-effects approach was implemented.
In order to statistically control for the possible effects of selection into a specific birth order, I have used a simultaneous equation approach, in which the equations for first births and second or higher order births have been estimated jointly. The formulation for this hazard model is:
ln hiB1(t) = γ’T(t) i + β’ Xi (t) + εi
ln hjiB2(t) = γ’T(t) ji + β’ Xji (t) + εi
where ln hji (t) is the log of the rate for spell j belonging to individual i at time t for the first births process (B1) and the second or higher order births process (B2) respectively. The effect of duration, denoted by γ’T(t) ji, is measured in months on the hazard rate. Duration dependence is modeled with piecewise linear splines (also known as the Gompertz model or piecewise linear exponential model). Piecewise linear splines are used to approximate continuous functions (such as a baseline hazard or a non-proportional relative risk), by using functions that are linear within each (possibly
10 Data on each Autonomous Community was grouped, when necessary, into NUTS 1 regions, according to
ended) interval. Those linear functions are connected at points in time that are decided a priori: piecewise linear splines are then also continuous functions. Representing a vector of independent (time-varying or fixed) variables is Xji (t), and β denotes the value of the estimated coefficients of the model for every variable. Lastly, I include a random term εi, in order to capture unobserved heterogeneity at the individual level, which is assumed to follow a normal distribution.
A different specification was also performed in order to address the issue of the possible endogeneity of the processes of labor market participation and fertility. Labor market participation decisions may be jointly determined by fertility intentions, for instance as a result of the existence of norms and values concerning labor force participation and family building, and may be related to the extent to which the roles of mother and worker are compatible. In this respect, the strength of the correlation between fertility and participation process could be connected to the incompatibility between them. In contexts where incompatibility is highest, women determine their behavior in the two domains jointly, whereas in contexts with higher compatibility, decisions concerning labor market and fertility may be more independent from one other. Thus, in order to deal with the possible endogeneity of labor force participation and fertility, it is included in a third equation. The additional equation is specified as a logistic regression in which the dependent variable reflects whether the woman is participating or not in the labor market in each of the survey waves. Periods in which the woman is enrolled in education are excluded from the analysis (this exclusion only applies to the last equation that deals with labor force participation).
ln hiB1(t) = γ’T(t) i + β’ Xi (t) + εi
ln hjiB2(t) = γ’T(t) ji + β’ Xji (t) + εi
ln[Pij / (1-Pij)] =α + β’Xij + uij + δi
⎟ ⎟ ⎠ ⎞ ⎜ ⎜ ⎝ ⎛ ⎟⎟ ⎠ ⎞ ⎜⎜ ⎝ ⎛ ⎟ ⎠ ⎞ ⎜ ⎝ ⎛ ⎟ ⎠ ⎞ ⎜ ⎝ ⎛ 2 2 , 0 0 ~ δ εδ εδ ε σ ρ ρ σ δε N
in which ρεδ is the correlation between the unobserved heterogeneity terms of the two processes. The model estimation was performed using full information maximum likelihood, as implemented in the package aML (Lillard and Panis 2003).
As can be seen in the results (Table 4, in Annex), the correlations between the heterogeneity terms obtained are significant. This means that there are indeed selection effects not picked up by the variables included in the models. However, the coefficients obtained are substantively identical to the models that do not include an equation for labor force participation11 for most variables, particularly those concerning the
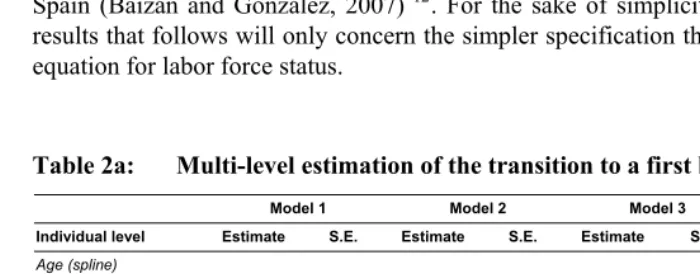
proportion of regional childcare coverage. The main exception is, logically, the labor force status of the women, for which being a housewife loses part of its effect and significance (with respect to being employed). Furthermore, the effect of childcare coverage on labor force participation is positive and significant in all the models computed, with a coefficient of 0.03 (Table 4c in Annex). This result is consistent with the theoretical arguments presented above and with previous empirical evidence for Spain (Baizán and González, 2007) 12. For the sake of simplicity, the presentation of
results that follows will only concern the simpler specification that does not include an equation for labor force status.
Table 2a: Multi-level estimation of the transition to a first birth
Model 1 Model 2 Model 3 Model 4 Individual level Estimate S.E. Estimate S.E. Estimate S.E Estimate S.E
Age (spline)
16-23 0.222 0.047*** 0.108 0.048** 0.102 0.048** 0.099 0.049**
23-28 0.256 0.034*** 0.168 0.035** 0.166 0.035*** 0.166 0.035***
28-32 0.040 0.042 -0.004 0.043 -0.003 0.043 -0.006 0.044
32-36 -0.150 0.072 ** -0.149 0.07** -0.143 0.074* -0.144 0.074*
36+ -0.578 0.223*** -0.592 0.225*** -0.614 0.226*** -0.612 0.227***
Educational level
High -0.043 0.116 0.038 0.119 0.026 0.121 0.023 0.122
Middle (ref.)
Low 0.539 0.109*** 0.261 0.113** 0.257 0.115** 0.265 0.116**
11 The models presented in Table 2 have an identical specification as the models presented in Annex (Table
4), except that these last models include an equation for labor force participation. In this last equation the number of (person/year) observations is 19683 (5687 non active women and 13996 active women). 12 A specification using whether the woman is working or not (instead of labor market activity) as a
Table 2a: (Continued)
Model 1 Model 2 Model 3 Model 4 Individual level Estimate S.E. Estimate S.E. Estimate S.E Estimate S.E
Activity status
Employed (ref.)
Other inactive 0.340 0.132*** 0.407 0.135*** 0.416 0.137***
Student -1.484 0.147*** -1.526 0.149*** -1.539 0.151***
Unemployed -0.433 0.120*** -0.447 0.122*** -0.447 0.123***
Type of contract
Permanent (ref.)
Temporary -0.419 0.154*** -0.428 0.157*** -0.425 0.159***
Self-employed -0.011 0.232 -0.012 0.236 -0.021 0.239
Health status
Good (ref)
Bad -0.786 0.213*** -0.792 0.215*** -0.786 0.217***
Missing -0.344 0.10*** -0.290 0.106*** -0.249 0.112**
Regional level
Childcare(percent) 0.055 0.027 ** 0.073 0.030** 0.029 0.037 0.040 0.039
Women’s labor force (percent)
0.083 0.039**
Region NE (ref.)
NW 0.329 0.180* 0.347 0.185* 0.228 0.196 -0.502 0.588
Madrid 0.017 0.192 -0.058 0.19 -0.262 0.216 -0.460 0.622
Center 0.622 0.253** 0.720 0.277*** 0.836 0.285*** -0.038 0.685
East -0.052 0.230 -0.246 0.238 -0.302 0.243 -3.337 1.681**
South 0.588 0.250** 0.682 0.275** 0.541 0.284 -0.198 0.510
Canary Islands 0.921 0.267*** 1.069 0.287*** 0.566 0.380 0.352 0.732
Childcare*NW 0.129 0.087
Childcare* Madrid 0.044 0.066
Childcare*Center 0.333 0.379
Childcare*East 0.217 0.113*
Childcare*South 0.441 0.264*
Childcare*Canary Is. 0.282 0.374
Constant -6.273 0.410*** -4.562 0.449*** -7.314 1.382*** -4.2340 0.501***
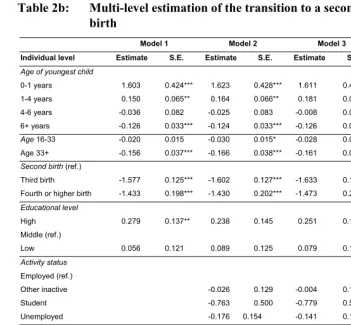
Table 2b: Multi-level estimation of the transition to a second or higher order birth
Model 1 Model 2 Model 3 Model 4 Individual level Estimate S.E. Estimate S.E. Estimate S.E. Estimate S.E.
Age of youngest child
0-1 years 1.603 0.424*** 1.623 0.428*** 1.611 0.429** 1.619 0.432***
1-4 years 0.150 0.065** 0.164 0.066** 0.181 0.067*** 0.183 0.068***
4-6 years -0.036 0.082 -0.025 0.083 -0.008 0.083 -0.004 0.084
6+ years -0.126 0.033*** -0.124 0.033*** -0.126 0.033*** -0.125 0.034***
Age 16-33 -0.020 0.015 -0.030 0.015* -0.028 0.016* -0.029 0.016*
Age 33+ -0.156 0.037*** -0.166 0.038*** -0.161 0.038*** -0.161 0.038***
Second birth (ref.)
Third birth -1.577 0.125*** -1.602 0.127*** -1.633 0.130*** -1.631 0.132***
Fourth or higher birth -1.433 0.198*** -1.430 0.202*** -1.473 0.206*** -1.465 0.210***
Educational level
High 0.279 0.137** 0.238 0.145 0.251 0.148* 0.262 0.150*
Middle (ref.)
Low 0.056 0.121 0.089 0.125 0.079 0.128 0.080 0.129
Activity status
Employed (ref.)
Other inactive -0.026 0.129 -0.004 0.133 0.001 0.136
Student -0.763 0.500 -0.779 0.516 -0.792 0.522
Unemployed -0.176 0.154 -0.141 0.159 -0.142 0.162
Type of contract
Permanent (ref.)
Temporary -0.339 0.225 -0.317 0.232 -0.312 0.236
Self-employed -0.104 0.260 -0.107 0.266 -0.100 0.270
Partner’s income
Low or Middle (ref)
High income 0.299 0.104*** 0.299 0.107*** 0.298 0.109***
Table 2b: (Continued)
Model 1 Model 2 Model 3 Model 4 Regional level Estimate S.E. Estimate S.E. Estimate S.E. Estimate S.E.
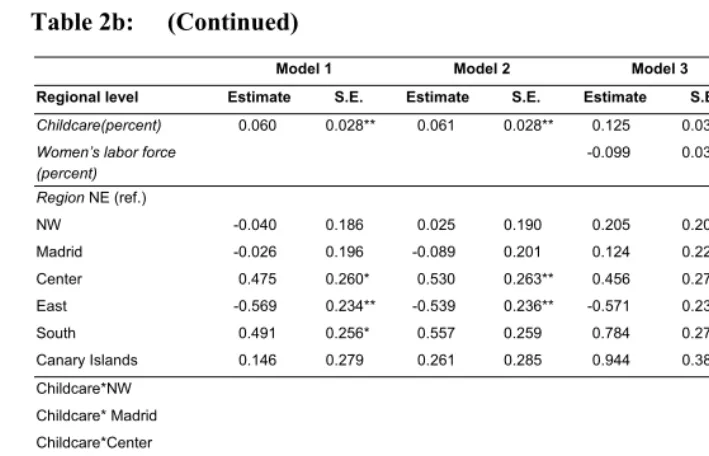
Childcare(percent) 0.060 0.028** 0.061 0.028** 0.125 0.037*** 0.079 0.038**
Women’s labor force (percent)
-0.099 0.037***
Region NE (ref.)
NW -0.040 0.186 0.025 0.190 0.205 0.204 -0.234 0.580
Madrid -0.026 0.196 -0.089 0.201 0.124 0.223 0.285 0.607
Center 0.475 0.260* 0.530 0.263** 0.456 0.272* 1.481 0.619**
East -0.569 0.234** -0.539 0.236** -0.571 0.239* 0.641 1.845
South 0.491 0.256* 0.557 0.259 0.784 0.277** 1.313 0.457***
Canary Islands 0.146 0.279 0.261 0.285 0.944 0.385* 0.630 0.770
Childcare*NW 0.056 0.086
Childcare* Madrid -0.044 0.068
Childcare*Center -0.547 0.337
Childcare*East -0.086 0.127
Childcare*South -0.463 0.213**
Childcare*Canary Is. -0.138 0.379
Constant -3.555 0.604*** -3.428 0.624*** 0.380 1.346 -3.717 0.686***
σε 0.249 0.232 0.288 0.203 0.399 0.157** 0.419 0.154***
Log Likelihood -6900.02 -6811.78 -6805.57 -6039.57
Significance: '*'=10%; '**'=5%; '***'=1%.
5. Results
er.
childcare, since it would lead to implausibly large increases in fertility rates13. More
likely, this (linear) change in fertility rates with childcare increases is circumscribed to the range of childcare values actually existing in Spain during the period studied (1993-2000), but nothing guarantees that after a certain (unspecified) threshold this would continue to hold true. An alternative specification of the childcare variable, as a dummy variable indicating different levels of coverage, also provides significant and strongly positive results, that only slightly decline with higher values of childcare (Model 5 and 6). Thus, for instance, in the case of first births and Model 6, an increase in childcare coverage from very low levels (0-4 percent) to somewhat higher levels (4-8 percent) imply a significant coefficient of 0.68; for a coverage between 8 and 12 percent, the coefficient is 0.77; and for coverage proportions above 12 percent the result is 0.96. For second and higher order births the coefficients are 0.69, 1.06, and 0.57, respectively.
The results obtained for the other variables included in Model 1 are as expected. Thus, age follows a bell-shaped effect for first births, peaking at the ages 28-32, while it continuously declines for higher order births. In the equation for second and higher order births the “age of the youngest child” also follows a bell-shaped form, with the highest level around age 4. Women with a low educational level (less than higher secondary), have significantly higher rates of first birth, with a coefficient of 0.54; and in the case of higher parities, the highly educated show positive coefficients. This last result is in line with results obtained in several other countries (e.g. Kravdal 2001; Kreyenfeld 2002), and could be related to better possibilities for highly educated women to combine paid work and motherhood, and to the higher opportunity costs of prolonging interruptions in their work trajectories for these women14. The results for
the regions fixed effects are consistent with the fertility levels and age at first birth for each region, as calculated from register data (Instituto Nacional de Estadística 2008). They show a higher fertility and younger age at first birth in the South, Canary Islands and the Cent
13 I thank an anonymous referee for this insight.
14 This result refers to Model 1, in which the variable for labor force status is not included. Yet, when this last
Table 3a: Multi-level estimation of the transition to a first birth
Model 5 Model 6 Model 7 Model 8 Individual level Estimate S.E. Estimate S.E. Estimate S.E. Estimate S.E.
Age (spline)
16-23 0.241 *** .047 0.128 *** .048 0.220 *** .047 0.102 ** .048
23-28 0.248 *** .034 0.165*** .034 0.255 *** .034 0.166 *** .035
28-32 0.039 .042 -0.002 .042 0.044 .043 -0.003 .043
32-36 -0.142 ** .072 -0.140 * .226 -0.148 ** .073 -0.145 ** .074
36+ -0.569 ** .223 0.067 .118 -0.590 *** .223 -0.612 *** .226
Educational level
High -0.009 .115 0.067 .118 -0.053 .117 0.030 .120
Middle (ref.)
Low 0.531 *** .108 0.280 ** .113 0.548 *** .110 0.263 ** .114
Activity status
Employed (ref.)
Other inactive 0.402 *** .130 0.414 *** .134
Student -1.395 *** .143 -1.522 *** .149
Unemployed -0.397 *** .118 -0.443 *** .122
Type of contract
Permanent (ref.)
Temporary -0.385 ** .152 -0.425*** .156
Self-employed 0.009 .231 -0.023 .235
Health status
Good (ref)
Bad -0.795 *** .212 -0.791 *** .215
Missing -0.416*** .097 -0.308 *** .105
Regional level
Childcare (percent) 0.032 .034 0.037 .035
0 to <4 (ref.)
4 to < 8 0.803 *** .169 0.676 *** .166
8 to < 12 1.079 *** .319 0.766 ** .319
>=12 0.926 * .485 0.957 * .545
Period (Ref.=1993-96)
1997-2000 0.132 .109 0.235 ** .114
Region NE (ref.)
NW 0.156 .170 0.107 .166 0.259 .192 0.234 .195
Madrid -0.575 ** .229 -0.560 ** .224 0.002 .195 -0.091 .195
Center 0.415 ** .166 0.354 ** .165 0.451 .293 0.448 .307
East -0.397 .499 -0.543 .555 0.091 .263 -0.027 .265
South 0.404 ** .159 0.330 ** .157 0.412 .293 0.405 .307
Canary Islands 0.741 *** .189 0.725 *** .186 0.765 ** .303 0.822 *** .313
Constant -6.126 *** .343 -4.252*** .375 -6.135 *** .433 -4.314 *** .466
Table 3b: Multi-level estimation of the transition to a second or higher order birth
Model 5 Model 6 Model 7 Model 8 Individual level Estimate S.E. Estimate S.E. Estimate S.E Estimate S.E
Age of youngest child
0-1 years 1.637 *** .425 1.635 *** .433 1.631 *** .425 1.615 *** .429
1-4 years 0.164*** .061 0.176*** .061 0.155 ** .066 0.173 *** .066
4-6 years -0.025 .079 -0.015 .080 -0.020 .082 -0.008 .083
6+ years -0.116*** .033 -0.113*** .033 -0.127 *** .033 -0.124 *** .033
Age 16-33 -0.021 .014 -0.030 ** .015 -0.020 .015 -0.029 * .016
Age 33+ -0.153 *** .037 -0.163 *** .037 -0.153*** .038 -0.163 *** .038
Second birth (ref.)
Third birth -1.569*** .120 -1.590*** .122 -1.596*** .127 -1.625*** .130
Fourth or higher birth -1.414*** .181 -1.407*** .185 -1.446*** .200 -1.462 *** .206
Educational level
High 0.285 ** .135 0.249 * .142 0.284 ** .139 0.246 * .147
Middle (ref.)
Low 0.045 .118 0.079 .121 0.051 .123 0.083 .127
Activity status
Employed (ref.)
Other inactive -0.012 .125 -0.015 .132
Student -0.805 .507 -0.768 .510
Unemployed -0.158 .150 -0.164 .158
Type of contract
Permanent (ref.)
Temporary -0.323 .221 -0.327 .231
Self-employed -0.108 .254 -0.104 .264
Partner’s income
Low or Middle (ref)
High income 0.305 *** .103 0.300 *** .106
Income missing -0.313 .570 -0.203 .558
Regional level
Childcare (percent) 0.092 ** .036 0.090 ** .036 0 to <4 (ref.)
4 to <8 0.648 *** .193 0.686 *** .193
8 to <12 1.027 *** .273 1.057 *** .277
>=12 0.578 .513 0.570 .509
Period (Ref.=1993-96)
Table 3b: (Continued)
Model 5 Model 6 Model 7 Model 8 Regional level Estimate S.E. Estimate S.E. Estimate S.E Estimate S.E
Region NE (ref.)
NW -0.137 .181 -0.074 .184 0.057 .202 0.117 .206
Madrid -0.423 * .227 -0.512 ** .229 -0.009 .200 -0.067 .205
Center 0.378 ** .184 0.434 ** .188 0.704 ** .305 0.744 ** .307
East -0.436 .517 -0.383 .512 -0.772*** .278 -0.727 ** .283
South 0.378 ** .175 0.449 ** .178 0.723 ** .303 0.778 ** .305
Canary Islands 0.062 .216 0.186 .224 0.374 .323 0.478 .327
Constant -3.387 *** .537 -3.232 *** .564 -3.826 *** .641 -3.687 *** .666
σε 0.000 0.000 0.339 * .180 0.381 ** .163
Log Likelihood -6881.641 -6798.241 -6898.089 -6808.504
Significance: '*'=10%; '**'=5%; '***'=1%.
In Model 2, I added several variables concerning the activity status, workplace, and partner’s income (this last variable for second and higher order births only). The inclusion of these variables implied an increase in the effect of the regional childcare indicator (with a coefficient of 0.07) in the case of first births, while for higher order births this coefficient was practically unchanged (0.06). This is consistent with the strong impact of the activity status for first births, that shows negative effects of unemployment and being a student, but positive effects of being in other situations (e.g. dedicated to household tasks), comparing to being employed. Furthermore, holding a temporary employment has a strong negative effect on first birth. In the case of second and higher order births, the activity status variables lose much of their importance and the coefficients are no longer significant. As predicted by the economics literature, the partner’s income has a strong positive effect on fertility; nevertheless, in the Spanish context, this variable may also reflect the partner’s job security (Baizán 2007).
respectively15. Given the similarity of results, I have presented in all tables the
specification that measures childcare at conception.
I also tried several interactions of the day care variable, in particular with the activity status of the women, expecting that the effect of childcare would be higher for employed women. However, the results did not provide significant differences between the categories, suggesting that an increased availability of day care has a general effect on fertility (results not shown). It is possible that the interaction between women’s labor force participation and formal childcare availability is not significant due to the interrelationship between childcare options, labor market situation and fertility. For instance, in the case of second and higher order births, those women who have a job may have already found some childcare arrangement, be it formal or informal, including father’s participation in care or the adaptation of women’s working hours, (otherwise working women would have previously quit their jobs), reducing fertility differentials between working and non-working women. Differences between working and non-working women will also be diluted if the fact of not working is due to difficulties in accessing a satisfactory childcare arrangement.
Previously, it was suggested that the placement of childcare centers may be endogenous to other (unobserved) regional characteristics that also affect fertility. I therefore explored the inclusion of several contextual variables to take this into account. In particular, the percentage of women’s labor force participation at the regional level was included in Model 3. The results of this last variable show significant coefficients, with a positive sign for first births and a negative sign for second births. The inclusion of the labor force participation of women leads to nonsignificant results for the proportion of children in childcare for the first birth process (0.03); by contrast, it leads to a strengthening of the effect and significance of the coefficient for higher births (0.13). One should keep in mind however that the time-varying rate of women’s labor force may also be correlated with childcare provision, which possibly leads to biased results. The effects of the regional unemployment rate for women and the proportions of part-time jobs were also tested (results not shown), providing negative but not significant coefficients, that did not substantially change the coefficients of the childcare indicator. These results suggest ambiguous effects of unemployment, and are consistent with the idea that part-time jobs indicate a precarious situation in the Spanish labor market, rather than a voluntary reduction of working hours to accommodate care needs. In Model 7 and 8, dummy variables for time period were included (these models replicate Model 1 and 2 for the other variables), to allow for the possibility that the unobservable regional-level variables vary over time16. Thus, the years 1993-96 were
distinguished from the years 1997-2000. In these two periods, economic conditions
15 I thank an anonymous referee for suggesting to apply this variable.
were quite different, with stagnant or negative economic growth in the first period, and a rapidly expanding economy during the second. However, the results obtained do not show significant results for this variable, with the exception of first births in Model 8 (0.235 **). Furthermore, the inclusion of a time dummy substantially attenuates the positive impact of the childcare variable, which becomes insignificant for first births, but not for higher order births. It should be kept in mind that the childcare variable reflects the variation over time in the levels of coverage; therefore, the inclusion of a time dummy necessarily accounts for part of the observed variation of the childcare coverage (if year dummies were included, they would fully account for all the variation in childcare).
Finally, in Model 4, the effect of an interaction between the region and the availability of childcare was tested. The expectation was that the effect of childcare would be stronger in the East, North East and Madrid (regions with higher percentages of women’s labor force participation and higher recent increases in TFR), and weaker in the South, Center, and the Canary Islands. The results obtained do not fit the expectations for first births, for which positive significant coefficients are obtained for the East and the South regions. On the contrary, the results for second or higher order births are consistent with these expectations, since they show negative interaction coefficients in the Canary Islands, Center and South, although this is only significant in the last region.
6. Conclusion
The results obtained are consistent with the hypothesis, derived from the main existing theoretical perspectives on the issue, that an increase of childcare coverage has a positive effect on fertility. Across different specifications, a significant positive effect of the percentage of children aged 0-2 enrolled in childcare is found on first births as well as second and higher order births. This effect is substantively large, as it implies increases in the relative risk of fertility of at least 5% for each percent increase in the proportion of children in childcare. These analyses are based on the assumption, put forward above, that there are time-invariant regional characteristics that affect both childcare availability and fertility, during the period considered. Although I have not modeled explicitly the process of placement of day care centers (for which no data are available), this process could be related to the proportions of women present in the labor market, and the growing acceptability of formal childcare centers in several regions (presumably also related to the decreasing availability of relatives to care for children). The inclusion of the aggregate proportion of women in the labor market in one of the models provided mixed results, since the effect of the indicator for childcare availability lost its significance for first births, while its positive effect increased for second and higher order births. These results can also be interpreted taking into account that childcare availability has a positive effect on women’s labor force participation, as shown by the results presented here. Moreover, these results are consistent with the theoretical arguments put forward above, concerning the strong interrelationships postulated between these variables. As a consequence, the fact that childcare’s “direct” effect on fertility loses its significance while simultaneously increasing women’s participation may indicate the existence of an indirect positive effect of childcare on fertility.
Several limitations in the available data, such as the short period of observation (nine years) and the large geographical units studied, should be emphasized, and therefore the results obtained here should be interpreted with some caution. However, in principle, a longer period of observation and smaller regions should provide sharper results.
The results obtained partially supported the hypothesis that formal childcare availability has different effects according to the degree of adaptation of social institutions to changes in gender roles in each region. This argument was tested with an interaction between the women’s region of residence and the availability of childcare indicator, providing results consistent with the hypothesis only for second and higher order births. On the one hand, these mixed results may be related to the importance of other providers of care, such as other family members, which may have the effect of reducing the impact of the interaction. On the other hand, it may also be the case that the differences between Spanish regions are less important than anticipated.
Overall, the results obtained suggest that the adaptation of institutions to changing gender roles that is taking place in Spain, and the concomitant changes in the care regime, particularly the increased availability of formal childcare, are involved in the explanation of the recent increases in TFR. If this interpretation is correct, these institutional changes may lead to still further fertility increases in the future.
7. Acknowledgments
References
Aaberge, R, Colombino, U., and Del Boca, D. (2005). Women’s participation in the labor market and fertility: The effects of social policies. In: Boeri, T., Del Boca, D., and Pissarides, C. (eds.). Women at work. An economic perspective. Oxford: Oxford University Press: 121-239.
Alberdi, I. (1999). La nueva familia española. Madrid: Taurus.
Allison, P.D. (2005). Fixed effects regression methods for longitudinal data using SAS. Cary, NC: SAS Institute Inc.
Alwin, D. F. (1996). From Childbearing to Childrearing: the Link between declines in fertility and changes in the socialization of children. Population and Development Review 22(Supplement: Fertility in the United States: New patterns, new theories): 176-196. doi:10.2307/2808011.
Andersson, G., Duvander, A.-Z., and Hank, K. (2004). Do child-care characteristics influence continued child bearing in Sweden? An investigation of the quantity, quality, and price dimension. Journal of European Social Policy 14(4): 407-418.
doi:10.1177/0958928704046881.
Angeles, G., Guilkey, D. K., and. Mroz, T. A. (2005). The impact of community- level variables on individual-level outcomes: Theoretical results and applications. Sociological Methods & Research 34(1): 76-121.
doi:10.1177/0049124104273069.
Antolin, P. and Bover, O. (1997). Regional migration in Spain: The effect of personal characteristics and of unemployment, wage and house price differentials using pooled cross-sections. Oxford Bulletin of Economics and Statistics 59 (2): 215-235. doi:10.1111/1468-0084.00061.
Arriba, A. and Moreno, L., (2005). Spain – poverty, social exclusion and “safety nets”. In: Ferrera, M. (ed.). Welfare state reform in Southern Europe: Fighting poverty and social exclusion in Italy, Spain, Portugal and Greece. London: Routledge: 141-203.
Azmat, G. and González, L. (2008). Targeting fertility and female participation through the income tax. Paper presented at the IUSSP Seminar on Fertility and Public Policies in Low Fertility Countries, Barcelona, July 7-8, 2008.
Baizán, P. (2007). The impact of labour market status on second and higher-order births. A comparative analysis based on the European Community Household Panel. In: Esping-Andersen, G. (ed.). Family formation and family dilemmas in contemporary Europe. Madrid: Fundación BBVA: 93-127.
Baizán P. and González M.J., (2007). ¿Las escuelas infantiles son la solución? El efecto de la disponibilidad de escuelas infantiles (0-3 años) en el comportamiento laboral femenino. In: Navarro, V. (ed.). La situación social en España (Vol. 2). Madrid: Biblioteca Nueva: 411-444.
Becker, G.S. (1981). A treatise on the family. Cambridge, Mass.: Harvard University Press.
Bernhardt, E.M. (1993). Fertility and employment. European Sociological Review 9(1): 25-42. http://esr.oxfordjournals.org/cgi/content/abstract/9/1/25.
Bernhardt, E. and Goldscheider, F. (2006). Gender equality, parenthood attitudes, and first births in Sweden. Vienna Yearbook of Population Research 2006: 19-39.
doi:10.1553/populationyearbook2006s19.
Bettio, F. and Plantenga, J. (2004). Comparing care regimes in Europe. Feminist Economics 10(1): 85-113. doi:10.1080/1354570042000198245.
Caldwell, J.C. (1982). Theory of fertility decline. London: Academic Press.
Cigno, A. and Ermisch, J., (1989). A microeconomic analysis of the timing of births. European Economic Review 33(4): 737-760. doi:10.1016/0014-2921(89)90023-8. de Polavieja, J.G., (2003). Estables y precarios. Desregularización laboral y
estratificación social en España. Madrid: Centro de Investigaciones Sociológicas.
Del Boca, D. (2002). The effect of child care and part-time opportunities on participation and fertility decisions in Italy. Journal of Population Economics 15(3): 549-573. doi:10.1007/s001480100089.
Del Boca, D. and Locatelli, M. (2007). Motherhood and participation. In: Del Boca, D. and Wetzels, C. (eds.). Social policies, labour markets and motherhood: A comparative analysis of European countries. Cambridge: Cambridge University Press.
Esping-Andersen, G. (1999). Social foundations of postindustrial economies. Oxford: Oxford University Press. doi:10.1093/0198742002.001.0001.
Eurostat (2001). ECHP UDB Manual. European Community Household Panel Longitudinal Users' Database. Luxembourg: Eurostat.
Eurostat (2002). Key data on education in the European Union. Luxembourg: Office for Official Publications of the European Communities.
Eurostat (2006). Labor Force Surveys (second trimesters). [electronic resouce]. Luxembourg: Eurostat. (data downloaded at 18/10/2006). http://epp.eurostat.ec.europa.eu/.
Fernández Cordón, J. A. and Tobío Soler, C. (2005). Conciliar las responsabilidades familiares y laborales: políticas y prácticas sociales. Madrid: Fundación Alternativas. Documento de trabajo 79/2005.
Folbre, N. (2004). A theory of misallocation of time. In: Folbre, N and Bittman, M. (eds.). Family time: the social organization of care. London: Routledge: 7-24. Gallie, D. (2007). Employment regimes and the quality of work. Oxford: Oxford
University Press. doi:10.1093/acprof:oso/9780199230105.001.0001.
Gallo, F., Mastrovita, S., and Siciliani, I. (2004). The nature of sample attrition in the ECHP. Paper presented at 2nd European Community Household Panel Users Conference, Berlin, June 24-26, 2004.
Gauthier, A.H. and Hatzius, J., (1997). Family policy and fertility: An econometric analysis. Population Studies 51: 295-306. doi:10.1080/0032472031000150066. Gershuny, J. (2000). Changing times: Work and leisure in postindustrial society.
Oxford: Oxford University Press.
Goldstein, H. (1995). Multilevel statistical models. Second Edition. London: Edward Arnold.
González López, M.J. (2003). Servicios de atención a la infancia en España. Estimación de la oferta actual y de las necesidades ante el horizonte 2010. Madrid: Fundación Alternativas. Documento de trabajo 1/2003.
Gornick, J.C. and Meyers, M. (2003). Families that work: policies for reconciling parenthood and employment. New York: Russell Sage Foundation.
Hakim, C. (2000). Work-lifestyle choices in the 21st century: Preference theory. Oxford: Oxford University Press.
Hank, K. and Kreyenfeld, M. (2003). A multilevel analysis of child care and women’s fertility decisions in Western Germany. Journal of Marriage and Family 65(3): 584-596. doi:10.1111/j.1741-3737.2003.00584.x.
Hochschild, A. and Machung, A. (1989). The second shift: Working parents and the revolution at home. New York: Viking.
Hotz, V.J., Klerman, J.A., and Willis, R.J. (1997). The economics of fertility in developed countries. In: Rosenzweig, M.R. and Stark, O. (eds.). Handbook of population and family economics (Vol. 1A). Amsterdam: Elsevier: 275-374. Instituto Nacional de Estadística (2008). Inebase. [electronic resource]. www.ine.es. Kohler, H.P., Billari, F., and Ortega, J.A. (2006). Low fertility in Europe: Causes,
implications, and policy options. In: Harris, F.R. (ed.). The baby bust: Who Will Do the Work? Who Will Pay the Taxes? Lanham, MD: Rowman & Littlefield Publishers Inc.: 48-109.
Kravdal, Ø. (1996). How the local supply of day-care centers influences fertility in Norway: A parity-specific approach. Population Research and Policy Review 15(3): 201-218. doi:10.1007/BF00127049.
Kravdal, Ø. (2001). The high fertility of college educated women in Norway: An artefact of the separate modelling of each parity transition. Demographic Research 5(6): 187-216. doi:10.4054/DemRes.2001.5.6.
Kreyenfeld, M.(2002). Time-squeeze, partner effect or self-selection? An investigation into the positive effect of women´s education on second birth risks in West Germany. Demographic Research 7(2): 15-48. doi:10.4054/DemRes.2002.7.2. Lesthaeghe, R. (1995). The second demographic transition in western countries: An
interpretation. In: Mason, K.O. and Jensen, A.M. (eds.). Gender and family change in industrialized countries. Oxford: Oxford University Press: 17-62. Lewis, J.E. (1998). Gender, social care, and welfare state restructuring in Europe.
Aldershot: Ashgate.
Lillard, L.A. and Panis, C.W.A. (2003). aML multilevel multiprocess statistical software, version 2.0. Los Angeles, California: EconWare.
Kohli, M. (eds.). Inclusions and exclusions in European societies. New York: Routledge: 89-110.
McDonald, P. (2000). Gender equity in theories of fertility transition. Population and Development Review 26(3): 427-439. doi:10.1111/j.1728-4457.2000.00427.x. Ministry of Education (Spain) (2008 and 2009). Estadísticas de educación. [electronic
resource]. www.educacion.es.
Nicodemo, C. and Waldmann, R. (2009). Child-care and participation in the labor market for married women in Mediterranean countries. IZA Discussion Paper No. 3983. www.iza.org.
OECD (2000). Employment Outlook. Paris: OECD.
Orloff, A.S. (1996). Gender in the welfare state. Annual Review of Sociology 22: 51-78.
doi:10.1146/annurev.soc.22.1.51.
Pfau-Effinger, B. (2004). Development of culture, welfare states and women’s employment in Europe. Aldershot: Ashgate.
Recaño Valverde, J. and Cabré Pla, A. (2003). Migraciones interregionales y ciclos económicos en España (1988-2001). Papeles de Geografía 37: 179-197.
Rindfuss, R.R., Guilkey, D., Morgan, S.P., Kravdal, Ø., and Guzzo, K.B. (2007). Child care availability and first-birth timing in Norway. Demography 44(2): 345-372.
doi:10.1353/dem.2007.0017.
Rosina, A. and Del Boca, D. (2007). L'effimero boom delle nascite. [electronic resource]. Firenze: Neodemos.www.neodemos.it.
Rubery, J., Smith, M., and Fagan, C. (1999). Women's employment in Europe. Trends and prospects. London and New York: Routledge.
Saraceno, C. (1996). Family change, family policies and the restructuration of welfare. Paper presented to the OECD conference "Beyond 2000: The New Social Policy Agenda". Paris: OECD.
Tatsiramos, K. (2004). Geographic mobility and unemployment insurance in Europe: A cross country comparison using the ECHP. Paper presented at the 2nd International Conference of ECHP Users, Berlin, June 24-26 2004.
Watson, D. (2002). Sample attrition between waves 1 and 5 in the European Community Household Panel. European Sociological Review 19(4): 361-378.