in the population sciences published by the Max Planck Institute for Demographic Research Konrad-Zuse Str. 1, D-18057 Rostock · GERMANY www.demographic-research.org
DEMOGRAPHIC RESEARCH
VOLUME 19, ARTICLE 12, PAGES 293-360
PUBLISHED 01 JULY 2008
http://www.demographic-research.org/Volumes/Vol19/12/ DOI: 10.4054/DemRes.2008.19.12
Research Article
Austria:
Persistent low fertility since the mid-1980s
Alexia Prskawetz
Tomáš Sobotka
Isabella Buber
Henriette Engelhardt
Richard Gisser
1 Introduction 294
2 Main population trends in Austria 295
3 Period and cohort fertility trends 296
3.1 Long-term trends in period and cohort fertility 296 3.2 Completed fertility and parity distribution among women
born since 1900
299
3.3 Childbearing trajectories of younger cohorts 302 3.4 Socioeconomic differences in completed fertility and
parity distribution
302
3.5 Period fertility tempo and quantum 309
3.6 Parity-specific fertility trends since 1984 313
3.7 Fertility among non-Austrian citizens 315
3.8 Fertility intentions 316
4 Living arrangements and family formation 318
4.1 Leaving home and union formation 318
4.2 Patterns of marriage 321
4.3 Divorce 323
4.4 Partnership context of childbearing 326
4.5 Non-marital childbearing 328
4.6 Abortion 330
5 Trends in socio-economic determinants of fertility 331 5.1 Female labour force participation and fertility 331
5.2 Direct and indirect costs of children 336
5.3 Childcare services 336
5.4 Attitudes towards family and fertility 337
6 Family policies and fertility 340
6.1 Family policies in Austria 340
6.2 Changes in parental leave and swings in the second and third birth rates
342
6.3 Effects of structural and financial incentives on fertility intentions and fertility preferences
346
6.4 Public discourse 348
7 Conclusions 349
8 Acknowledgements 351
References 352
Austria:
Persistent low fertility since the mid-1980s
Alexia Prskawetz1
Tomáš Sobotka2
Isabella Buber3
Henriette Engelhardt4
Richard Gisser5
Abstract
This chapter offers an in-depth analysis of fertility in Austria, a country which has experienced a low and relatively stable fertility level and a gradual postponement of childbearing since the mid-1980s. We begin by summarising Austrian population trends in the post-World War II period and highlighting recent relatively high migration levels. We outline the long history of sub-replacement fertility and high childlessness in Austria and look in detail at recent parity-specific developments, trends in family size, delayed childbearing and persistent fertility differences by education level, country of origin and religious affiliation. The chapter then summarises main trends in family-related behaviour, including the changing patterns of leaving parental home, the rise in cohabitation, the decline in marriage and the rise of divorce and the diversity in non-marital childbearing, which has a long tradition in many parts of the country. We discuss the development of family policies in Austria and their relationship to fertility during the past decades. Social policies in Austria provide only a limited support for a reconciliation of childrearing and employment among mothers with children below the age of three. A combination of one of the highest family spending rates among the OECD countries and the low fertility rates indicate that structural constraints (such as the availability of childcare) constitute part of the explanation of low fertility.
1 Vienna University of Technology, and Vienna Institute of Demography. E-mail: [email protected]
2 Vienna Institute of Demography. E-mail: [email protected]
3 Vienna Institute of Demography. E-mail: [email protected]
1. Introduction
Austria, a central European country with a population of 8.3 million in 2007, has a long history of sub-replacement fertility. Completed fertility had dipped below two children per woman already during the (first) demographic transition and rose temporarily above this level among the 1917-1946 cohorts. Following the peak of the baby boom in the early 1960s a substantial fall in fertility lasted until the mid-1980s. Since then Austria has recorded low and relatively stable period fertility, with the period total fertility rate hovering around the level of 1.4. A long-standing trend towards delayed childbearing has been in part responsible for the persistence of such low fertility levels. Also the desired family size has reached relatively low levels: already the late 1950s cohorts have expressed sub-replacement fertility preferences at a young age. Minor swings in period fertility were associated with changes in family policies, in particular parental leave arrangements.
As in other European countries, family and living arrangements have been changing rapidly in Austria since the early 1970s. Cohabitation has increasingly become an alternative to marriage, divorce rates have reached very high levels and extramarital childbearing, which was historically common in many regions, has risen substantially. Migration has become an important component of population change, contributing markedly to the continued increase in population size.
Structural trends outside the family system such as women’s higher educational attainment and their rising labour force participation combined with increased earnings engendered more egalitarian and individualistic attitudes and values which, in turn, are thought to have affected family stability. At the same time, social policies in Austria provide only a limited support for a combination of childrearing and employment among mothers with children below the age of three. With one of the highest family spending rates among the OECD countries, the low fertility rates and the modest gap between fertility preferences and realized family size indicate that structural constraints—such as the availability of childcare—constitute part of the explanation of low fertility.
participation for fertility trends. Subsequently, it outlines the development of family policies in Austria and analyses their relationship to fertility during the past decades. The last section contains a synthesis and discussion of major findings.
2. Main population trends in Austria
This section outlines main components and characteristics of population change in Austria after 1945. It focuses on the trends in migration, mortality, total population size and population ageing. Developments in fertility, marriage and living arrangements are analysed in the subsequent parts of this chapter.
After World War II, the population of Austria stagnated at slightly below seven million until the end of the 1950s. Since then, Austria has become a country of net in-migration. The most notable immigration waves included the influx of immigrant workers between 1961 and 1973, the migration movements from 1989 to 1993 linked partly to the breakdown of the state-socialist systems in central and eastern Europe, the dissolution of Yugoslavia and the subsequent civil war on that territory. Most recently high net migration was recorded between 2000 and 2005, partly related to past immigration and including many family reunions of the recently naturalised Austrians. Leaving aside the periods of stagnation in population size, the importance of migration for total population growth increased. A comparison of the growth periods (1961-73 and 1989-2004) yields few differences in the annual population growth rate (0.57% for the first and 0.49% for the second period) but fundamental differences in its components. The natural increase was 0.39% per annum in the period 1961-73 and 0.07% in the period 1989-2004; net in-migration was 0.18% per year in the first, and 0.41% in the second period (including statistical adjustments of 0.02%). The total population size reached 8.3 million in January 2007; 95% of the relatively rapid population increase recorded from 2001 to 2004 (0.57% annually) was the result of a positive migration balance.
non-abroad form the population with migration background. This category already comprised one sixth of the total population (16.6%) by the end of 2004.
The number of deaths fell to an all-time low of 73,600 in 2006. Despite fluctuations in numbers of deaths, mortality rates have generally decreased in the last decades. Since 1970, when the period of stagnation in mortality rates ended, life expectancy at birth has risen annually by an average rate of 0.29 years for men and by 0.26 years for women, reaching 76.65 years and 82.24 years, respectively, in 2005. The gender gap in life expectancy at birth has narrowed from 7.2 years around 1980 to 5.6 years at present. The number of years a person may still expect to live at retirement age (i.e. age 65) increased also and reached 16.99 years for men and 20.33 years for women in 2005.
The most recent official projections for the years 2005-50 by Statistics Austria (Hanika 2005, updated in Statistics Austria 2006b) are based on the following hypotheses for the main variant: an increase in the total fertility rate (TFR) between 2010 and 2030 from 1.4 to 1.5 with the mean age at childbearing rising to 31.0 years; an increase in life expectancy up to 2050 to 84.3 years for men and 89.0 years for women; a decrease in net-migration from 49,000 in 2005 to 20,000 per year in the period 2019-50. Thus the population will grow, although at a progressively slower pace, to 9 million in 2050, i.e., by about 9% compared to the initial population of 2006. As the number of persons older than 60 will increase by two thirds in the same period, demographic ageing is inevitable. The proportion of elderly people will rise from the present 22% to 33.5% in 2050. The working age population (15-59 years) will increase slightly until 2020, and then decline by 8%, while the population below the age of 15 will decline by the same percentage during the whole projection horizon.
3. Period and cohort fertility trends
3.1 Long-term trends in period and cohort fertility
The long-term trends in Austrian fertility have evolved in parallel with the trends in western and northern European countries. Three major shifts affected fertility developments during the 20th century. First, a steep fall in fertility rates took place after
World War I, leading to sub-replacement fertility levels during the economic crisis of the 1930s (Frejka and Sardon 2004). As a result, women born during the first quarter of the 20th century achieved below replacement fertility as well. Second, a marked rise in
War II, and culminated in the early 1960s, when the period TFR reached the level of 2.8. Subsequently, a substantial fall in fertility took place between the mid-1960s and the mid-1980s. Figure 1 shows the completed cohort fertility among women born between 1900 and 1966 and period fertility rates in 1951-2006. For the more recent period, starting in 1984, the graph also displays a period fertility indicator based on parity progression ratios, termed the period average parity (PAP). This fertility index is based on a set of age-specific childbearing probabilities for first births and duration-specific childbearing probabilities for second and higher-order births. This approach reflects properly the sequential nature of childbearing.6 Whereas the TFR has oscillated around the level of 1.4 in the last two decades, the PAP, which is less affected by tempo effects, has typically reached the levels of 1.6-1.7. Completed fertility has gradually declined among women born after 1935, dropping below 1.7 among women born after 1965.
This section outlines major changes in period and cohort fertility rates. It looks at parity-specific trends in completed fertility among women born in the period 1900-66 and selected socio-economic differentials in cohort fertility and parity distribution as reported by the population census of 2001 (Statistics Austria 2005c). The second part contains an analysis of trends in period fertility tempo and quantum, concentrating on the postponement of parenthood to higher reproductive ages. The focus of this analysis is the period 1984-2006, for which the birth statistics were collected by birth order, thus permitting a detailed study of the parity-specific components of fertility changes.
6 The PAP is based on the assumption that following the birth of the first child, the childbearing intensity is
Figure 1: Period (1951-2006) and cohort (1900-1966) fertility indicators, Austria
0.0 0.5 1.0 1.5 2.0 2.5 3.0
1900 1930
1910 1940
1920 1950
1930 1960
1940 1970
1950 1980
1960 1990
1970 2000
T
o
ta
l
fe
rt
ili
ty
Cohort Year
Period TFR
Birth cohort 1935
Birth cohort 1966 Cohort TFR
PAP
Birth cohort 1900
3.2 Completed fertility and parity distribution among women born since 1900
Austrian population censuses carried out in 1981, 1991 and 2001 (Statistics Austria 1989, 1996 and 2005c) provide retrospective information on cohort fertility.7 Our description focuses on the birth cohorts 1900-66. For the cohorts born after 1955, that had not completed their fertility at the time of the most recent census, we combine the data from the 2001 population census with the vital statistics records for 2001-05 and with estimates of a small portion of their future fertility at late childbearing ages. Our computations differ somewhat from those presented in the most extensive analysis of Austrian cohort fertility to date (Frejka and Sardon, 2004), which relied on cohort fertility estimates based on long-time series of period fertility data.
Figure 2 depicts changes in cohort parity composition. Women born in 1900, affected in part by the economic crisis of the 1930s, achieved low completed fertility of 1.75 through a combination of high childlessness and small average family size. According to the 1991 census, childlessness among Austrian women born in the early 20th century reached particularly high levels, surpassing 20% for women born up to 1915 and even reaching 29% among women born in 1900.8 This is well above the levels of childlessness recorded in early 20th-century cohorts in neighbouring Germany, the Czech Republic and Slovakia. The post-war baby boom led to a remarkable rise in completed fertility, surging to 2.46 among women born in 1935. This rise resulted in a marked shift in the final parity distribution. Childlessness decreased to 12% among women born between 1936 and 1949, and families with only one child became relatively uncommon. In parallel, larger families became dominant, with more than 40% of all women born in 1932-38 having three or more children.
7 To reduce potential selectivity linked to differential mortality by parity status, the population census
conducted in 1991 is used to analyse the fertility of women born in the period 1900-40 and the most recent population census (2001) is used to analyse fertility of cohorts born in 1941 and later. For women born in the
early 20th century we also considered using the 1981 census data (no earlier data are available). However,
these data differed from the data of both 1991 and 2001 census rounds as they indicate considerably higher childlessness for all women past reproductive age in 1981 (the difference was 2-6%; see also footnote 3). Because census data for 1991 and 2001 showed consistent and almost identical results with respect to completed fertility and parity distribution of women born in 1905 and later, we decided not to use the 1981 data. The parity distribution for old-aged women at the time of the 1991 census may potentially suffer a bias owing to differential mortality by parity. The available research indeed shows that childless women have slightly higher mortality rates than women with one or two children at the age of 65 and over (Doblhammer 1997: Table 8-4), but this difference is small and cannot account for large changes in childlessness suggested by the results of the 1981 and 1991 censuses.
8 The population census carried out in 1981 (Statistics Austria 1989) indicated even higher levels of
Figure 2: Cohort parity distribution, Austrian women born 1900-1966 0 5 10 15 20 25 30 35 40
1900 1905 1910 1915 1920 1925 1930 1935 1940 1945 1950 1955 1960 1965 Birth cohort P ro p o rt io n o f w o m e n b y t h e n u m b e r o f c h ild re n b o rn (i n p e rc e n t) Childless 1 child 2 children 3 children 4+ children series break 1940-41
Source: Census 2001 (Statistics Austria 2005c) for birth cohorts 1941-1966 and census 1991 (Statistics Austria 1996) for birth cohorts 1900-1940. Cohort fertility taking place in 2001-2006 was computed from the database of births in 1984-2006 provided by Statistics Austria.
The gradual spread of two-child families constitutes the only trend that started already among the early 20th century cohorts, continued among the cohorts that brought
about the baby boom and persisted thereafter. Slightly more than one fifth of all women born in 1910 had two children, whereas this proportion reached almost 40% for the mid-1960s cohorts. The end of the baby boom caused a relatively rapid decline in the proportion of larger families. This trend was particularly pronounced for families with four or more children, whose share fell from 23% in the 1935 cohort to 5% in the 1966 cohort. In parallel, childlessness gradually increased to 18% among this cohort and the trend projection suggests that it is likely to reach 21% for women born in the mid-1970s. Although this is substantially below the childlessness levels recorded among the early 20th century cohorts, these estimates put Austria alongside countries with the
orientation towards a two-child family norm is also reflected in the parity progression ratios shown in Figure 3. Whereas the progression rate to a second birth remained stable and relatively high (above 0.7) among women born during the 1950s and 1960s, progression rates to third and fourth births declined steadily. For the youngest cohort analysed here (1966), only one third of all women having two children eventually had a third child and one quarter of women with three children further increased their family size. In contrast, in the baby boom cohort of 1933, 60% of women with two children had a third child and 55% of women with three children eventually had a fourth child.
Figure 3: Parity progression ratios among Austrian women born 1900-1966
0.0 0.1 0.2 0.3 0.4 0.5 0.6 0.7 0.8 0.9 1.0
1900 1905 1910 1915 1920 1925 1930 1935 1940 1945 1950 1955 1960 1965 Birth cohort
P
a
ri
ty
p
ro
g
re
s
s
io
n
r
a
ti
o
PPR 0-1
PPR 1-2
PPR 2-3
PPR 3-4 series break
1940-41
3.3 Childbearing trajectories of younger cohorts
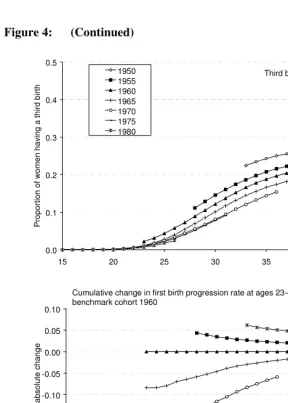
More subtle changes in first, second, and third birth trajectories among women born in 1950-1980 are depicted in Figure 4.9 These women have progressively postponed childbearing and each younger cohort experienced a further decline in cumulated fertility at younger ages. When the 1960 cohort is taken as a benchmark, the cumulated fertility decline among the younger cohorts was largest at ages 24-27 for first births and at ages 26-30 for second births (see the last graph of Figure 4 for first births). Subsequently, most of this ‘deficit’ has been markedly reduced thanks to increasing first and second birth rates among women in their late twenties and older. For instance, almost two thirds of the ‘deficit’ in cumulated first birth rates at the age of 25 for the 1970 cohort (-0.16) has been ‘recovered’ by the age of 36 (‘deficit’ less then -0.06). However, this ‘catching up’ has not been sufficient to counterbalance fully for the fertility decline experienced earlier in life (see also Frejka and Sardon 2004). In addition, the decline in third and higher-order birth rates at younger ages for women born before 1970 has not been compensated later in life, reflecting an increasing orientation towards a small family model.
3.4 Socioeconomic differences in completed fertility and parity distribution
The overall picture of cohort parity distribution hides a number of pronounced socio-economic differentials. Table 1 summarises major differences in completed fertility and parity distribution by place of residence, region of birth, religious affiliation, and level of education among women born between 1955 and 1960. These women had virtually completed their fertility ‘career’ at the time of the 2001 population census and we expect that the very small portion of fertility realised after 2001 will not affect the presented differentials.
9 In this analysis, only fertility histories up to 2006 are included, based on the parity distribution recorded in
Figure 4: Cumulative proportion of women having first, second and third birth by age, cohorts 1950-1980
0 0.1 0.2 0.3 0.4 0.5 0.6 0.7 0.8 0.9
15 20 25 30 35 40 45
P ro p o rt io n o f w o m e n h a v in g a f ir s t b ir th 1950 1955 1960 1965 1970 1975 1980 First birth 0 0.1 0.2 0.3 0.4 0.5 0.6 0.7 0.8 0.9
15 20 25 30 35 40 45
Figure 4: (Continued) 0.0 0.1 0.2 0.3 0.4 0.5
15 20 25 30 35 40 45
P ro p o rt io n o f w o m e n h a v in g a t h ir d b ir th 1950 1955 1960 1965 1970 1975 1980 Third birth -0.30 -0.25 -0.20 -0.15 -0.10 -0.05 0.00 0.05 0.10
15 20 25 30 35 40 45
C u m u la ti v e a b s o lu te c h a n g e 1950 1955 1960 1965 1970 1975 1980 Cumulative change in first birth progression rate at ages 23-45,
benchmark cohort 1960
Source:Authors’ computations based on the database of births in 1984-2006 and Statistics Austria (1996).
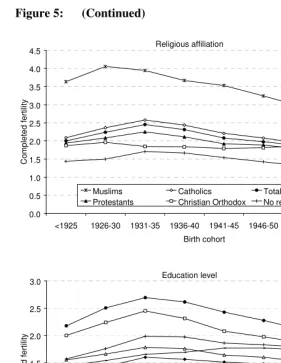
Within Austria, Vienna traditionally stands out as having low fertility and high childlessness levels. One quarter of all women born between 1955 and 1960 residing in Vienna in 2001 were childless, as compared to 16% in the whole of Austria. Furthermore, their completed fertility reached a very low level of 1.43. This is not a new situation; in fact, the contrast between Vienna and the rest of Austria was more marked among the older birth cohorts and Viennese period TFR reached extremely low levels during the 1930s, falling to 0.6 in 1933-34 (Kirk 1946, quoted by Frejka and Sardon 2004). The baby boom was not very pronounced in Vienna and even the ‘fertile’ cohorts of 1931-35 achieved a completed fertility of 1.68, well below the replacement level and substantially below the average for the whole of Austria (2.45). Furthermore, Viennese women born before 1925 had only 1.34 children on average, although their replacement-level fertility was well above the current threshold of 2.1 owing to much higher infant and child mortality in the past (see Figure 5).
Among the foreign-born women, the growing Turkish minority stands out for its high fertility level (3.07 children per woman in the 1955-60 cohorts), very low level of childlessness and high prevalence of larger families. Two thirds of Turkish-born women have three or more children and the progression rate to a third child (0.74) is more than twice as high as that of Austrian-born women, which indicates a very limited popularity of the two-child family model among the Turkish population. Women born in former Yugoslavia have also relatively low childlessness levels, but unlike the Turkish-born women, they display a pronounced orientation towards a two-child family, with 46% having two children.
completed fertility than Protestants. The differences between these two groups have diminished over time.
Table 1: Selected characteristics of completed fertility and parity distribution among women born 1955-1960 by place of residence, country of birth, religious affiliation and highest educational attainment
Childless (%)
1 child (%)
2 children (%)
3+ children
(%) PPR 2-3
Mean number of children per woman
per mother
Share in the total population (%)
Place of residence
All resident women 16.1 23.4 37.9 22.6 0.373 1.77 2.11 100 Vienna 25.3 28.3 31.4 15.0 0.323 1.43 1.92 19.4
Country of birth
Austria 16.4 23.8 38.0 21.8 0.364 1.74 2.08 86.3 EU-15 21.9 22.8 34.3 21.0 0.380 1.64 2.09 2.4 Former Yugoslavia 9.0 18.2 45.6 27.2 0.373 2.05 2.25 4.9 Turkey 4.8 6.9 22.7 65.6 0.743 3.07 3.22 1.6
Religious affiliation
Catholic 13.8 22.3 40.0 23.9 0.374 1.83 2.13 73.7 Protestant 16.0 24.7 39.5 19.8 0.334 1.71 2.03 4.8 Muslim 6.1 10.2 31.9 51.8 0.619 2.71 2.89 3.2 No affiliation 31.0 32.0 27.2 9.8 0.264 1.19 1.73 12.5
Level of education
Tertiary: University 29.8 24.0 32.1 14.1 0.305 1.35 1.93 7.0 Tertiary: Academy
(teachers & social
workers) 18.1 21.2 40.1 20.6 0.339 1.69 2.07 5.2 Higher secondary:
comprehensive grammar school +
practical training 22.3 25.3 35.3 17.1 0.327 1.54 1.98 9.4 Lower secondary:
apprenticeship &
practical training 14.3 25.0 40.0 20.7 0.341 1.74 2.03 48.7 Basic education 13.5 20.2 36.5 29.8 0.449 1.99 2.30 29.7
A look at fertility differences by the highest completed level of education confirms the usual gradient, i.e. lowest childlessness, highest progression rates to a third child and completed fertility close to replacement level among women with basic education, and high childlessness coupled with a low level of completed fertility among women with a university education. In addition, Spielauer (2005) also found large fertility differentials by profession. Women graduating from academies (e.g., teachers training colleges and social worker training) are the main exception from the usual educational pattern. Whereas the older cohorts of academy-educated women had levels of childlessness and completed fertility similar to those of university-educated women, partly due to the importance of religious schools in the education system in the past (Spielauer 2005), younger cohorts born after 1950 have lower childlessness and higher fertility (Figure 5). Their fertility patterns resemble those of women with lower secondary education. Rising educational attainment coupled with the persisting fertility differentials explain part of the observed decline in completed fertility, which has been progressing more rapidly in the whole population than within any of the educational categories except that of women with basic education.
Figure 5: Completed fertility by place of residence, country of origin, religion and education level for women born before 1961
Place of residence and country of origin
0.0 0.5 1.0 1.5 2.0 2.5 3.0 3.5 4.0 4.5
<1925 1926-30 1931-35 1936-40 1941-45 1946-50 1951-55 1956-60 Birth cohort
C
o
m
p
le
te
d
f
e
rt
ili
ty
Austria: all residents
Residents of Vienna
Born in Turkey
Figure 5: (Continued)
Religious affiliation
0.0 0.5 1.0 1.5 2.0 2.5 3.0 3.5 4.0 4.5
<1925 1926-30 1931-35 1936-40 1941-45 1946-50 1951-55 1956-60 Birth cohort
C
o
m
p
le
te
d
f
e
rt
ili
ty
Muslims Catholics Total
Protestants Christian Orthodox No religion
Education level
0.0 0.5 1.0 1.5 2.0 2.5 3.0
<1925 1926-30 1931-35 1936-40 1941-45 1946-50 1951-55 1956-60 Birth cohort
C
o
m
p
le
te
d
f
e
rt
ili
ty
I II. III+IV
V+VI VII. Total
Source:Population census 2001 (Statistics Austria 2005c).
3.5 Period fertility tempo and quantum
The post-war baby boom reached its peak in 1963 and was followed by a pronounced decline in fertility that lasted until the mid-1980s. This decline was primarily driven by the gradual spread of a two-child family model combined with a decline in fertility at third and higher birth orders. The period fertility level has remained relatively stable since the mid-1980s and the shift towards later parenthood has become the most prominent feature of recent period fertility trends.
Figure 6 shows the transformations of age patterns of fertility since 1955. The baby boom had markedly raised fertility rates, especially in the prime childbearing ages. In the following period, fertility rates were declining among older women and childbearing was increasingly concentrated at younger ages. This trend was most clearly visible around 1970, when fertility rates reached the highest levels at ages 21-22. Since the early 1980s fertility rates have declined at younger ages, especially among women below the age of 25, and have gradually increased at older ages. As a result, the peak in fertility rates has shifted to ages 28-30 and has become less pronounced. Overall, fertility rates after 1963 fell most markedly at both ends of a woman’s fertile period, dropping by more than three quarters among teenage women and, until 1990, by a similar order among women aged 40 and older (see Table 2). Consequently, only 4% of all fertility rates were realised by teenage women in 2006, down from 13% in 1970. The mean age of mothers at childbearing exceeded 29 in 2005, the highest level recorded since the early 1950s, despite the strong reduction in higher-order childbearing that usually occurs at late childbearing ages.
Figure 6: Age-specific fertility rates for women aged 15-42; selected years 1955-2006
0 20 40 60 80 100 120 140 160 180 200
15 20 25 30 35 40
Age F e rt ili ty r a te ( p e r 1 0 0 0 w o m e n ) 1955 1963 1970 1980 0 20 40 60 80 100 120 140 160 180 200
15 20 25 30 35 40
Age F e rt ili ty r a te ( p e r 1 0 0 0 w o m e n ) 1955 1980 1990 2000 2006
Table 2: Fertility rates by selected age groups and main indicators of period fertility tempo and quantum, 1951-2006
Sum of fertility rates in age groups (per 1000 women)
Below 20 20-24 25-29 30-34 35-39 40+
1951 216.8 591.7 562.0 356.8 229.7 73.0
1963 279.3 826.9 829.2 531.6 269.6 85.4
1970 293.2 774.5 580.6 380.2 203.2 61.3
1980 173.9 590.0 510.6 253.7 97.8 26.3
1990 101.7 431.9 512.8 288.6 101.9 20.1
2000 67.7 327.7 483.5 336.5 125.7 23.5
2005 64.0 274.4 467.6 399.5 166.9 32.0
2006 60.0 265.4 456.8 412.8 173.7 35.1
Change 1963–2000 –75.8% –60.4% –41.7% –36.7% –53.4% –72.4%
Change 2000–2006 –11.3% –19.0% –5.5% 22.7% 38.2% 49.2%
Share <20 (%)
Share 30+ (%)
Mean age at childbearing
Mean age
at first birth TFR PAP
1951 10.7 32.5 27.55 2.03
1963 9.9 31.4 27.42 2.82
1970 12.8 28.1 26.67 2.29
1980 10.5 22.9 26.26 23.7 (est.) 1.65
1990 7.0 28.2 27.20 24.95 1.46 1.69
2000 5.0 35.6 28.22 26.38 1.36 1.55
2005 4.6 42.6 29.03 27.26 1.40 1.64
2006 4.3 44.3 29.21 27.49 1.40 1.64
Source: Eurostat (2006), Council of Europe (2005) and authors’ computations based on the database of births in 1984-2006 provided by Statistics Austria.
education became mothers at the age of 21.9 on average, whereas women with a university education became mothers at the age of 28.1. Buber (2002) found that highly educated women tend to inhibit childbearing immediately after completing their education as their opportunity costs of childbearing may be particularly high in the early stage of their career. However, their first birth intensity increases markedly soon thereafter, exhibiting a strong tendency of ‘catching up’. Women with tertiary education ‘speed up’ childbearing even more than women with higher secondary education. Sizeable educational differentials in first birth timing also explain the overall increase in the variance in age at entering motherhood among Austrian women (Sobotka 2005a: Table 4). Almost one tenth of first birth rates in 2004 were still realised by teenage women, while the last tenth of first birth rates occurred after age 34, representing a steady increase over the previous two decades.
Figure 7: Selected indicators of the timing of childbearing (1951-2006) and first birth (1984-2006)
22 23 24 25 26 27 28 29 30
1951 1956 1961 1966 1971 1976 1981 1986 1991 1996 2001 2006
A
g
e
Mean age at childbearing
Mean age at first birth
Median age at first birth
3.6 Parity-specific fertility trends since 1984
The lack of data on fertility by birth order for the period prior to 1984 limits our analysis of parity-specific trends to the past two decades, which were characterised by relatively stable fertility rates. Two minor waves in fertility were observed during this period: a modest increase in 1991-92 and again in 2002-04 (see Figure 8). The first peak was more pronounced, with the indicator of total fertility based on parity progression ratios (period average parity, PAP) reaching 1.77, and the progression rates to second, third and fourth births each rising by 7% between 1989 and 1991-92. This rise was, however, short-lived and was followed by a gradual decline in fertility rates during the next decade, when the PAP fell to 1.51 in 1998. The two peaks in fertility coincide with changes in family-related policies and are discussed in more detail in Section 6.2.
Figure 8: Total fertility and parity progression ratios, 1984-2006 1.20 1.30 1.40 1.50 1.60 1.70 1.80 T o ta l fe rt ili ty PAP TFR 0.20 0.30 0.40 0.50 0.60 0.70 0.80 0.90 1 9 8 4 1 9 8 6 1 9 8 8 1 9 9 0 1 9 9 2 1 9 9 4 1 9 9 6 1 9 9 8 2 0 0 0 2 0 0 2 2 0 0 4 2 0 0 6 Year P a ri ty p ro g re s s io n r a ti o s adjusted PPR 0-1 PPR 1-2 PPR 0-1 PPR 2-3 PPR 3-4
series break in 1999
Source:Authors’ computations based on the database of births in 1984-2006 provided by Statistics Austria.
Our findings on period parity-specific fertility in Austria lead to three main conclusions. First, the shift to later parenthood has not yet been associated with a declining propensity of women to give birth to a first and second child. Second, recent period parity progression rates are very similar to the cohort progression rates observed among women born in the mid-1960s (see Section 3.2 above). This signals that a stabilisation of completed fertility and cohort parity distribution can be expected for women born in the late 1960s and in the 1970s. Finally, our analysis suggests that the long-standing decline in the propensity to bear a third child, which was the driving force of the fertility decline until the mid-1980s, has probably ended. It is worth noting that during a recent upward swing in fertility, third birth rates increased more rapidly, specifically by 10% between 2001 and 2005, than the progression rates to other parities (see also Sobotka et al. 2005).
3.7 Fertility among non-Austrian citizens
Table 3: Period TFR of women resident in Austria by citizenship status, 1984-2004
Total fertility rate (TFR)
Period
Austrian citizens
Foreign nationals
Turkish nationals Total
Difference (absolute)
Net impact of ‘foreigners’ on TFR
1984–89 1.43 2.22 3.70 1.46 0.80 0.03
1990–94 1.41 2.21 3.09 1.49 0.80 0.08
1995–99 1.31 2.06 2.63 1.39 0.75 0.09
2000–04 1.29 2.04 2.92 1.38 0.75 0.09
Source:Based on data published in Kytir (2005: 782, Table 8).
3.8 Fertility intentions
Bongaarts’ (2001 and 2002) conceptual framework views fertility as resulting from the intended family size of the population. It is mitigated by a set of factors that reflect unanticipated effects, including competing preferences for a career, marital disruption, ‘celibacy’ and infecundity, unwanted fertility, gender preferences for children, and postponement effects. In conjunction with declining family size preferences, the factors listed above will influence fertility (Goldstein, Lutz and Testa 2003).
Figure 9 shows the completed fertility for Austrian women born between 1950 and 1966 (see also Figure 1) with the mean intended number of children for the cohorts of 1956 to 1979 based on the 2001 Microcensus survey. Besides the possibility that the Microcensus population sample over-represents women with higher fertility and higher intended fertility, the figure suggests a considerable level of unsubstantiated optimism regarding the intended family size among women in their late reproductive years (cohorts born in the mid-1960s), who desired by 0.2 children more on average than they were likely to achieve. The higher level of intended fertility among the younger cohorts born in the early 1970s is less surprising. Such a gap between intended and eventually realised fertility is commonly found in many advanced societies (Bongaarts 2001).
children among women born in the second half of the 1970s may serve as an indicator of a possible further decline in completed fertility, a portion of this trend may be explained by a specific age effect. The analysis of time series of fertility intentions, collected by the Microcensus surveys of 1986, 1991, 1996 and 2001 shows that Austrian women typically have low fertility intentions at young adulthood (below age 25) and later show a slight increase in their fertility desires as they approach the age of 30. Interestingly, women born in the late 1950s already expressed sub-replacement fertility intentions (below two children per woman) when asked in the 1986 survey (Sobotka 2008). This evidence is consistent with the low family-size ideals reported for Austria and Germany by Goldstein, Lutz and Testa (2003).
Figure 9: Completed fertility among women born 1950-1966 and
intended mean number of children among women born 1963-1979
1.0 1.2 1.4 1.6 1.8 2.0 2.2
1950 1955 1960 1965 1970 1975 1980
Birth cohort
C
o
m
p
le
te
d
(i
n
te
n
d
e
d
)
fe
rt
ili
ty
Completed fertility
Intended mean number of children:
Upper bound
Lower bound Medium
Source:Microcensus 2001 for intended family size; cohort fertility data from Figure 1 for completed fertility.
4. Living arrangements and family formation
This section analyses the process of family formation in Austria, which is closely linked to fertility. We focus on leaving the parental household, entering a first union and marriage and discuss how these processes are related to the birth of a first child. We analyse changes in the timing of these events during the past decades as well as the rapid increase in cohabitation. We also outline trends in union dissolutions and divorce in particular and their relation to fertility and the number of children affected by divorce.
4.1 Leaving home and union formation
Leaving home is one of the “crucial nodes of the life course and a crucial event in the transition to adulthood” (Billari et al. 2001: 340), as it implies not only household independence but also greater social autonomy for young people. Like most other western European countries, Austria has early home-leavers, with a median age of 19.9 years for women born around 1960 (Billari et al. 2001). Nevertheless, data for the birth cohorts 1942 to 1986, based on the 2001 Microcensus survey reveal that leaving the parental home before the 20th birthday becomes less common for younger cohorts (Table 4). This trend is related to the increasing length of schooling and training (Landler 1997). The majority of women have left home by the age of 30 and only a few move out later. By the age of 35, one out of ten women still lives with at least one of her parents.
Table 4: Leaving parental home in Austria, women, cumulative percentages
Proportion of women who have left parental home by a given age
Cohorts 0-14 15-19 20-24 25-29 30-34 35+
1982–86 0.5
1977–81 0.8 21.6
1972–76 1.7 33.9 71.6
1967–71 0.7 39.3 76.0 86.8
1962–66 1.7 38.8 76.1 88.4 91.1
1957–61 1.3 39.7 77.0 87.8 90.6 91.6
1952–56 1.4 41.5 79.5 89.0 91.4 92.3
1947–51 2.9 36.3 78.8 86.6 88.7 90.3
1942–46 4.3 31.5 74.3 86.5 89.1 90.5
Source: Microcensus 2001/3; special programme Questions on families 2001, cohorts 1942 to 1986.
Figure 10: Reasons for having left the parental home in Austria
0% 10% 20% 30% 40% 50% 60% 70% 80% 90% 100%
1942-46 1947-51 1952-56 1957-61 1962-66 1967-71 1972-76 1977-81 Others
Problems with family; indendependence Education
Occupation
Nonmarital union
Marriage
Cohabitation is increasingly becoming an alternative to marriage: During the past decades, the importance of marriage as a reason for leaving the parental home has decreased (54% for cohorts 1942-46 and 22% for cohorts 1972-76) while the share of non-marital unions has increased. The disentanglement of union formation and marriage is also reflected by an increasing length of cohabitation (Figure 11, see also Overview Chapter 4). About three quarters of all women born in the 1940s and early 1950s started living with their partners at the time of marriage or married within the first year of cohabitation and nearly nine out of ten women were married two years after the formation of the first union. Women born in the 1960s cohabited for a longer time period. Every second woman married within the first year of cohabitation and, overall, two thirds were married two years after starting living together with their first partner. Living together without getting married was a relatively rare experience for women born in the 1940s, whereas the rule of ‘cohabitation first, marriage later or never’ has become a standard pathway of union formation for the cohorts born in the 1960s and later (Table 5).
Figure 11: Time (in years) between formation of first union and marriage, ever married Austrian women
0% 10% 20% 30% 40% 50% 60% 70% 80% 90% 100%
1942-46 1947-51 1952-56 1957-61 1962-66 1967-71
Cohorts
<1 1-2 3-4 5 and more
Table 5: First union among women born 1941-67 who entered union before age 28 (%)
Birth cohort
1941–45 1946–50 1951–55 1956–60 1961–65 1966–67
‘Direct’ marriage 74.3 66.2 55.0 39.1 32.7 25.1
Cohabitation as first partnership 8.3 14.8 24.9 38.8 49.8 55.0
Did not enter union by age 28 17.4 19.0 20.1 22.0 17.5 19.8
Did not marry by age 28 20.8 20.4 27.0 30.9 37.7 45.3
Source:Authors’ computations based on the Family and Fertility Survey 1996 and Eurostat (2005).
Union formation and family formation are closely linked and the postponement of childbearing goes hand in hand with a postponement of union formation. What the 1942-61 cohorts have in common is an early and fast first union formation. A postponement of union formation first took place among the 1962-71 cohorts, followed by a further postponement for cohorts born in 1972 and later (Figure 12).
4.2 Patterns of marriage
Although young adults live as singles more frequently than in the past, the rapid spread of unmarried cohabitation has had the most prominent impact on the observed decline in marriage rates. As Winkler-Dworak and Engelhardt (2004: 33) point out, cohabitation has both a quantum effect (substitution of marriage) and a tempo effect (postponement of marriage) on marriage rates.
rates10, also dropped to a very low level of 0.60 in 2002-03. The analysis of Winkler-Dworak and Engelhardt (2004) shows that the tempo-adjusted indicators of period first marriage intensity in the late 1990s imply that close to 30% of all women will remain unmarried at age 50. The period mean age at first marriage among women has increased by more than five years since the mid-1970s and reached 28 years in 2004. Cohort indicators show a gradual retreat from marriage among women born after 1948; more than one fifth of all women born in the mid-1960s will remain unmarried when reaching age 50 as compared to 11-12% of those born in the mid-1940s.
Figure 12: Union formation among Austrian women
0 10 20 30 40 50 60 70 80 90 100
<20 20-24 25-29 30-34 35-39 40+
Age groups
C
u
m
u
la
ti
v
e
p
e
rc
e
n
ta
g
e
s
1982-86 1977-81 1972-76 1967-71 1962-66 1957-61 1952-56 1947-51 1942-46
Source: Microcensus 2001/3; special programme Questions on families 2001, cohorts 1942 to 1986. Remark: Dashed lines indicate right censoring.
10 Total first marriage intensity is a summary life table measure based on age-specific first marriage
Figure 13: Period (1950-2005) and cohort (1930-1963) indicators of first marriage intensity in Austria
0.4 0.5 0.6 0.7 0.8 0.9 1.0 1.1 1920 1945 1925 1950 1930 1955 1935 1960 1940 1965 1945 1970 1950 1975 1955 1980 1960 1985 1965 1990 1970 1995 1975 2000 1980 2005 T o ta l fi rs t m a rr ia g e i n te n s it y
Period total first marriage rate
Cohort proportion ever married
Period total first marriage intensity
Cohort Period
Source: Authors’ computations based on Eurostat (2005), Prioux (1993), and Statistics Austria (2006b).
4.3 Divorce11
Austria has relatively high divorce rates and even before the introduction of legal divorce in 1938 it had one of the highest rates of marital breakdown in Europe (Zeman 2003). In 1961 the share of divorced women in Austria was 3.5%, one of the highest levels of all western European countries (Prinz 1995). The period total divorce rate12
was 14% in 1960 and reached 46% in 2004 (Figure 14), indicating that close to one half of newly married couples would sooner or later divorce if the recent duration-specific
11 Owing to lack of data only marital dissolutions are discussed in this article. The Family and Fertility Survey
divorce rates remained stable. Divorce rates are also gradually increasing over time from a cohort perspective. According to the 2001 census 14% of all Austrian women were divorced at age 40 (see Zeman 2003 for a detailed analysis of divorce and marital dissolution in Austria). Divorce rates show a pronounced peak in the third to the fifth year of marriage; the median duration of divorced marriages reached 9.8 years in 2004. This figure was 7.3 years in 1990, indicating that more and more couples who have been married for quite a long time eventually get divorced (Statistics Austria 2005a). Structural trends outside the family system such as women’s higher educational attainments (Landler 1997), increased earnings, the increase in labour force participation (cf. Figure 18) or the growing urbanisation are thought to engender attitudes and values which, in turn, affect family stability.
Figure 14: Total divorce rate for Austria, 1951-2004
0 5 10 15 20 25 30 35 40 45 50
1950 1955 1960 1965 1970 1975 1980 1985 1990 1995 2000 Year
P
e
rc
e
n
t
Increasing divorce rates, but also the spread of cohabitation imply that a growing proportion of children experience a period of living with one parent. In 2000, 11.6% of children aged under 17 lived in one-parent households (OECD 2003: Table 4.2). During the past two decades, the share of divorces involving children irrespective of their age was rather stable at around 65%, and declined for the years 2003 and 2004, suggesting that childless couples increasingly experienced a marital breakdown (Figure 15). In 2004, a total number of 19,590 couples got divorced, of which 39% were childless, 26% had one child, 26% two and 9% three or more children (Statistics Austria 2005a). Among the 21,048 children affected by the divorce of their parents in 2004, 58% were below the age of 14. The study of Heuveline et al. (2003), based on the Family and Fertility Survey (FFS) data for to the early 1990s, estimates that 40% of all children go through a period of living with a lone parent before reaching the age of 15. Children born to cohabiting parents in Austria face a 2.2 times higher risk of parental separation than children born to married parents.
Figure 15: Total number of divorces and divorces with children in Austria, 1980-2004 0 5.000 10.000 15.000 20.000 25.000
1980 1982 1984 1986 1988 1990 1992 1994 1996 1998 2000 2002 2004 Year T o ta l n u m b e r o f d iv o rc e s 0% 20% 40% 60% 80% 100% P e rc e n ta g e o f d iv o rc e s w it h c h ild re n All divorces Proportion with children
Source: Statistics Austria 2001, Statistics Austria 2005a.
4.4 Partnership context of childbearing
Changes in the patterns of union formation and living arrangements have strongly affected the partnership context of childbearing and childrearing, particularly in the case of first births. Table 6 provides an overview of partnership status around the time of the first birth for women born between 1941 and 1967 based on the FFS survey conducted in 1996.13 It is striking that a high and relatively stable proportion of women were unmarried and did not live with a partner at the time of first childbirth: around one fifth of first births occurred to non-cohabiting single mothers. The proportion of all children born to single mothers is also high. With 14 % of all children born to single mothers, Austria ranked third after the United States (16%) and Germany (15%) among the 17 countries analysed by Heuveline et al. (2003). Arguably, some single mothers had partners and intentionally kept a separate residence in order to qualify for the higher parental leave payments that were only granted to mothers who live alone. These higher payments were also granted to cohabiting and married mothers if their partner was unemployed, had no (or only a low) income or if the household income was low. This explains partly why in some poorer regions of Austria suffering from high unemployment rates (such as Styria) higher parental leave payments were more common.
The proportion of women having their first child in a cohabiting union has increased from 2% among the 1941-45 cohorts to 18% among the 1966-67 cohorts, exceeding thus the proportion of first births to single mothers. Furthermore, the initially high proportion of cohabiting parents who marry within two years has declined over time, indicating a rising permanency of cohabitation.14 In contrast, the share of single mothers who entered marriage after the birth of their first child shows an increasing tendency: one half of all single mothers born between 1961 and 1965 married within two years and another 13% started cohabiting. The indicator of premarital conceptions further shows the growing importance of cohabitation. Whereas the overall proportion of births conceived before marriage has gradually declined, progressively more children were conceived while the partners cohabited.
13 In order to make a comparison with the cohorts born in the 1960s, only women who became mothers before
reaching the age of 28 are included in the analysis (the youngest cohort analysed, 1967, was aged 28 at the time of the FFS survey).
14 Heuveline and Timberlake (2004: 1226) note a high proportion of cohabiting couples in Austria, who have
Table 6: Partnership status at first childbirth (%); women born 1941-1967 who became mothers before age 28
Birth cohort 1941
–45
1946
–50
1951
–55
1956
–60
1961
–65
1966
–67
Marriage total 56.9 54.2 47.2 38.7 37.9 37.9
Of which: total premarital conception (%) 41 43 41 35 39 36
conception when cohabitating (%) 3 5 8 9 18 22
Cohabitation total 1.9 2.7 5.9 10.8 14.0 17.5
Of which: married within 2 years (%) 44 67 59 46 40
Single total 18.9 20.8 21.1 20.2 19.6 15.1
Of which: married within 2 years (%) 34 43 43 46 51
Of which: cohabiting within 2 years (%) 2 3 6 5 13
No child by age 28 22.3 22.4 25.8 30.4 28.5 29.6
Total conceptions extramarital (%) 57 60 62 64 68 66
Source:Authors’ computations based on the Family and Fertility Survey 1996.
Compared to other European countries, the stepfamily formation in Austria is at a medium level (cf. Prskawetz et al. 2003, Vikat et al. 2004). According to a grouping of European countries by patterns of combined union and childbearing careers it has been found that stepfamily experience is most common in Sweden and the former socialist countries of central Europe, i.e. the Czech Republic, former GDR (East Germany) and Hungary. However, the underlying patterns of demographic behaviour were different. In the former socialist countries, stepfamilies were widespread since most of the women living in their second unions had children from their first unions. In Sweden dissolved first unions were among the least likely to have offspring, but their high number results, nevertheless, in a high rate of stepfamily formation.
4.5 Non-marital childbearing
Austria’s tradition of extramarital childbearing dates back to the 17th and 18th centuries (Kytir and Münz 1986, Haslinger 1982, Mitterauer 1985). During most of the 20th century, Austria had the highest non-marital birth rate in Europe and has only been overtaken by the Nordic countries (especially Sweden, Denmark and Iceland) since the 1970s. As other developed countries, Austria has experienced a rapid increase in the proportion of children born outside marriage since the mid-1960s, when the percentage of extramarital births dropped to 11-12%, the lowest level since the beginning of modern statistical recording in the early 19th century (Haslinger 1982)15. Especially first births commonly occurred before marriage and even in the ‘golden era’ of marriage in the 1950s and 1960s, around one quarter of first births were extramarital (Figure 16; estimates by Kytir 1993). The rapid rise in extramarital childbearing started in the late 1970s and, with a brief interruption in the mid-1980s, continued until 2006, when 37% of all children and one half of all first children were born outside marriage. The recent spread of extramarital childbearing was not limited to first births; Figure 16 documents a threefold rise in the proportion of extramarital second births between 1984 and 2005.
15 The proportion of extramarital births in the period 1819-1913 was computed by Gisser (1979) for the
Figure 16: Proportion of children born outside marriage, 1950-2005 (%)
0 10 20 30 40 50
1950 1955 1960 1965 1970 1975 1980 1985 1990 1995 2000 2005
E
x
te
m
a
ri
ta
l
b
ir
th
s
(
in
p
e
rc
e
n
t)
First births
Total
Third and later births Second births
Source: Authors’ computations based on the database of births in 1984-2005 provided by Statistics Austria, Statistics Austria 1988, and Kytir (1993) for first births in1950-1980.
Figure 17: Proportion of first births (born and conceived) by marital status, 1950-2005
0% 10% 20% 30% 40% 50% 60% 70% 80% 90% 100%
1950 1960 1970 1980 1990 2000 2005
P
ro
p
o
rt
io
n
o
f
fi
rs
t
b
ir
th
s
Extra-marital
Marital, premarital conceptions
Marital, marital conception
Proportion of extramarital conceptions resulting in marriage
Source:Authors’ computations based on the database of births in 1984-2005 provided by Statistics Austria, Kytir (1993) for the period 1950-1980.
Note:Conception is considered premarital if the marriage took place within eight months preceding childbirth.
4.6 Abortion
report abortions. Hence, no reliable numbers on abortions are available. Abortions at public hospitals or at publicly financed hospitals are reported in the hospital statistics and indicate the lower threshold for the number of abortions. Estimates range from 19,000 to 25,000 abortions per year (Tazi-Preve and Kytir 1999).
5. Trends in socio-economic determinants of fertility
5.1 Female labour force participation and fertility
In this section we review relevant studies that have investigated the role of children and in particular childcare costs on the labour market participation of women in Austria. Engelhardt and Prskawetz (2004) give a thorough discussion of the theoretical approaches aimed at explaining the relationship between fertility and female employment.
Considering the change in the female labour force participation (FLP)16 and total
period fertility rate over time (Figure 18) high levels of period TFR in the early 1950s typically went along with relatively lower levels of FLP (52% in 1960). The continuous decrease in TFR in the 1960s and 1970s to a level of 1.7 in 1976 was followed by a further decline in FLP to 47.5% in 1976. Thereafter, the FLP in Austria steadily increased, with 65% of all women participating in the labour force in 2003. However, the employment rates of women remain markedly differentiated by education. Whereas only 47% of women with lower than secondary education participated in the labour force, this proportion was 82% for women with tertiary education (OECD 2003: 38). The increase in FLP since the late 1970s has been favoured by a shift of production towards the tertiary sector where women have contributed 61% of the total increase in the labour force (Wernhart 2005: 5). Age-specific patterns of FLP (Figure 19) reveal that the increase has mainly occurred in the age groups 25 to 54, while labour force participation has decreased at older and younger ages during the past decades. Increasing eligibility for pension payments and longer education can explain these trends in the higher and lower age groups, while higher education increases the labour force participation in the age groups 25 to 54.
16 The female labour force participation rate is defined as the number of females working part or full time or
15-Among the European Union (EU) member states, Austria has one of the highest labour force participation rates for young women, while the old-age FLP is amongst the lowest. As a consequence, the overall FLP rates hover around the average levels for all EU members. As discussed in Biffl (2006), the higher FLP in Nordic countries, the United Kingdom and the Netherlands can be explained by the fact that unpaid work within the family is often ‘outsourced’, in particular child support and care.
Figure 18: Female labour force participation and period total fertility rate, 1960-2003
1.0 1.4 1.8 2.2 2.6 3.0
1960 1965 1970 1975 1980 1985 1990 1995 2000 2005
Year
T
F
R
45 50 55 60 65 70
F
L
P
TFR FLP
Figure 19: Age-specific female labour force participation, 1976-2004, selected years
0.0 0.1 0.2 0.3 0.4 0.5 0.6 0.7 0.8 0.9 1.0
15-19 20-24 25-29 30-34 35-39 40-44 45-49 50-54 55-59 60-64 65+ 1976 1980 1990 2000 2004
Source: WIFO (Austrian Economic Research Institute).
Note: Age specific labour force participations are only available for age groups 15-24 and 25-49. Therefore the same values for age groups 15-19 and 20-24 and respectively five times the same value for age groups 25-49 have been plotted.
A multivariate econometric analysis that regresses the labour force participation and the number of weekly hours worked on a set of economic and socio-demographic variables for 1987 and 1997 yields several interesting findings. For instance, the number of children has the expected and strongly negative effect on the labour force participation of women, indicating that childrearing is still a predominantly female obligation in Austria. A child aged 0 to 3 reduced a woman’s probability of participation in the labour market by 34% in 1997. This effect is closely linked to a relatively generous and long period of parental leave, encouraging parents to provide full time childcare when a child is very young (Section 6; OECD 2003). These negative effects weaken when the children are older. Having a child aged 16 to 18 only lowers a woman’s probability to work by 6%. However, children have a positive effect on the labour force participation of men, though at a much lower absolute level when compared to the effects recorded for women. In summary, the findings of the study by Wernhart (2005) support the hypothesis that an increase in female labour force participation may be related to a declining share of females with children and that it may be characterised by an increasing share of part-time work among females.
The re-entry of mothers into the labour force has been analysed in several studies. Based on the Austrian FFS survey in 1996, Neuwirth (2002) and Nowak and Pfeiffer (1998) studied the entry of mothers into the labour force after the birth of their youngest child. The findings indicate that younger cohorts (those born since the 1950s up to 1969) re-enter the labour market at a higher rate as compared to mothers born before 1950. The re-entry rate declines with the number of children and increases with the age of the child. Owing to the long period of parental leave and lack of childcare facilities, the rate for re-entering the labour force is about twice as high for mothers with children aged two or above as compared to mothers with children below the age of two. According to the employment status before childbirth, blue-collar and white-collar workers re-enter the labour market at a significantly higher rate compared to self-employed women.17 Return rates are higher for white-collar workers than for blue-collar workers.
As in other developed countries, childcare costs and low availability of public childcare are negatively linked to the employment rates of women (OECD 2003). Mahringer’s (2005) study, using data from the 1995 Austrian Microcensus suggests that the elasticity of labour force participation of women with children below the age of 15
17 The fact that self-employed women re-enter the labour market at a lower rate might be caused by a
is high with respect to both wages and childcare costs.18 Consistent with the theoretical considerations, Mahringer finds a significantly negative employment elasticity of childcare costs and a positive elasticity of female wages. The size of the average impact of an increase in net wages is about the same as that of a reduction of childcare costs by the same amount. Since the findings also indicate that an increase in family income reduces the probability of mothers’ employment, it may be concluded “… that policies to support the availability of affordable childcare are more effective than direct transfers to families with regard to the goal of increasing female labour-market participation” (Mahringer 2005: 28). However, government spending in Austria is primarily focused on direct transfers; consequently, Austria “spends considerably more on maternity and parental leave payments (…) than on childcare services” (OECD 2003: 131).
Lutz (2003a) analyses the consequences of the introduction of childcare benefits (paid as an allowance to families instead of parental leave benefit granted under the previous scheme in the form of an insurance benefit) for children born since 1 January 2002. As summarised in Lutz (2003a: 227), the group of eligible persons is larger under the new scheme, the maximum period of entitlement has been prolonged by one year and the beneficiaries are allowed to earn additional income. Contrary to the intended effect, the new scheme has not succeeded in making work and family more compatible, although it has improved the financial situation of young parents. Lutz (2003a) states that “the percentage of women returning to the labour market before their children reach the age of 2¼ has dropped from 54 percent to 35 percent.” At the same time, the estimated average duration of parental leave actually taken has increased from 65 to 110 weeks, potentially making the return of mothers to the labour market more difficult (OECD 2003).
Hoem et al. (2001b) studied the reverse correlation (i.e., whether women’s labour force participation has inhibited childbearing) for third birth intensities, and Prskawetz and Zagaglia (2005) did so for second birth intensities using Family and Fertility Survey data for 1996. Both studies found that respondents with a stronger attachment to the labour force have significantly lower second and third birth intensities as compared to women with lower labour force attachment. The difficulty of combining motherhood and labour force participation in Austria may explain these results.
18 In economics, the elasticity of labour force participation measures the responsiveness of the labour force