Avoiding Middle-income Trap in Muslim Majority Countries: The Effect of Total Factor Productivity, Human Capital, and Age
Dependency Ratio
Seyyed Hossein Mirjalili1 Amin Mohseni Cheraghlou2 Hossein Sa'adat3
Abstract
In 2010, the World Bank categorized countries in per capita gross domestic product in terms of purchasing power parity (at constant 1990 prices) in three categories: low, middle (lower and upper) and high income. If a country caught at least 28 years in lower middle income level and at least 14 years caught in upper middle-income level, then they are trapped in lower middle and upper middle income traps respectively. The growth of per capita GDP or economic growth, is a factor in avoiding middle income trap. We examined the effect of total factor productivity, human capital and age dependency ratios on GDP per capita growth and the avoidance of middle income trap during 1991 - 2014 for ten Islamic countries, using panel data and constant effects estimation. The findings indicate that human capital and then total factor productivity have positive and significant relationship with per-capita GDP and have the greatest impact on economic growth and the avoidance from middle income trap. If the ratio of age dependency is high, it has a positive and significant effect on economic growth and can keep the country in the middle income trap.
Key words: middle income trap, Islamic countries, total factor productivity, human capital, age dependency ratio.
1. Introduction
Since the 1950s, a significant number of countries have achieved middle-income level by rapid growth and few countries have been able to turn into high-income economies. However, many developing countries trapped in middle-income level, which is characterized by the slowdown in growth and the slowdown in productivity growth. The definition of middle-income trap is: sustainable economic equilibrium with low growth
1Associate Prof., Faculty of Economics, Institute for Humanities and Cultural Studies, Tehran,
in which talents are not allocated efficiently and innovation is in recession (Flipe et al., 2012).
In fact, at the middle-income level, economic growth and structural upgrading become more difficult which is recognized as middle-income trap (Jankowska et al., 2012). There are four income groups based on per capita GDP in purchasing power parity at a base price of 1990: low income which is below $ 2000; lower middle-income between $ 2000 and $ 7250; upper middle-income between $ 7250 and $ 11750; high-income from $ 11750 and more.
The threshold for the number of years indicating the trap of a lower and upper middle-income country is 28 and 14, respectively. That is, if a country is caught for at least 28 years in the lower middle-income and for at least 14 years in the upper middle-income level, then it is trapped in lower and upper middle-income traps, respectively. This means that a lower middle-income country needs to have an average annual growth rate of at least 4.7 percent per capita income to prevent being trapped in the middle-income level and a country in the upper middle-income group needs to have an average annual growth rate of GDP per capita of at least 3.5% to avoid this trap (That is, to reach $ 11750, the threshold for high-income level). The phenomenon of middle-high-income trap affects most countries in Africa, the Middle East and Latin America (Flipe et al., 2012). Middle-income trap may be the most important challenge facing many developing countries. Over the past 50 to 60 years, there have been few countries in the world that were able to reach high-income level, such as Japan, South Korea and Taiwan in East Asia (Flipe et al., 2012). In this research, due to the limited availability of data, we examine the phenomenon of middle-income trap in 10 Muslim majority or OIC member countries.
Country
Year of transition to
LM*
Year of transition
to UM**
Number of years trapped
in LM
Average growth rate of GDP per capita (% per
annum)
Côte d'Ivoire 1978 --- 36 0.3
Egypt 1980 --- 34 2.2
Indonesia 1986 --- 28 3.5
Iran 1959 --- 58 2.4
Iraq 1953 --- 61 1.1
Jordan 1956 --- 58 1.3
Malaysia 1969 1996 27 3.5
Morocco 1977 --- 37 2.3
Tunisia 1972 --- 42 2.9
Turkey 1953 2005 52 2.8
Source: Maddison Project and Research Calculations *Lower Middle income **Upper Middle income
As can be seen from Table 1, among ten OIC member countries, only Malaysia has been able to avoid lower middle-income trap by catching 27 years in this level and reach a high-income group. Other countries have spent at least 28 years being in this category by 2014 and have thus far been trapped in this category. Turkey also achieved an upper middle-income level in 2005, but spent 52 years in the lower middle-middle-income level. The question now is, what are the determinants of avoiding middle-income trap, given Malaysia's experience in this regard?
This study, using panel data and fixed effects estimator, and taking advantage of Malaysia's experience as the only successful OIC member country to avoid middle-income trap among ten OIC member countries under study, examines the factors affecting middle-income trap and economic growth.
This paper is organized in six sections. After the introduction, in the second section, we introduce the concept of middle-income trap. In the third section, we discuss the determinants of avoiding middle-income trap. In section four, literature review is provided and in the fifth section, empirical model estimation and findings are expressed. Section six conclude the discussion.
The transition of countries through stages of economic development often happens from low-income to middle-income and to high-income groups. However, in some cases, countries in lower or middle-income groups are trapped for a long period of time in low or middle-income group (Spence, 2011, Chapter 16).
Over the past two and a half decades, some countries that have managed to pass through middle-income level have not yet been able to upgrade to a high-income group. As a result, these countries are trapped in middle-income level (Flipe et al., 2012).
According to the Asian Development Bank (2011, 501), countries in the middle-income trap are those that are unable to compete with low-wage economies in industrial exports and with advanced economies with high-level skill innovation. Such countries cannot move from resource-intensive growth with low-cost capital and labor to productivity-intensive growth. According to Agenor et al. (2012, 1), middle-income trap is a stable, low-growth economic equilibrium in which talents are allocated inefficiently and innovation is in recession. The middle-income trap is in line with mainstream economic growth theories through which we can analyze the phenomenon of economic growth in certain stages.
The meaning of avoiding middle-income trap is how much and how fast we can grow to pass through low middle-income level up to 28 years (which requires an annual growth rate of at least 4.7% per annum); and from the upper middle-income up to 14 years (which requires a growth rate of at least 3.5% per year).
In order to prevent the middle-income trap, countries must find new ways of increasing productivity. Three factors contribute to productivity growth: skills acquisition, access to infrastructure and access to the external knowledge network, which makes positive impact on the performance of employees with higher education.
In this section, we examine the effect of total factor productivity, human capital index, as well as the age dependency ratio on avoiding middle-income trap and enhancing economic growth.
3. The Determinants of Avoiding Middle-Income Trap 3.1. Total Factor Productivity Levels
institutions to strengthen the private sector, investment in infrastructure and regional integration (Aiyar et al., 2013 ), the high share of exports of high-tech products, high quality secondary and tertiary education (Eichengreen et al., 2014), R&D investment, advanced infrastructure to accelerate innovation, enforce property rights and the reduction of labor market imperfections (Agenor & Canuto, 2015).
In Kharas et al. (2011), to avoid middle-income trap, countries should focus on total factor productivity growth. This requires major changes from elementary to higher education. Advanced secondary and higher education is needed to equip the workforce with skills for producing ideas and developing new technology for the changing world (Goay Dik Xon et al., 2013).
Aiyar et al. (2013) found that the slowdown in total factor productivity in the middle-income countries is far higher than in low and high income countries. They considered the structural, institutional, economic, and political factors of the slow pace. The Total Factor Productivity (TFP) indicates how inputs are turned into final product. Total factor productivity cannot be directly measured. It is the residual of the product that cannot be described by labor and capital (Comin, 2008). In Cobb-Douglas production function Y = A ∙ Kα ∙ L1-α (where Y is product, and K and L are capital and labor inputs), total factor productivity growth can be captured by the growth rate of parameter A. Given the neoclassical growth theory, especially the Solow model, the growth of the total factor productivity (as technology change) is the main source of long-term economic growth. There are other models that focus on explaining the effects of technological change (and, consequently, on the total factor productivity, such as Glawe and Wagner (2017)).
Therefore, the high growth rate of total factor productivity can help to avoid middle-income trap, and middle-income trap is correlated with decreasing total factor productivity growth.
3.2. Human Capital Index
The literature on middle-income trap considers human capital and educational system to be determinant for overcoming middle-income trap (for example, Jimenez, Nguyen and Patrinos (2012), Jitsuchon (2012), Egawa (2013), Eichengreen, Park and Shin (2014); Yilmaz (2014)).
In the discussion on the role of human capital in middle-income trap, the literature distinguishes between the quantity, quality, and types of skills or training as well as access to education. For example, Eichengreen, Park and Shin (2014) argue that the slowdown in the growth rate in countries where the major share of the population has a minimum level of secondary education is less likely.
In addition, the authors emphasize on the importance of high-quality human capital with skilled workers for moving toward high value-added activities (Eichengreen, Park and Shin, 2014) and successful management of structural change (Tho, 2013, 110). Similarly, Flaaen, Ghani and Mishra (2013), who specifically refer to the Malaysian skills, emphasize the need to develop a secondary and higher education system in order to provide graduates with the skills required by employers. Jimenez, Nguyen and Patrinos (2012) argue that for a middle-income country, ensuring access to education for a large segment of the population is important to create a strong middle class and to combat inequality. According to Egawa (2013), improving access to secondary education is a key factor in avoiding middle-income trap.
Countries avoiding the trap indicate higher levels of primary, secondary and tertiary education and in terms of the number of inventions are totally different. For those countries avoided the trap, among the lower middle-income countries, higher education is more important, while for the countries avoided the trap, among the high middle-income countries, inventions is more important. These findings suggest that the quality of education is more important at middle-to-high levels of income, which suggests that passing from middle to high-incomes level should be stimulated by the growth of innovation (Bulman et al., 2014).
3.3. Age Dependency Ratio
According to Egawa (2013), the factor that give rise to middle-income trap is the population's indicators of a country, such as the fertility rate and its dependency ratio. In this regard, Aiyar et al. (2013) indicated that the dependency ratio significantly affects the slowdown of growth.
If the birth rate is high and the mortality rate is low, then the dependency ratio will be high and the number of people in the fertility age will decrease. Such a decrease may reduce savings and will also reduce national income. Dependency ratios vary in some developed and developing countries. A number of developing countries, such as the Philippines, India and Indonesia have a dependency ratio of over 50%. Some developed countries also have a high dependency ratio. For example, Japan and Britain are developed countries with high dependency ratios.
However, there is a difference between the dependency ratio of developing countries and developed countries. In general, developed countries have dependency ratio in the unproductive ages, while developing countries have dependency ratio in the productive ages. In fact, dependency ratio is a comparison between unproductive ages (less than 15 years and over 64 years) and productive ages (15-64 years). The high dependency ratio can inhibit economic growth, since the number of unproductive people, who depend on them, is more than the number of productive people. Demographic factors indicate that fertility levels and high dependency ratios may create middle-income trap which happen mostly in the developing countries. Low skilled workers make high dependency ratio (Lubis and Saputra, 2015).
The higher age dependency ratio can increase the slowdown in growth and is associated with low saving rates and low labor participation rates (Eichengreen, Park & Shin, 2011). Low dependency ratio leads to faster growth (Bulman, Eden and Nguyen, 2014).
4. Literature Review
Farah (2016), seeks to identify the existence of middle-income trap and its determinants, using the panel of 145 countries over 55 years. The findings indicate that the determinants of growth in the middle and high-income levels are different, and middle-high-income countries need to change their growth strategies in order to move to high-income level.
institutions are essential to promote efficient markets and private sector development, leading to increased productivity, investment, and industrialization. In addition, he points out that improved infrastructure and education were the main drivers for avoiding middle-income trap in South Korea.
Lubis and Saputra (2015), examine the middle-income trap in China, India, Indonesia, Malaysia, the Philippines and Thailand. The effects of some variables determining per capita income, such as government spending, investment costs, high-tech exports, human capital factors (such as enrollment rates in secondary and tertiary education), and dependency ratios were analyzed using factor analysis and regression. Research findings indicate that some variables, such as government expenditures, investment costs, high technology exports and human capital factors, have a positive effect on per capita income growth, and the dependence ratio has a negative effect on per capita income.
Cai (2012) indicates that China will face a challenge due to changing population structure, changing lagged models and growing resources after the middle-income stage. He proposes to improve the total factor productivity, human capital accumulation and reform deepening.
Jitsuchon (2012) considers low quality education, weakness of skills training, low level of research and development activities, and incomplete structure of the tax system, including the factors causing middle-income trap in Thailand. In order to get out of this situation, the Thai government must act by directing the incentive system, providing public research, creating infrastructure and tax benefits to implement innovations and R&D activities.
Zhang et al. (2013) examines the possible roots of China's inequality, which is associated with China's low investment in human capital. They discuss structural and institutional barriers that prevent many students (and their parents) from attending school to learn and to prepare them for employment. They also identify food and health problems which continue to weaken human capital in the poor rural areas of China, making it hard to tackle inequality.
5. Model Estimation
TFP is the level of Total factor productivity.
HC is Human Capital Index based on years of schooling and returns to education.
ADR is the ratio of age dependency. Also, D is a dummy variable that for Malaysian data is set to one and for other countries set to zero. For all independent variables, the dummy variables are DTFP, DHC, and DADR to examine the difference in coefficients and comparing Malaysia to other countries.
Data on per capita GDP have been extracted from Maddison's database, but since data were available up to 2010 and the study period is until 2014, we utilized the growth rate of GDP per capita data at the constant 2011 price level which is available up to 2014 in the World Development Indicators in order to calculate the last 4 years. Also, TFP data extracted from the Federal Reserve database, HC from the Penn world tables and ADR extracted from the World Development Indicators database.
The first model, which includes 10 Islamic countries other than Malaysia, is specified as follows:
Ln GDP it =
i = 1,…,9 t = 1991,…,2014
By this model, we estimate the effect of each explanatory variable on the GDP per capita by estimating the coefficients for the Islamic countries. In the next model, by adding Malaysia, we can compare and provide policy recommendations.
In the second model which comprises 10 Islamic countries including Malaysia, we utilized dummy variables to compare the coefficients for Malaysia and nine other countries. The second model specified as follows:
i = 1,…,10 t = 1991,…,2014
Where Xit is a column matrix including the explanatory variables
mentioned in the previous sections for 10 countries, and DX it is the column matrix as the product of the dummy variables times the explanatory variables for the countries. 1 is a row matrix including
estimated coefficients for Islamic countries and 1 is also a line matrix
root (non-stationary variables) and the hypothesis on the absence of the unit root of the variables (stationary variable).
Table 2: Levin, Lin and Chu unit root test results for variables in the first model
Variable Test statistic P-value Result (level)
Ln GDPt -1.4613 0.0720 Rejects H0 hypothesis (10% level)
t
TFP -2.8611 0.0021 Rejects H0 hypothesis (5% level)
t
HC -2.0625 0.0196 Rejects H0 hypothesis (5% level)
t
ADR -7.7798 0.0000 Rejects H0 hypothesis (5% level)
Source: Research calculations
Table 3: Levin, Lin and Chu unit root test results for the variables in the second model
Variable Test statistic P-value Result (level)
Ln GDPt -1.6038 0.0544 Rejects H0 hypothesis (10% level)
t
TFP -2.8454 0.0022 Rejects H0 hypothesis (5% level)
t
HC -2.2370 0.0126 Rejects H0 hypothesis (5% level)
t
ADR -7.5011 0.0000 Rejects H0 hypothesis (5% level)
Source:Research calculations
As the results of Tables 2 and 3 indicate, the dependent variable, i.e logarithm of GDP per capita at 10% level and explanatory variables are all significant at 5% level and hence are stationary variables, and the variables mentioned can be at a level and not spurious regression.
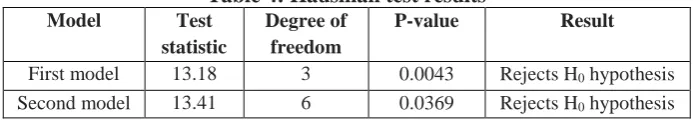
Hausman's test is used to select between constant and random effects, in which its zero hypothesis is the method of random effects and the opposite hypothesis is also a constant effect method. The results of the Hausman test are summarized in table (4).
Table 4: Hausman test results
Model Test
statistic
Degree of freedom
P-value Result
First model 13.18 3 0.0043 Rejects H0 hypothesis
Second model 13.41 6 0.0369 Rejects H0 hypothesis
Source:Research calculations
Therefore, according to the results of Table (4), the H0 hypothesis is
rejected for the first and second model, and the estimation of these two models is based on the fixed effects method.
For identifying the co-linearity, we utilized correlation coefficients between explanatory variables. If the correlation coefficients are relatively large, this indicates a relatively high correlation. In table (5), the correlation coefficients between the variables are given for the correlation identification:
Table 5: Correlation coefficients of variables
Ln GDP TFP HC ADR
Ln GDP 1.0000
TFP 0.2529* 1.0000
HC 0.5502* 0.1689* 1.0000
ADR -0.8112* -0.1261 -0.4553* 1.0000
Source:Research calculations * It is significant at 5% level
If for a regression equation, the coefficient of correlation between explanatory variables is greater than √ R2, then there it is a strong linearity.
Therefore, by comparing √ R2 for models (1) and (2), which were obtained 0.84 and 0.86, respectively, and the results of Table 5 for correlation coefficients we can ignore co-linearity in this case.
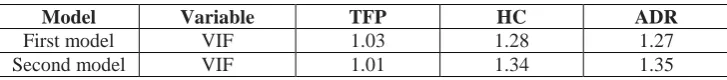
Also, one of the common ways to examine the existence of co-linearity between variables is Variance inflation factor (VIF) in which whatever increases in the variance inflation, it causes the increase of the variance of the regression coefficients and make the regression inappropriate for prediction. The variance inflation factor for the variable is equal to:
In which 1-R2 indicates the variations of each explanatory variable, independent of other explanatory variables of the model.
Therefore, the smaller its share, the more likely the co-linearity of the model will be. The VIF results for each model are illustrated in table (6).
Table 6: Value of VIF for the first and second models
Model Variable TFP HC ADR
First model VIF 1.03 1.28 1.27
Second model VIF 1.01 1.34 1.35
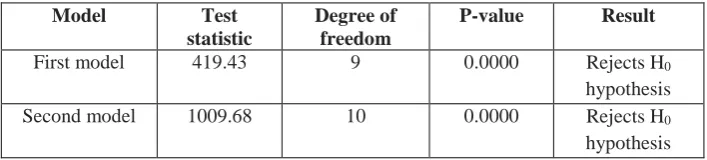
As indicated in Table 6, all values are below 10, so there is no linearity between variables. For these two models, we run the Wald test to identify the variance heterogeneity of the fixed effects. In this test, the null hypothesis is variance homogeneity and the opposite hypothesis is the variance heterogeneity.
The results of this test are presented in Table (7).
Table 7: Wald test results for variance heterogeneity for fixed effects
Model Test
statistic
Degree of freedom
P-value Result
First model 419.43 9 0.0000 Rejects H0
hypothesis
Second model 1009.68 10 0.0000 Rejects H0
hypothesis
Source:Research calculations
Table (7), illustrates variance heteroskedasticity of the error terms for both the first and second models. Thus for both models, fixed effects model with variance heteroskedasticity is not rejected. Therefore, at the time of estimating both models, the generalized least squares method (xtgls) and the unrestricted model should be used.
Wooldridge autocorrelation test is used to determine the auto-correlation. Zero hypothesis is the lack of auto-correlation and the opposite hypothesis is the existence of auto-correlation.
Table 8: Test results of autocorrelation
Model Test
statistic
Degree of freedom
P-value Result
First model 9.019 8 , 1 0.0170 Rejects H0
hypothesis
Second model 9.859 9 , 1 0.0119 Rejects H0
hypothesis
Source: Research calculations
As Table (8) illustrates, zero hypothesis on the absence of first-order serial correlation, has been rejected for both models. Therefore, both models have first order serial correlation which needs to be taken into account in the model estimation.
variance heteroskedasticity and auto-correlation. Estimation results illustrated in table (9) and (10) for both models.
Table 9: Estimation results for the first model by the fixed effects method with variance heterogeneity and auto-correlation (FGLS)
Variable Coefficient P-value (at 5% level)
C 8.35 0.000
TFPit 0.33 0.000
HCit 0.36 0.000
ADRit -0.02 0.000
R2 0.71 ---
ᵡ2 test statistic 301.45 0.0000
Number of observations (NT)
216 ---
Source: Research calculations
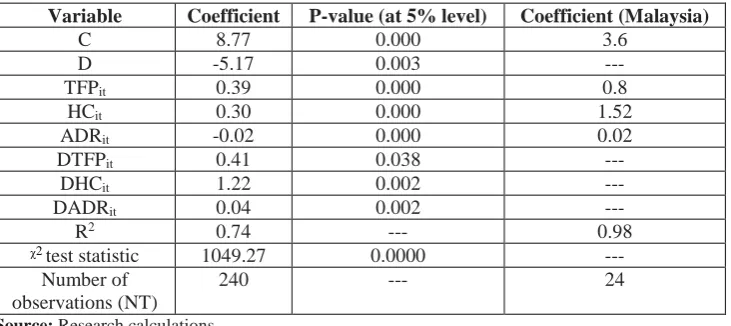
Table 10: Estimation results for the second model by the fixed effects method with variance heterogeneity and auto-correlation (FGLS) Variable Coefficient P-value (at 5% level) Coefficient (Malaysia)
C 8.77 0.000 3.6
D -5.17 0.003 ---
TFPit 0.39 0.000 0.8
HCit 0.30 0.000 1.52
ADRit -0.02 0.000 0.02
DTFPit 0.41 0.038 ---
DHCit 1.22 0.002 ---
DADRit 0.04 0.002 ---
R2 0.74 --- 0.98
ᵡ2 test statistic 1049.27 0.0000 ---
Number of observations (NT)
240 --- 24
Source: Research calculations
Table 10 indicates that in Malaysia, total factor productivity has a positive and significant effect on GDP per capita growth, and with one unit increase of TFP, GDP per capita growth will increase by 0.8%. Human capital index has a positive and significant effect on GDP per capita growth, and with one unit increase of Human Capital, GDP per capita growth increases by 1.52%. Finally, the ratio of age dependency also has a positive and significant effect on the GDP per capita growth, and with one percentage point increase of age dependency, GDP per capita growth increase by 0.02%.
6. Conclusion
The human capital index and total factor productivity level respectively, have the greatest effect in helping countries avoid middle-income trap. Estimation coefficients indicate that the effectiveness of these factors on Malaysia's avoidance of middle-income trap has been high, and the values for the other nine countries are lower.
The high levels of age dependency ratio in 9 countries in the first model have also led to the effect of this factor on economic growth and, on the next stage, on avoiding middle-income trap. The value of age dependency ratio in Malaysia is low, and this factor has led to a positive coefficient, indicating that age dependency can positively affect economic growth and the avoidance of middle-income trap.
References
1 ـ Agenor, P. and Canuto, O. (2015). “Middle-Income Growth Traps”, Research in Economics.
2 ـ Agenor, P., Canuto, O. and Jelenic, M. (2012). “Avoiding Middle-Income Growth Traps”, Economic Premise, The World Bank, Number 98. 3ـ Aiyar, S., Duval, R., Puy D, D., Wu, Y. and Zhang, L. (2013). “Growth Slowdowns and the Middle Income Trap”, IMF Working Paper 13/71, International Monetary Fund, Washington DC.
4ـ Asian Development Bank (ADB). (2011). “Asia 2050: Realizing the
Asian Century”, Manila: Asian Development Bank.
5ـ Bulman, D., Eden, M. and Nguyen, H. (2014). “Transitioning from Low-Income Growth to High-Income Growth Is There a Middle Income Trap?”, Policy Research Working Paper, The World Bank.
6ـ Cai, F. (2012). “Is There a “Middle-income Trap”? Theories, Experiences and Relevance to China”, China & World Economy / 49–61, Vol. 20, No. 1.
7ـ Comin, D. 2008. Total factor productivity. In: Durlauf, S. N. and Blume, L. E. (Eds.) the New Palgrave Dictionary of Economics. Palgrave Macmillan.
http://www.dictionaryofeconomics.com/article?id=pde2008_T000081> doi:10.1057/9780230226203.1719.
8ـ Cook, D. (2014). “WILL CHINA BE CAUGHT IN THE MIDDLE-INCOME TRAP? THE ECONOMIC PATH OF SOUTH KOREA AND MALAYSIA MAY HELP PROVIDE THE ANSWER”, NAVAL POSTGRADUATE SCHOOL.
9ـ Eichengreen, B., Park, D. & Shin, K. (2011). „When fast growing economies slow down: International evidence and implications for China.‟
Asian Economic Papers 11, 42‐87.
10ـ Eichengreen, B., Park, D. and Shin, K. (2012). “When Fast Economies Slow Down: International Evidence and Implications for China”, Asian Economic Papers, 11 (March 2012), 42-87.
11ـ Eichengreen, B., Park, D. and Shin, K. (2014). “Growth slowdowns redux”, Japan and the World Economy 32 (November 2014): 65-84. 12ـ Farah, N. (2016). “Evaluating Growth Slowdowns: Does Middle- Income Trap Exist?”, Eastern Illinois University.
14ـ Flaaen, A., E. Ghani, and S. Mishra. 2013. How to Avoid Middle Income Traps? Evidence from Malaysia. Policy Research Working Paper Series 6427. Washington, DC: World Bank.
15ـ Glawe, L. and Wagner, H. (2017). “THE PEOPLE’S REPUBLIC OF CHINA IN THE MIDDLE-INCOME TRAP?”, ADBI Working Paper Series No. 749.
16ـ Goay Dik Xon, J., Yong Hoong, L., Tzu Ting, L., Kok Chin, T. and Lee Kuan, W. (2013). “Middle-Income Trap: From the Perspective of Economic Growth”, University Tunku Abdul Rahman Faculty of Business and Finance Department of Economics.
17ـ Jankowska, A., Nagengast, A. and Perea, J. (2012). “
The Middle-Income Trap: Comparing Asian and Latin American Experiences”, OECD DEVELOPMENT CENTRE, Policy Insights, No. 96.
18ـ Jimenez, E., V. Nguyen, and H. A. Patrinos. 2012. Stuck in the Middle? Human Capital Development and Economic Growth in Malaysia and Thailand. World Bank Policy Research Working Paper No. 6283. Washington, DC: World Bank.
19ـ Jitsuchon, S. (2012). “Thailand in a Middle-income Trap”, TDRI Quarterly Review.
20ـ Kasenda, D. (2015). “Lessons for ASEAN Countries Stuck in A Middle-Income Trap from Korea's Economic Development and Institutions”, Global Development Network
21ـ Kharas, H., & Kohli, H. (2011). What Is the Middle-Income Trap, Why Do Countries Fall into it, and How Can Be Avoided? Journal of Emerging Market Economies, 3(3), 281-289.
22ـ Lubis, R. and Saputra, P. (2015). “The Middle-Income Trap: Is There a Way Out for Asian Countries?”, Journal of Indonesian Economy and Business Volume 30, Number 3, 273– 287.
23ـ Mill, J. S., 2009. The Collected Works of John Stuart Mill, Volume II – The Principles of Political Economy with Some of Their Applications to Social Philosophy (Books I-II), Edition of John M. Robson, Introduction by V.W Bladen.The Online Library of Liberty. Available at: http://www.econ.uba.ar/www/institutos/economia/ceplad/hpe_
bibliografia_digital/john%20mill%20vol1.pdf accessed 4 March 2016. 24ـ Spence, M. (2011). “The Next Convergence. The Future of Economic
25ـ Tho, T. V. 2013. The Middle-Income Trap: Issues for Members of the Association of Southeast Asian Nations. ADB Working Paper No. 421. Manila: Asian Development Bank.