RESEARCH
Study on measurement method for apple
root morphological parameters based
on
Labview
Yu Liu
1, Ji Qian
1*, Xin Yang
2, Bao Di
1and Juan Zhou
2Abstract
Background: Traditional measurements of apple seedling roots often rely on manual measurements and existing root scanners on the market. Manual measurement requires a lot of labor and time, and subjective reasons may cause the uncertainty of data; root scanners have limited scanning size and expensive. In case of fruit roots, coverage and occlusion issues will occur, resulting in inaccurate results, but our research solved this problem.
Results: The background plate was selected according to the color of the seedling roots; the image of the roots of the collected apple seedlings was preprocessed with Vision Development Module by combining image and Labview. The root surface area, average root diameter, root length and root volume of apple seedlings were measured by combining root characteristic parameters algorithm. In order to verify the effectiveness of the proposed method, a set of measurement system for root morphology of apple seedlings was designed, and the measurement result was compared with the Canadian root system WinRHIZO 2016 (Canada). With application of SPSS v22.0 analysis, the signifi-cance P > 0.01 indicated that the difference was not significant. The relative error of surface area was less than 0.5%. The relative error of the average diameter and length of the root system was less than 0.1%, and the relative error of the root volume was less than 0.2%.
Conclusions: It not only proved that the root surface area, average root diameter, root length and root volume of apple seedlings could be accurately measured by the method described herein, which was handy in operation, but also reduced the cost by 80–90% compared with the conventional scanner.
Keywords: Labview, Apple root system, Morphological parameters, Image preprocessing
© The Author(s) 2019. This article is distributed under the terms of the Creative Commons Attribution 4.0 International License (http://creat iveco mmons .org/licen ses/by/4.0/), which permits unrestricted use, distribution, and reproduction in any medium, provided you give appropriate credit to the original author(s) and the source, provide a link to the Creative Commons license, and indicate if changes were made. The Creative Commons Public Domain Dedication waiver (http://creativecommons.org/ publicdomain/zero/1.0/) applies to the data made available in this article, unless otherwise stated.
Introduction
Apple is one of the four major fruits in the world. Its root system architecture constitutes an important part of apple seedlings, which is buried deep in the soil to fix plants as the main vegetative organ for plant growth and metabolism. The morphological parameters of root mainly include the morphological parameters of main root, lateral root and fibrous root of the seedling. The root of the diaphysis is the main root, and the branches on it are collectively referred to as lateral roots. The fine roots formed by several branches on the lateral roots
are called fibrous roots. As the main factors reflecting the growth of roots, they have an impact on shoot and leaf growth aboveground, carbon assimilation, flower bud differentiation through absorption of water, nutri-ents and endogenous hormones. Neri et al. showed that lateral roots could be formed anywhere along the pri-mary roots of strawberry plants from a few stem cells distributed along the pericycle close to the protoxylem arches [1]. The tree body also establishes a close con-nection between matter and energy exchange through roots and soil during its life activities. The structure and form of root system is affected by the physical and chemical properties of the soil, the soil microbial factors of soil and other parts of the tree body. According to the research made by Polverigiani et al., soil sickness was a
Open Access
*Correspondence: [email protected]
1 College of Horticulture, Hebei Agricultural University, Baoding, Hebei, China
widespread problem in replanted apple orchards with a complex symptomatology and etiology influenced by soil and climate conditions. Their research also showed that there was a significant interaction between soil treatment and sampling site and root growth was correlated with the organic matter content in the soils [2]. Moreover, the root is buried deeply in the ground, so the features peren-nation, complex structure and huge form, which makes it harder for people to research on apple roots in-depth, systematic and comprehensive than on the aboveground part. Periodical measurement and analysis of the root morphology parameters of plants have great significance for understanding and studying the growth and develop-ment of plants, as well as controlling pests and diseases.
Traditional measurements of apple seedling roots often rely on manual measurements and existing root scan-ners on the market. Manual measurement requires a lot of labor and time, and subjective reasons may cause the uncertainty of data; root scanners have limited scanning size and expensive. In case of fruit roots, coverage and occlusion issues will occur, resulting in inaccurate results, but our research will solve this problem.
Machine vision technology is a comprehensive tech-nology involving many disciplines such as artificial intel-ligence, intelligent control, neural network, neurobiology and graphic image processing. With the development of machine vision technology and research in the field of plant science, it has been widely used in the identifica-tion of plant species, plant growth informaidentifica-tion detecidentifica-tion, quality inspection and classification of agricultural prod-ucts as well as visual navigation of farmland. For example, Sunoj et al. proposed measuring the size of sunflowers by machine vision in 2018 [3], Qinghua et al. put forward to classify potato quality by machine vision in 2018 [4], Gongal et al. proposed estimating the size of apple fruit by 3D machine vision in 2018 [5], Benoit et al. simu-lated image acquisition in machine vision for seedling
elongation, root segmentation algorithm for image pro-cessing validation in 2014 [6]. The application of machine vision-assisted electronic image analysis systems increases the precision and efficiency of plant produc-tion and avoids the subjective effects of human observa-tion. This research combined the using of Labview and the preprocessing of the image taken by camera acquisi-tion assisted with machine vision technology. The root morphology parameters-surface area, length and volume of apple root were measured by the designed system. It provided important data for the researchers to get the growth status of apple seedling roots, as well as the physi-cal and chemiphysi-cal properties of soil in order to improve the cultivation and management of apple seedlings.
Results
T Test
The "Independent Sample T-Test" process test is primar-ily used to test whether two samples are from a subject with the same average. In this study, it was mainly used to detect whether the average value between the Labview
calculated value and the two WinRHIZO 2016 groupings was the same.
In this study, independent sample T-tests were carried on root surface area, average root diameter, root length, and root volume by IBM SPSS v22.0 (see Table 1).
Table 1 showed the statistics of average value, stand-ard deviation and standstand-ard error of the data measured by Labview and WinRHIZO 2016. The independent sam-ple T test included the levin test results of the variance homogeneity. From the variance homogeneity levin test results of root surface area, average root diameter, root length and root volume, it could be seen that the data variance obtained from the two measurement methods was equal; assuming the T test results with equal vari-ance, i.e. All the P values were greater than the signifi-cance level of 0.01, it could be judged that there was no
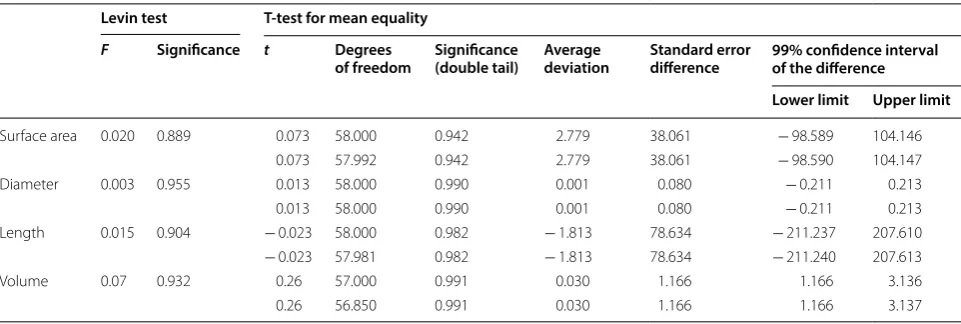
Table 1 Independent sample test
Levin test T-test for mean equality F Significance t Degrees
of freedom Significance (double tail) Average deviation Standard error difference 99% confidence interval of the difference
Lower limit Upper limit
Surface area 0.020 0.889 0.073 58.000 0.942 2.779 38.061 − 98.589 104.146
0.073 57.992 0.942 2.779 38.061 − 98.590 104.147
Diameter 0.003 0.955 0.013 58.000 0.990 0.001 0.080 − 0.211 0.213
0.013 58.000 0.990 0.001 0.080 − 0.211 0.213
Length 0.015 0.904 − 0.023 58.000 0.982 − 1.813 78.634 − 211.237 207.610
− 0.023 57.981 0.982 − 1.813 78.634 − 211.240 207.613
Volume 0.07 0.932 0.26 57.000 0.991 0.030 1.166 1.166 3.136
significant difference in root surface area, average root diameter, root length and root volume measured by the two methods.
Error analysis
In this study, WinRHIZO 2016 (Canada) was used as the test standard to calculate the standard deviation, abso-lute error and relative error of root surface area, average diameter, length and volume measured by the software. The calculation formulas were as following:
The standard deviation (S) is
The absolute error (∆) is
The relative error (δ) is
n is the total number of samples, xi is the parameters value of the ith sample measured by Labview, yi is the
parameters value of the ith sample measured by Win-RHIZO 2016.
After calculation, the results were showed as follows (see Table 2):
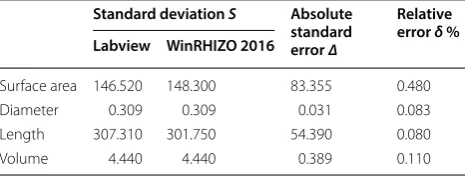
The relative error was the value obtained by multiply-ing the ratio of the absolute error caused by the meas-urement to the measured [conventional] true value with 100%. In general, the relative error could better reflect the degree of confidence in the measurement. From the results of Table 2, the relative errors were 0.48% for root surface area, 0.083% for average root diameter, 0.08% for root length and 0.11% for system volume.
Instrument calibration
Labview and WinRHIZO 2016 were set under the same conditions to correct the measurement. The measure-ment deviation of the two measuremeasure-ment methods under
(1)
S=
n
i=1(xi−x)2
n−1 .
(2)
=
n
i=1
xi− n
i=1
yi.
(3)
δ=
n
i=1xi−ni=1yi
n
i=1yi × 100%,
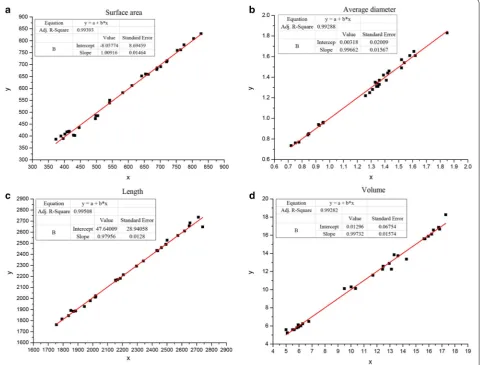
the same conditions was calculated by the measurement of 30 samples, and the measurement deviation between the systems was corrected (see Fig. 1).
The measurement results showed that the two meas-urement methods had a stable linear relationship, and the Labview data was corrected based on the WinRHIZO 2016 measurement value. The gain, offset and determina-tion coefficients of each parameters were calculated as follows (see Table 3):
Discussion
The growth of plants is mainly derived from the absorp-tion of and transportaabsorp-tion of water and nutrients by roots. Root growth and its distribution not only affect the absorption of water and nutrients of root, but also directly affect the growth of fruit trees and the quality and yield of apples. At present, machine vision is mainly concentrated in the upper part of the study of plants, such as the measurement of sunflower flower size by image processing [3], the classification of potato quality by machine vision and three-dimensional image [4], the estimation of apple fruit size by 3D technology [5], etc. The physical measurement of root morphological param-eters mainly relies on the root scanners currently avail-able in the market. It requires a fixed hardware scanner and software [7]. Which is not only used to research the relationship between roots and soils [8], plant roots and water-saving irrigation [9], plant nutrition and water absorption [10], but also research the effects of different soils on main and lateral roots. This study developed and tested an image processing system to measure the mor-phological parameters of apple seedling roots (surface area, average diameter, length, and volume) accurately. The selected background plate facilitated the collection of seedling root images. The morphological parameters algorithm performed measurement according to the user input background plate size and produced measurement results. The datum got from the designed system and the pre-existing system WinRHIZO 2016 was compared. The two-group datum was analyzed on the basis of the Independent-Samples T test. The result showed that the maximum t value was 0.073 and the minimum t value was 0.013, and all the significant (Double tail) values were greater than 0.01 (P > 0.01), indicating that there was no difference. The correlation between the two is extremely high. In the error analysis, the maximum relative error was 0.48% and the minimum was 0.08%, indicating lit-tle difference. In the result analysis, the measurement results also differed for different parameters. Compared with WinRHIZO 2016 measurement results, measure-ment results of root surface area, average root diameter, root length and root volume R2 in this analysis system were 0.994, 0.993, 0.995 and 0.993, indicating that the Table 2 Error analysis table
Standard deviation S Absolute standard error ∆
Relative error δ % Labview WinRHIZO 2016
Surface area 146.520 148.300 83.355 0.480
Diameter 0.309 0.309 0.031 0.083
Length 307.310 301.750 54.390 0.080
difference was not significant. The difference between the same parameters was mainly embodied in root sys-tems of different types, while the difference between the same types of root systems was small, and the difference between the measured values of the same root system also seemed tiny. This analysis software system designed
could be used to measure the morphological parameters of apple root system.
Conclusion
In this study, a set of measurement system for root mor-phology of apple seedlings was designed. This system employed the Labview software platform adjusted by sta-tistical methods to accurately measure the surface area, average diameter, length and volume of apple root sys-tems using machine vision technology. It was not only easy to operate, but also inexpensive, which had reduced the cost by 80–90% compared with the conventional scanner. The system could detect the main morphologi-cal parameters of apple seedlings roots (including the root size) and provided quality images. In addition, this research provided more intuitive and convenient method for the study of morphological parameters of apple seed-ling roots. The associated hardware equipment was Fig. 1 Comparison of the two measurement methods. x, Labview measurement value; y, WinRHIZO 2016 measurement value; a root surface area analysis chart; b average root diameter analysis chart; c root length chart; d root volume analysis chart
Table 3 Calibration data
The gain, offset and determination coefficients of each parameter were calculated
Measurement
parameters Gain Offset Determination coefficient
Surface area 1.0092 − 8.0577 0.99393
Diameter 0.9966 0.0032 0.99288
Length 0.9796 47.6400 0.99508
simple to operate and requires no regular maintenance. The data resulted from this system supported research-ers to effectively determine the growth status of apple seedling roots (normal growth roots were better than diseased roots) and the soil physical and chemical prop-erties. This was of great significance to the traditional cultivation and management of apple seedlings.
System design
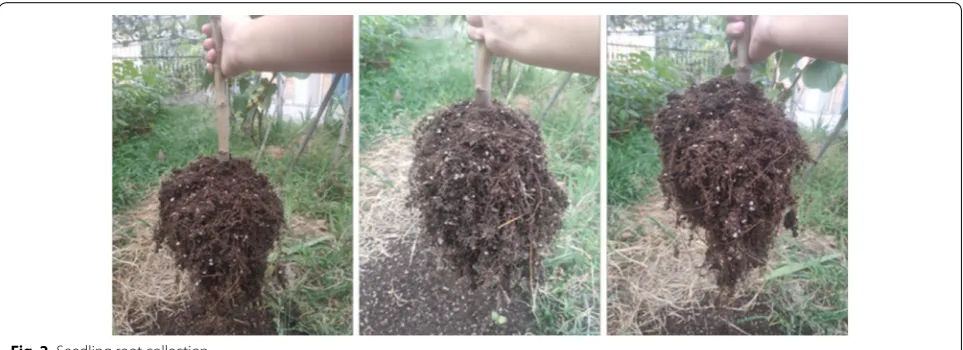
In this study, 2-year-old apple seedlings were used as research objects. Two-year-old B9 layering roots (asexu-ally propagated seedlings, with small and dense roots), 2-year-old SH40 roots (tissue culture rooting seedlings) and 2-year-old B9 seedling roots (seedling plant) were selected. The seedlings were obtained from Li County of Baoding City, Hebei Province, China (38° 33′ 10.5ʺ N 115° 29′ 57.4ʺ E) (see Fig. 2). The meaningful part was extracted by background plate selection, image acquisi-tion and image preprocessing. The surface area, average diameter, length and volume of the root system were obtained by the root characteristic parameters algorithm.
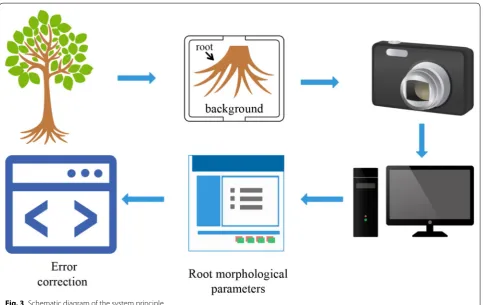
The schematic diagram of the system principle was as follows (see Fig. 3 and Additional file 1: Figure S1).
Hardware design
Background plate selection
Obtaining digital images from seedlings was challeng-ing because the resultchalleng-ing images can suffer from image distortion, shadowing and insufficient contrast. In order to fully and clearly display the root image and facilitate segmentation, the background with significant contrast from the root color should be selected to enhance con-trast of the acquired image [3]. At the same time, the selected background board should be larger than the seedling root and the actual area should be known. In this study, because the apple roots were darker in color
and root types were different, white background board of 297 × 420 mm and 610 × 420 mm were selected [4].
Image collector selection
Pixel resolution referred to the minimum number of pixels required to display a complete object to be meas-ured and to display an image of useful information points on the object being measured. The pixel reso-lution could be determined by the smallest eigenvalue of the detected object [11]. According to the following formula:
Assuming that the maximum length of the root sys-tem was 300 mm and the minimum eigenvalue was 1 mm, the minimum pixel resolution required to calcu-late according to the above formula was 600.
In order to make the image clear without shadow, the selected data acquisition device was Canon SX620, with 20.2 million pixels [12], 25 mm wide angle, 25-fold optical zoom, highest resolution of 5184 × 3888, ISO80-3200 and optical image stabilization. In RGB
color mode, the image collector should directly face the center of the background plate during the shooting pro-cess, and the background plate should be included in it for collection.
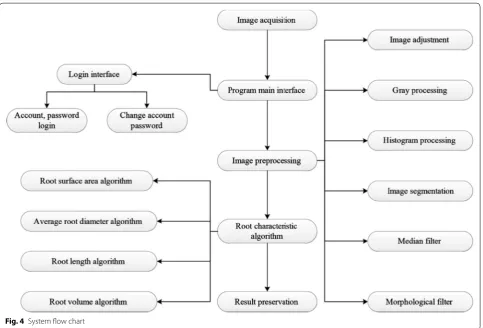
Software design
The system mainly included a login module, a database module [13] and an image preprocessing module, a data analysis processing module and a system result output module. The image processing module mainly included image cropping, gray processing, image histogram, image (4) Pixel resolution
=
the maximum length of the detected object the minimum eigenvalue of the object
×2.
segmentation, median filter and morphological filter (see Fig. 4).
Image cropping
In the image acquisition process, due to the different acquisition positions, parts outside the background plate may appear in the captured image. In order to ensure data accuracy, the image needed to be cropped while retaining the background plate and corresponding pixel values [3].
Gray processing
The image acquired by the image collector was a color image, and the model usually oriented to the hardware was RGB model [14]. RGB was to adjust color from the principle of optics, which did not reflect the morphologi-cal characteristics of the image, so the color image should be converted into an 8-byte grayscale image for process-ing [15]. A grayscale image was a component of a color image, which was of 8 bytes [16], and each pixel was indi-cated by 0–255. To make the images and results more accurate, this study adopted 8-byte grayscale images. According to the following formula:
(5)
Gray=R×0.299+G×0.587+B×0.114.
Gray is the grayscale image; R is the red component map in the RGB image; G is the green component map in the
RGB image; B is the blue component map in the RGB image. It had been experimentally proved that the R compo-nent map and the G component map could not clearly distinguish the background from the root system, so B
component was extracted to complete the conversion from color image to grayscale image.
Histogram processing
The histogram [17] could be used not only for image enhancement, but also for image segmentation. If there was a distinct bimodal shape in the gray histogram, the gray value corresponding to the valley between the two peaks could be selected as the threshold [11]. However, this method was not suitable for the case where the bimodal difference in the histogram was great or the val-ley between the double peaks was relatively broad and flat, as well as the case of unimodal histogram. If the above two histograms appeared, the iterative threshold method should be selected to obtain the optimal thresh-old. According to the following formula:
(6)
gx,y=
1 fx,y>t
0 other ,
where t is the threshold value.
Image segmentation
The main purpose of image segmentation was to separate the desired target image from the background region so that the target image could be extracted [18, 19]. Due to the root system and its irregularity, neither the bound-ary detection method nor the region extraction method could effectively separate the image from the back-ground. Therefore, threshold segmentation method was selected in this study [20–22].
In order to solve the case that some images could not show obvious double peaks in the histogram and reduce the error segmentation probability, the optimal threshold was obtained by the algorithm of iterative threshold [23]. According to the histogram, the gray value range was selected as the initial threshold T0. Assuming that there were a total of L gray values, iteration was performed according to the following formula:
(7) Ti+1=
1
2 Ti
k=0hk×k Ti
k=0hk +
L−1 k=Tihk×k L−1
k=Ti+1hk
,
where L is the number of gray levels, and Ti is the thresh-old after iteration; hk is the number of pixels whose gray value is k. The iteration termination condition is Ti+1=Ti . When the iteration ends, Ti is taken as the optimal segmentation threshold T.
Median filter
The captured image was subject to the influence of light source, jitter, external signal interference, etc., often with impulse noise, resulting in blurred image, loss of detail and resolution degradation, affecting the analy-sis results. Therefore, it was necessary to filter the cap-tured photos [15, 24]. The median filter method was a common method to remove impulse noise [11], which could eliminate isolated noise points, provide excellent noise reduction performance, and effectively protect image edge features. Two-dimensional median filter output is
where fx,y,gx,y are respectively original image and processed image; w is a two-dimensional template.
(8)
gx,y=medfx−k,y−1,(k, 1∈w),
Morphological filter
The language of mathematical morphology was a set theory. As a tool to extract image components useful for express-ing and describexpress-ing regions from images, such as bounda-ries, skeletons, etc., shape expansion and corrosion were the basis of mathematical morphological processing. Expansion was mainly to fill in some small cavities in the pixels appear-ing in the roots that were not captured durappear-ing the threshold processing. The expression was to assume A and B were a set in Z2, and A expansion by B was defined as:
Corrosion was a process of eliminating boundary points and shrinking the boundaries to the interior, which could be used to eliminate tiny and meaningless objects [25]. The main purpose was to eliminate some very small debris pixels that may appear during thresh-old processing. The expansion expression was to assume both A and B were a set in Z, which were expressed as
AΘB and defined as:
This formula showed that the use of B to etch A was to let the set of points z in B contained in A be translated by
z.
Expansion and corrosion were mutually dual for the set complement and reflection operations, that was:
(9) A⊕B=
z
B
z∩A
⊆A.
(10)
A�B=z(B)z ⊆A.
(11)
(AB)c=Ac⊕Bc.
The open operation was the process of first corrosion and then expansion [26]. Using the structural element B
to open the set A, the expression was:
The open operation could be used to eliminate small objects, separate objects at slender points, and not signif-icantly change the area while smoothing the boundaries of larger objects.
The closed operation was the process of first expansion and then corrosion [27], and the expression was:
Closed operations were used to fill small cavities in objects, connect adjacent objects and smooth the bound-aries without significantly changing the area.
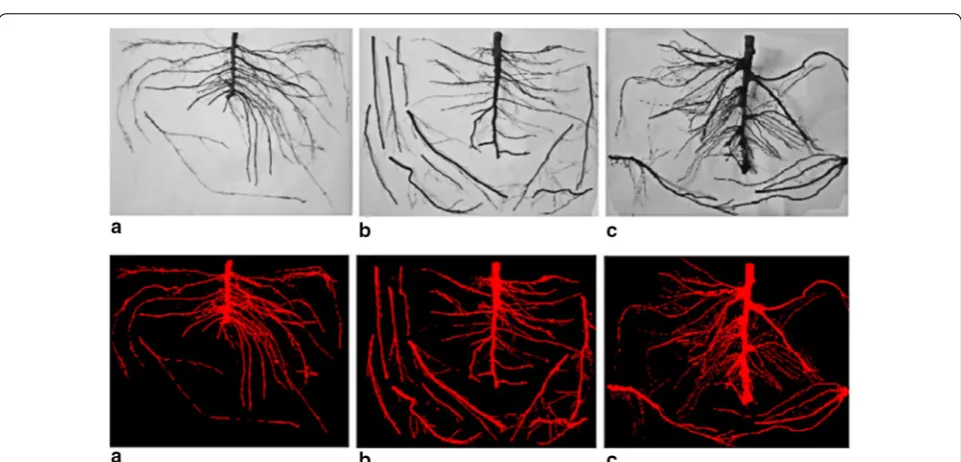
The system mainly applied expansion corrosion, open and closed operations in binarized image morphology processing to fill small cavities and eliminate fine debris pixels (see Fig. 5).
Calculation of root surface area
The acquired root image was a planar graph, which could be used as a vertical section of the root system, which was a segmented image obtained in image pro-cessing. It could also be regarded as a projected area. According to the basic theory of plant nutrition [28], plant roots were uniform in longitudinal growth, so each cross-section of the root system could be consid-ered as a circle. According to the established cylindrical
(12)
A◦B=(A�B)⊕B.
(13)
A•B=(A⊕B)�B.
approximation model [29], the root system could be regarded as a three-dimensional figure formed by stacking many small cylindrical micro-elements. The overall characteristic parameters of the root system could be calculated based on the model.
Assuming that the number of pixels with pixel values greater than 1 in the segmented image was Na; the num-ber of pixels was n; the projected area of the root system could be expressed as:
The root system could be seen as a stack of m-segment small cylindrical micro-elements (m is a finite number). The surface area was the cumulative sum of the side areas of the m-segment cylinder, i.e.:
Calculation of average root diameter
The image was a planar graph and had been previously segmented. In order to calculate the radius of the root system, the circle detection was used by setting the radius
(14)
Svertical=n×Na.
(15)
Slateral=π×Svertical×m.
to 0–100 pixels, and then the radius of all the roots could be captured to find the average diameter of the root sys-tem. Assuming that the number of detected circles was n
and the radius was m, the average diameter d was:
Root length calculation
In order to facilitate the calculation of root length, the image could be refined to approximate the skeleton line of the object [30]. The refined image forms the skele-ton of the image, and the refined image width was one pixel, while the length and the original image were kept unchanged. The length of the entire root system could be obtained by counting the number of pixels and multiply-ing it with the distance between the pixels. In this experi-ment, the chain length statistical method was used to obtain the length information of the root system.
The collected roots were irregular images which could be calculated in 8-connected mode. In the 8-con-nected mode, the distance between each pixel and its
(16)
D=2r=
n
i=1m
m ×2.
neighboring pixels was not equal. Assuming that any pixel had a distance of 1 from the adjacent pixels in the vertical direction and the horizontal direction, the dis-tance of the pixel in the oblique line direction was √2.
In this study, direction code was used to distinguish two different spacings: if the adjacent two pixels were even, the distance was 1; if the adjacent two pixels were odd, then the distance was √2 . If N1 and N2 were separately calculated in different ways, and C was the calibration coefficient of the root length, then the length of the root system was:
Calculation of root volume
The average diameter and length of the root system were calculated in “Calculation of average root diame-ter” and “Root length calculation”, respectively, and the root system was considered as a solid figure stacked by small cylinders as mentioned in “Calculation of average root diameter”. The volume V of the root system was:
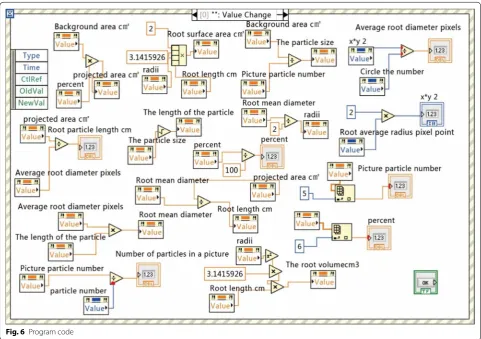
Part of the program code is shown in Fig. 6.
Supplementary information
Supplementary information accompanies this paper at https ://doi. org/10.1186/s1300 7-019-0535-4.
Additional file 1. Framework figure of the research.
Acknowledgements
We are grateful to Seedling Nursery of Li County for offering us the apple seedlings.
Authors’ contributions
In this paper, YL was responsible for part of the test method query and soft-ware construction, manuscript writing and editing. JQ was responsible for the inquiry of test methods and the supervision of the construction of software platform; XY and BD were responsible for the supervision and verification of results; JZ was responsible for the inquiry of test methods, the construc-tion of software platform and the verificaconstruc-tion of results. All authors read and approved the final manuscript.
Funding
The project was jointly funded by Financial Aid Project for the Introduction of Overseas Students in Hebei Province (C201838), Hebei Province Higher Education Science and Technology Research Project (QN2019090) and China Agriculture Research System (CARS-27).
Availability of data and materials
The datasets generated during and/ or analyzed during the current study are not publicly available due to the Metadata was computer codeData but are available from the corresponding author on reasonable request.
Ethics approval and consent to participate Not applicable.
(17)
L=CN1+N2×
√
2.
(18) V =
n
i=1
m/m×CN1+N2√2.
Consent for publication Not applicable.
Competing interests
The authors declare that they have no competing interests.
Author details
1 College of Horticulture, Hebei Agricultural University, Baoding, Hebei, China. 2 College of Resources & Environment Sciences, Hebei Agricultural University, Baoding, Hebei, China.
Received: 28 September 2019 Accepted: 30 November 2019
References
1. Neri D, Lee ON, Savini G, Kurokura T, Sugiyama N. Lateral root formation in the strawberry Fragaria × ananassa Duch. revealed by histone H4 in situ hybridization. Plant Biol Syst. 2011;145(2):406–10.
2. Polverigiani S, Kelderer M, Neri D. Growth of ‘M9’ apple root in five Central Europe replanted soils. Plant Root. 2014;8:55–63. https ://doi. org/10.3117/plant root.8.55.
3. Sunoj S, Subhashree SN, Dharani S, Igathinathane C, Franco JG, Mallinger RE, Prasifka JR, Archer D. Sunflower floral dimension measurements using digital image processing. Comput Elect Agric. 2018;151:403–15. https ://doi.org/10.1016/j.scien ta.2019.02.003. 4. Su QH, Kong NS, Li MZ, Sun H, Firmanda ARD, Habaragamuwa H.
Potato quality grading based on machine vision and 3D shape analysis. Comput Elect Agric. 2008;152:261–8. https ://doi.org/10.1016/j.compa g.2018.07.012.
5. Gongal M, Karkee A, Amatya. Apple fruit size estimation using a 3D machinevision system. Inform Process Agric. 2018;5:498–503. https :// doi.org/10.1016/j.inpa.2018.06.002.
6. Benoit L, Rousseau D, Belin E, Demilly D, Chapeau-Blondeau F. Simula-tion of image acquisiSimula-tion in machine vision dedicated to seedling elongation to validate image processing root segmentation algo-rithms. Comput Elect Agric. 2014;104:84–92. https ://doi.org/10.1016/j. compa g.2014.04.001.
7. Yoichiro K, Midori O, Ryosuke T, Daisuke F, Nobuya K. Root response to aerobic conditions in rice, estimated by Comair root length scanner and scanner-based image analysis. Field Crops Res. 2010;118:194–8. https ://doi.org/10.1016/j.fcr.2010.04.013.
8. Ickkshaanshu S, Hari PK, Sumit S. Estimation of root water uptake and soil hydraulic parameters from rootzone soil moisture and deep perco-lation. Agric Water Manag. 2019;222:38–47. https ://doi.org/10.1016/j. agwat .2019.05.037.
9. Mali SS, Nail SK, Jha BK, Singh AK, Bhatt BP. Planting geometry and growth stage linked fertigation patterns: Impact on yield, nutrient uptake and water productivity of Chili pepper in hot and sub-humid climate. Scientia Horticult. 2019;249:289–98. https ://doi.org/10.1016/j. scien ta.2019.02.003.
10. Xiaolin S, Xiaodong G, Miles D, Wei Z, Pute W, Jie Y, Xining Z. Soil water and root distribution of apple tree (Malus pumila Mill) stands in relation to stand age and rainwater collection and infiltration system (RWCI) in a hilly region of the Loess Plateau. China. Catena. 2018;170:324–34. https :// doi.org/10.1016/j.caten a.2018.06.026.
11. Ji Q. Research on character recognition system based on image processing. Baoding: Hebei Agricultural University; 2008. https ://doi. org/10.7666/d.y1161 935.
12. Đuriš M, Arsenijević Z, Jaćimovski D, KaluđerovićRadoičić T. Optimal pixel resolution for sand particles size and shape analysis. Powder Technol. 2014;302:177–86. https ://doi.org/10.1016/j.powte c.2013.04.048. 13. Lin E, Balogh R, Isaacs B, Ouellette-Kuntz H, Selick A, Wilton AS, Cobigo
•fast, convenient online submission •
thorough peer review by experienced researchers in your field • rapid publication on acceptance
• support for research data, including large and complex data types •
gold Open Access which fosters wider collaboration and increased citations maximum visibility for your research: over 100M website views per year •
At BMC, research is always in progress.
Learn more biomedcentral.com/submissions
Ready to submit your research? Choose BMC and benefit from: 14. Nayak SR, Mishra J, Khandual R, Gopinath P. Fractal dimension of RGB
color images. Optik. 2018;162:196–205. https ://doi.org/10.1016/j.ijleo .2018.02.066.
15. Pare S, Bhandaria AK, Kumar A, Singh GK. An optimal color image multilevel thresholding technique using grey-level co-occurrence matrix. Expert Syst Appl. 2017;87:335–62. https ://doi.org/10.1016/j. eswa.2017.06.021.
16. Lynn KJW. Histogram-based ionogram displays and their applica-tion to auto scaling. Adv Space Res. 2017. https ://doi.org/10.1016/j. asr.2017.12.019.
17. Xuewen W, Lixia C. An effective histogram modification scheme for image contrast enhancement. Signal Process Image Commun. 2017;58:187–98. https ://doi.org/10.1016/j.image .2017.07.009. 18. Abdullah SLS, Hambali HA, Jamil N. Segmentation of natural images
using an improved thresholding-based technique. Proc Eng. 2012;41:938–44. https ://doi.org/10.1016/j.proen g.2012.07.266. 19. Bhandari AK, Kumar A, Chaudhary S, Singh GK. A novel color image
multilevel thresholding based segmentation using nature inspired optimization algorithms. Expert Syst Appl. 2015;63:112–33. https ://doi. org/10.1016/j.eswa.2016.06.044.
20. Khairuzzaman AM, Chaudhury S. Multilevel thresholding using grey wolf optimizer for image segmentation. Expert Syst Appl. 2017;86:64–766. https ://doi.org/10.1016/j.eswa.2017.04.029.
21. Xiang R. Image segmentation for whole tomato plant recognition at night. Comput Elect Agric. 2018;154:434–42. https ://doi.org/10.1016/j. compa g.2018.09.034.
22. Rui W, Chao L, Jie W, Xiao W, Yue LH, Yue ZM, Su Z. Threshold segmen-tation algorithm for automatic extraction of Cerebral vessels from brain magnetic resonance angiography images. J Neurosci Methods. 2015;241:30–6. https ://doi.org/10.1016/j.jneum eth.2014.12.003.
23. Dong W, Hao LH, Xiao WY, Xiao WP. An efficient iterative thresholding method for image segmentation. J Comput Phys. 2016;350:657–67. https ://doi.org/10.1016/j.jcp.2017.08.020.
24. Climent J, Oliveira LS. A new algorithm for number of holes attribute filtering of grey-level images. Pattern Recogn Lett. 2015;53:24–30. https :// doi.org/10.1016/j.patre c.2014.10.012.
25. Legaz-Aparicio AG, Verdu-Monedero R, Angulo J. Adaptive morphologi-cal filters based on a multiple orientation vector field dependent on image local features. Arch Ouverte Hal. 2018;330:965–81. https ://doi. org/10.1016/j.cam.2017.05.001.
26. Yuan C, Ya LQ. Switching median and morphological filter for impulse noise removal from digital images. Optik. 2015;126:1598–601. https ://doi. org/10.1016/j.ijleo .2015.05.032.
27. Yi LF, Ming ZJ, Jian LH, Jian LX. Fault detection method for railway wheel flat using an adaptivemultiscale morphological filter. Mech Syst Signal Process. 2017;84:642–58. https ://doi.org/10.1016/j.ymssp .2016.07.009. 28. Rafael C, Gonzalez. Digital image processing. 2nd ed. New York: Electronic
Industry Press; 2005. p. 423–425.
29. Qing LJ. Detection of plant root image analysis system. Harbin: Northeast Forestry University; 2004.
30. Liang YG. Application of computer vision in root morphology analysis. Beijing: Capital Normal University; 2006.
Publisher’s Note