R E S E A R C H
Open Access
Objective evaluation of fatigue by EEG spectral
analysis in steady-state visual evoked
potential-based brain-computer interfaces
Teng Cao
1, Feng Wan
1*, Chi Man Wong
1, Janir Nuno da Cruz
1and Yong Hu
2* Correspondence:[email protected] 1
Department of Electrical and Computer Engineering, University of Macau, Macau, China
Full list of author information is available at the end of the article
Abstract
Background:The fatigue that users suffer when using steady-state visual evoked potential (SSVEP)-based brain-computer interfaces (BCIs) can cause a number of serious problems such as signal quality degradation and system performance deterioration, users’ discomfort and even risk of photosensitive epileptic seizures, posing heavy restrictions on the applications of SSVEP-based BCIs. Towards alleviating the fatigue, a fundamental step is to measure and evaluate it but most existing works adopt self-reported questionnaire methods which are subjective, offline and memory dependent. This paper proposes an objective and real-time approach based on electroencephalography (EEG) spectral analysis to evaluate the fatigue in SSVEP-based BCIs.
Methods:How the EEG indices (amplitudes inδ,θ,αandβfrequency bands), the selected ratio indices (θ/αand (θ+α)/β), and SSVEP properties (amplitude and signal-to-noise ratio (SNR)) changes with the increasing fatigue level are investigated through two elaborate SSVEP-based BCI experiments, one validates mainly the effectiveness and another considers more practical situations. Meanwhile, a self-reported fatigue questionnaire is used to provide a subjective reference. ANOVA is employed to test the significance of the difference between the alert state and the fatigue state for each index.
Results:Consistent results are obtained in two experiments: the significant increases in αand (θ+α)/β, as well as the decrease inθ/αare found associated with the increasing fatigue level, indicating that EEG spectral analysis can provide robust objective
evaluation of the fatigue in SSVEP-based BCIs. Moreover, the results show that the amplitude and SNR of the elicited SSVEP are significantly affected by users’fatigue. Conclusions:The experiment results demonstrate the feasibility and effectiveness of the proposed method as an objective and real-time evaluation of the fatigue in SSVEP-based BCIs. This method would be helpful in understanding the fatigue problem and optimizing the system design to alleviate the fatigue in SSVEP-based BCIs.
Keywords:Fatigue, Objective evaluation, Brain-computer interfaces, Steady-state visual evoked potential, Electroencephalography spectral analysis
Background
Brain-computer interfaces (BCIs) provide a direct communication pathway connecting human brain and external devices that is independent to normal peripheral nervous and muscular systems. BCIs measure the brain activities and translate the encoded hu-man intentions to control computers, wheelchairs and robots, with a wide range of ap-plications [1]. Among the non-invasive BCIs, steady-state visual evoked potential (SSVEP)-based BCIs have attracted much attention owing to their merits such as high information transfer rate (ITR), small number of electrodes and short training time in comparison with other types of BCIs [2].
On the other hand, most SSVEP-based BCIs remain in the laboratory demonstration stage, with a big gap from practical use by paralyzed patients or normal users for a long period. One of the challenges is the fatigue that users suffer when using SSVEP-based BCIs. In laboratory demonstrations, the experiment is usually short, e.g., few seconds for one trial or few minutes for one experiment. For a longer period under normal use, when staring at the flashing stimulus however most users have uncomfortable and un-pleasant feelings including tiredness, drowsiness, loss of attention and difficulty in con-centration, which are the symptoms of fatigue.
Fatigue is generally referred as a feeling of tiredness, reduced alertness, exhaustion, which impairs both capability and willing to perform a task [3-5]. An ideal BCI should be easy to perform with little effort to prevent fatigue but strong electroencephalog-raphy (EEG) signals to produce reliable and effective output [6]. Unfortunately, in SSVEP-based BCIs significant mental effort is required for the users to concentrate on the visual stimulus to generate sufficiently strong SSVEP, however due to high bright-ness, overstimulation and repetitive task, users may easily get fatigue [7]. As attention dependent systems, SSVEP-based BCIs require target gazing and therefore the ampli-tude and signal to noise ratio (SNR) of the elicited SSVEPs are heavily affected by men-tal states, fatigue, arousal and degree of attention level [8-10]. Loss of attention and decreased arousal level caused by mental fatigue or distraction can significantly worsen the SSVEP signal quality [11] and consequently degrade the BCI system performance.
In the literature of SSVEP-based BCIs, fatigue and its influence in long-term experi-ments have been already noticed [12,13], however so far there is no systematic study on the fatigue problems. A frequently used strategy to reduce fatigue is to adopt some relatively comfortable stimulations, such as high frequency stimulation [14,15], high duty cycle stimulation [16] and amplitude modulated stimulation [17]. Unfortunately, the crux of the matter is that there is no objective method to measure and evaluate the fatigue in a reasonable manner. In the existing work, a common choice to “measure” fatigue is self-reported questionnaires provided to the users for feedback about the feel-ings of fatigue in operating the systems [15,18-20], which are subjective and cannot be done in real time.
and arousal level, as well as the reduced capacity are associated with the global in-creases in the θ and α activities [22,23]. The θ activity occurs in a variety of mental states including drowsiness, and the increase inθ activity is related to generalized per-formance decrements on task [22]. The α waves appear during relaxed conditions, at decreased attention levels and in a drowsy but wakeful state [22,24], and the increased α power associated with fatigue is related to the increased mental effort to maintain vigilance level [22]. Since the EEG reflects the mental state and fatigue of the users, EEG spectral analysis could be a promising method to provide an objective and real-time evaluation of the fatigue level in SSVEP-based BCIs.
Our preliminary study [25] shows that the increasedθ,α, and (θ+α)/βpower are as-sociated with the increased fatigue level, and the SSVEP amplitude and SNR are influ-enced by fatigue level. On this basis, this paper further checks the feasibility and effectiveness of proposed objective method for fatigue measure and evaluation in SSVEP-based BCIs through two elaborate SSVEP-based BCI experiments, one validates mainly the effectiveness and one considers more practical situations. The changes of EEG indices (δ, θ, α and β), ratio indices (θ/α and (θ+α)/β), and SSVEP properties (amplitude and SNR) associated with increasing fatigue level are investigated. The pro-posed method would be helpful in understanding the fatigue problem from the view-point of EEG spectrum. With appropriate methods for measure and evaluation, a systematic study on the influence due to different configurations (such as different stimulus frequencies, colors and patterns) can be performed, and eventually the design of the system including the visual stimulator can be optimized in order to alleviate the fatigue in SSVEP-based BCIs.
Methods
Experiment design
In order to prove the feasibility and effectiveness of the proposed method, two elabor-ate SSVEP-based BCI experiments were designed and two different groups of partici-pants were tested in this study. More specifically, in Experiment 1 a single stimulus was used to elicit SSVEP at the selected frequency and the purpose was to prove that the EEG spectral analysis is effective in measuring the fatigue in SSVEP-based BCIs; Ex-periment 2 employed several stimuli encoded by different frequencies for the purpose to show the feasibility of the proposed method in practical situation, because in a real SSVEP-based BCI, normally there must be a number of buttons for different com-mands presented by different stimuli with different frequencies, rather than only one stimulus as in Experiment 1.
Twenty-one randomly selected university students (aged from 21 to 29 years old) partic-ipated in this study. The participants were selected according to the following criteria: no history of psychiatric or neurological disorders, no psychotropic medications or addiction drugs and with normal or corrected to normal vision. Informed written consent was ob-tained from all participants after explaining the nature, possible consequences and privacy issues of the study to them. The protocol was in accordance with the Declaration of Helsinki and approved by the Research Ethics Committee (University of Macau).
and Microsoft DirectX SDK (June 2010). White stimuli with 120×120 pixels on black back-ground were used for best contrast in this study. There was a symbol“+”shown in the cen-ter of the stimulus before and within each trial, indicating the stimulus that the participants should gaze at and keeping the participants focusing on the target, so the participants could follow the cues to gaze at different stimuli. The experiment facilities were set in a normal of-fice environment without intensive light and noise, and participants were seated on a com-fortable chair in front of the visual stimulator with a distance of about 50 cm. Since the participants were told to keep the body unmoved and not to blink eyes in each trial, the ar-tifacts and other noises were controlled to the minimum. All the experiments were con-ducted in a fixed time period (3–4 p.m.), and all the participants finished the experiments successfully without suffering any unpleasant feeling and discomfort in bodies.
EEG measurement
A standard EEG electrode placed on OZ, in the international 10–20 montage system,
which was located in the center of the occipital lobe, was used as the input channel. The reference electrode and ground electrode were chosen as FCz and Cz, respectively. EEG signals were amplified through an amplifier (g.USBamp, Guger Technologies, Graz, Austria) and filtered by a 50 Hz notch filter and a 0.5 Hz to 60 Hz band-pass filter to re-move the noise. The sampling frequency was 600 Hz. The frequency bandsδ(1–4 Hz),θ (4–8 Hz),α(8–13 Hz), andβ(13–30 Hz) were monitored along the experiments.
Psychological measurement
All the participants were asked to finish a self-reported fatigue questionnaire before and after the task, which was based on the Chalder Fatigue Scale (CFS) [26]. The CFS had high reliability and validity and consisted of 8 physical fatigue questions and 6 mental fatigue questions, such as“Do you have problems with tiredness?”,“Do you need to rest more?” and“Do you feel sleepy or drowsy?”Besides, another 6 questions related to visual fatigue symptoms were added in this questionnaire. These six questions were:“Do you have eye-strain?” “Do you have eye dryness?” “Do you have headache?” “Do you feel fatigue in eyes?” “Do you feel blurry?”and“Do you have difficulties keeping eyes open?”Therefore, there were 20 questions in total and every question had four choices rated as a four-point scale (0–3), i.e. better than usual (0), no more than usual (1), worse than usual (2) and much worse than usual (3). A high fatigue score presented a high level of fatigue, and in this study the questionnaire was used to provide a subjective reference to evaluate users’ fatigue level before and after experiments.
Experiment procedure
In the first SSVEP-based BCI experiment, only one stimulus flashing at 15 Hz was used to elicit SSVEP. Eight participants participated in this experiment and were asked to gaze at the flashing stimulus for 30 trials. The stimulus was flashing for 3 seconds in each trial with a 2-second pause for a short rest between two consecutive trials.
1 to the stimulus 6, and repeated for 6 times (i.e. 36 trials in total). To test on the com-monly used stimulus frequencies, two sessions were performed, with the stimulation frequencies in 7–12 Hz for Session I and 13–18 Hz for Session II. The stimuli were flashing for 8 seconds in each trial with a 4-second pause between two consecutive tri-als. Every participant did the experiment for both two sessions and a 5-minute pause was given between the sessions to reduce the fatigue caused by the previous one.
Data analysis
Since the stimulation frequencies for each trial were already known, it was easy to cal-culate the amplitudes ofδ,θ,αand βfrequency bands, as well as the SSVEP amplitude and SNR at the stimulation frequency by Fast Fourier Transform (FFT) using all the sampling points in each trial. The SNR was defined as the ratio of the amplitude at stimulation frequency to the mean value of the n adjacent points:
SNR¼Xn=2 ny fð Þ
k¼1½y fð þ0:25kÞ þy fð −0:25kÞ
ð1Þ
where y was the amplitude spectrum calculated by FFT, f was the stimulation fre-quency, and y(f) was the SSVEP amplitude at stimulation frequency (refer to [27] for more details). When calculating the amplitudes of δ, θ,α and βfrequency bands, the elicited SSVEP component at the stimulation frequency had been filtered from the cor-responding frequency band by a band-stop filter. The mean value of the amplitudes in the frequency band was selected as the index of this frequency band and used to calcu-late the ratio indices, such asθ/αand (θ+α)/βthat were two widely used ratio indices in fatigue studies [24,28-30]. In total, four EEG indices (δ,θ,αand β), two ratio indices (θ/αand (θ+α)/β), and two SSVEP indices (amplitude and SNR) in each trial along the experiments were obtained. The mean values of each index in the first five trials and the last five trials in the experiment were used to represent the corresponding index in the alert state and the fatigue state, respectively. The fatigue scores assessed by the fa-tigue questionnaire before and after the experiment were considered as the reference fatigue scores in the alert and fatigue states. One-way ANOVA with significance level of 0.05 was employed to test the significance of the difference between the alert state and the fatigue state for each index.
Results
Experiment 1: single stimulus
presents the comparison of the fatigue scores from self-reported questionnaire and dif-ferent indices in the alert state and the fatigue state for this participant. The fatigue score by self-reported questionnaire was increased from 20 to 40, which suggests the increased fatigue level due to the experiment. The changes are obvious in the indicesθ and α, as well as the ratio indices θ/α and (θ+α)/β resulting from the fatigue. In addition, Figure 2(h) and Figure 2(i) indicate the reduced amplitude and SNR of the elicited SSVEP in the fatigue state compared with the alert state.
Besides the individual case study, an overall analysis on all participants was also per-formed. The self-reported fatigue questionnaire shows that in Experiment 1 the partici-pants’average fatigue level was significantly increased after the experiment. The fatigue score was significantly increased (F (1, 14) = 33.11, p < 0.001), with pre-mean score = 21.50, standard deviation (SD) = 2.51; and post-mean score = 37.13, SD = 7.36. Figure 3 demonstrates the comparison of the fatigue scores and indices in the alert state and the fa-tigue state. Four EEG indices δ, θ,α, βand the ratio index (θ+α)/βshow an increasing tendency, while the ratio index θ/α, SSVEP amplitude and SNR show an opposite ten-dency. The statistical test results of the indices are given in Table 1. Significant increases are found inδ(F(1, 8) = 41.77,p< 0.001),θ(F(1, 8) = 17.72p< 0.001),α(F(1, 8) = 47.64,
p< 0.001), and the ratio index (θ+α)/β(F(1, 8) = 66.40,p< 0.001), while significant de-creases are observed in the ratio index θ/α (F(1, 8) = 22.89, p< 0.001), as well as the SSVEP amplitude (F(1, 8) = 41.32,p< 0.001) and SNR (F(1, 8) = 145.29,p< 0.001). Theβ index (F(1, 8) = 2.59,p= 0.146) has no significant difference between the alert state and the fatigue state. Nevertheless, due to the individual differences, different sensitivities were found on the increasing fatigue level, so the changes of different indices could be different
0 0.5 1 1.5 2 2.5 3
−20 −10 0 10 20
(a)
Raw EEG5 10 15 20 25 30 35
0 1 2 3 4 5
(b)
SpectrumFigure 1Comparison of Raw EEG signal and the spectrum of an individual participant between the alert and fatigue states for Experiment 1.Vertical axis for(a)and(b), amplitude (μV); horizontal axis for
among participants. That is why theθ/αindex was found increased in the individual case presented in Figure 2(f ), while the group average was decreased as shown in Figure 3(f ).
Experiment 2: multi-stimulus with different frequencies
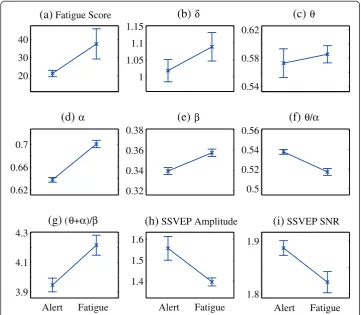
In Experiment 2, as assessed by the self-reported fatigue questionnaire, the participants’ average fatigue level was found significantly increased after the experiment: the fatigue score was significantly increased (F (1, 14) = 124.72, p< 0.001), with pre-mean score = 21.17, SD = 1.75, and post-mean score = 37.50, SD = 8.34. Figure 4 demonstrates the com-parison of the fatigue scores and indices in the alert state and the fatigue state. The change trends are quite similar as the results obtained in Experiment 1: four EEG indicesδ,θ,α, βand the ratio index (θ+α)/βexhibit an increasing tendency, while the ratio indexθ/α, SSVEP amplitude and SNR show an opposite tendency. The statistical test results of the indices are given in Table 2. Significant increases are found inδ(F(1, 8) = 8.70,p<0.05),α (F(1, 8) = 326.07,p< 0.001),β(F(1, 8) = 64.25,p< 0.001) and the ratio index (θ+α)/β(F (1, 8) = 53.38,p< 0.001), while significant decreases are found in the ratio indexθ/α(F (1, 8) = 83.34, p< 0.001), as well as the SSVEP amplitude (F(1, 8) = 35.88,p< 0.001) and SNR (F(1, 8) = 35.40,p< 0.001). There is no significant difference inθ(F(1, 8) = 1.42,p= 0.267) between the alert state and the fatigue state.
20 30 40
(a)
Fatigue Score1.85 1.9 1.95 2
(b)
δ1 1.2 1.4
(c)
θ0.9 1 1.1
(d)
α0.8 0.85 0.9 0.95
(e)
β1.1 1.2 1.3
(f)
θ/α2.4 2.6 2.8
(g)
(θ+α)/β3.8 4 4.2 4.4
(h)
SSVEP Amplitude2.2 2.3 2.4
(i)
SSVEP SNRAlert Fatigue Alert Fatigue Alert Fatigue
Discussion
Summary of evaluation results Experiment 1: single stimulus
The users’fatigue level is found significantly increased after the experiment assessed by the fatigue questionnaire. The statistical test results demonstrate that the indices δ, θ and α have significant differences between the alert state and the fatigue state. These results suggest that the increases inδ,θandαare associated with the increasing fatigue level along the SSVEP experiments. For the ratio indices θ/α and (θ+α)/β, both of them show significant differences between the alert state and the fatigue state. There-fore, the decrease inθ/αand the increase in (θ+α)/βare associated with the increasing fatigue level. Moreover, the experiment results indicate that both the amplitude and the SNR of the elicited SSVEPs are significantly decreased by the increasing fatigue level.
Experiment 2: multi-stimulus with different frequencies
The users’fatigue level is significantly increased after the experiment assessed by the fa-tigue questionnaire. The statistical test results demonstrate that the indices δ, α and β have significant differences between the alert state and the fatigue state. The increases in δ,αandβare associated with the increasing fatigue level along the SSVEP experiments.
20 30 40
(a)
Fatigue Score1.6 1.7 1.8
(b)
δ1.05 1.1 1.15 1.2
(c)
θ1.1 1.2 1.3 1.4
(d)
α0.7 0.72 0.74 0.76
(e)
β0.9 0.95 1 1.05
(f)
θ/α3 3.2 3.4 3.6
(g)
(θ+α)/β3 3.2 3.4 3.6
(h)
SSVEP Amplitude2 2.1 2.2
(i)
SSVEP SNRAlert Fatigue Alert Fatigue Alert Fatigue
Regarding the change of ratio indicesθ/αand (θ+α)/β, both of them show significant dif-ferences between the alert state and the fatigue state. Consistent with the results in Experi-ment 1, the decrease in θ/α and increase in (θ+α)/βare associated with the increasing fatigue level. Moreover, the experiment results show that the amplitude and the SNR of the elicited SSVEPs are significantly decreased by the increasing fatigue level, which are also consistent with the results in Experiment 1.
20 30 40
(a)
Fatigue Score1 1.05 1.1 1.15
(b)
δ0.54 0.58 0.62
(c)
θ0.62 0.66 0.7
(d)
α0.32 0.34 0.36 0.38
(e)
β0.5 0.52 0.54 0.56
(f)
θ/α3.9 4.1 4.3
(g)
(θ+α)/β1.4 1.5 1.6
(h)
SSVEP Amplitude1.8 1.9
(i)
SSVEP SNRAlert Fatigue Alert Fatigue Alert Fatigue
Figure 4Comparison of indices between the alert and fatigue states for Experiment 2.Comparison of the average values and SD of fatigue score, EEG indices, ratio indices, as well as SSVEP amplitude and SNR in the alert and fatigue states. Vertical axis for(b)-(i), amplitude (μV); horizontal axis for(a)-(i), Alert: alert state, Fatigue: fatigue state.
Table 1 Statistical test results for Experiment 1
Index Alert
Mean (SD)
Fatigue Mean (SD)
ANOVA Change
direction
F p
δ 1.62 (0.05) 1.77 (0.01) 41.77 <0.001 ↑
θ 1.08 (0.02) 1.18 (0.04) 17.72 <0.001 ↑
α 1.15 (0.07) 1.39 (0.04) 47.64 <0.001 ↑
β 0.73 (0.01) 0.74 (0.01) 2.59 =0.146 ―
θ/α 0.94 (0.05) 0.84 (0.01) 22.89 <0.001 ↓
(θ+α)/β 3.05 (0.10) 3.48 (0.07) 66.40 <0.001 ↑ SSVEP amplitude 3.48 (0.12) 3.11 (0.03) 44.32 <0.001 ↓
SSVEP SNR 2.22 (0.02) 2.02 (0.03) 145.29 <0.001 ↓
Feasibility and effectiveness of evaluation on fatigue by EEG spectral analysis
It is found that most of the results are consistent in two elaborate SSVEP-based BCI experiments with two different groups of participants. The significant increases in δ and α are found associated with the increasing fatigue level in both experiments. For theθandβindices, even the results are not consistent in two experiments, it is still ob-served that they have the same trends. For the ratio indexθ/α, because the change inα is more significant than the change inθ, the significant increase inθ/αis obtained and is associated with the increasing fatigue level in both experiments. For the ratio index (θ+α)/β, the significant increase is found associated with the increasing fatigue level in both experiments. Since θ and α have the same tendency while the change in β is smaller compared with the changes in θ and α, (θ+α)/β amplifies the difference be-tween θandα, which is sensitive in evaluating the fatigue. Despite some variations due to different settings in the two paradigms and individual differences, significant results are found in both experiments with the α,θ/αand (θ+α)/βindices. This demonstrates that EEG spectral analysis can provide consistent objective evaluation of the fatigue in SSVEP-based BCIs.
Moreover, it is found that the amplitude and the SNR of the elicited SSVEPs are sig-nificantly affected by the increasing fatigue level. The results support that the ampli-tude and SNR of the elicited SSVEPs are easily affected by mental states, fatigue, and degree of attention level. As significant mental effort is required to elicit SSVEP with high amplitude and SNR, the participants get fatigue easily. The decrement of arousal and the loss of attention caused by significant mental effort and repetitive stimulation will reduce the quality of the elicited SSVEPs. It is more difficult to elicit good quality SSVEPs in the fatigue state even the participants are still focusing on the targets. Fur-thermore, the decreases of the amplitude and the SNR of the elicited SSVEPs conse-quently deteriorate the discrimination accuracy, detection speed, ITR and overall performance of the BCI systems.
Physiological explanation
Some studies showed that theδwave is significantly increased when participants are get-ting fatigue [31,32]. Theδwave is the lowest brain activity which is usually associated with
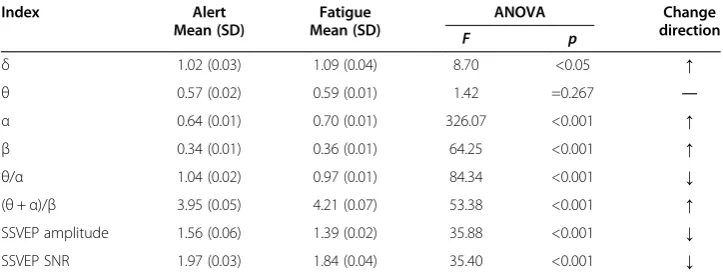
Table 2 Statistical test results for Experiment 2
Index Alert
Mean (SD)
Fatigue Mean (SD)
ANOVA Change
direction
F p
δ 1.02 (0.03) 1.09 (0.04) 8.70 <0.05 ↑
θ 0.57 (0.02) 0.59 (0.01) 1.42 =0.267 ―
α 0.64 (0.01) 0.70 (0.01) 326.07 <0.001 ↑
β 0.34 (0.01) 0.36 (0.01) 64.25 <0.001 ↑
θ/α 1.04 (0.02) 0.97 (0.01) 84.34 <0.001 ↓
(θ+α)/β 3.95 (0.05) 4.21 (0.07) 53.38 <0.001 ↑ SSVEP amplitude 1.56 (0.06) 1.39 (0.02) 35.88 <0.001 ↓
SSVEP SNR 1.97 (0.03) 1.84 (0.04) 35.40 <0.001 ↓
Alert Mean: average value of the first five trials in the experiment; Fatigue Mean: average value of the last five trials in the experiment. SD: standard deviation;↑: increase;↓: decrease;―: unchanged; degrees of freedom for
deep stages of sleep, and it is also a pathological slow wave and associated with a wide array of disorders [33]. When a participant is getting fatigue, the drowsiness and de-crease arousal level will elevate slow wave brain activities. However, the δ wave is easily influenced by artifacts which usually invade low EEG frequencies. In addition, all the participants in the experiments are in awake state and do not have any type of disorders. Therefore, it is not sure the significant increase inδ is associated with in-creasing fatigue level.
The increased θ wave was found associated with increasing fatigue level in many previous fatigue monitoring studies [5,31,32,34,35]. The θ wave is related to sleep, work memory, cognitive performance and a variety of mental states [22,33]. In-creased θ activity has been proven associated with generalized performance decre-ments, including working memory, information encoding and so forth [22]. When a user is getting fatigue along the experiment, the user will feel drowsy and tired with the capacity degraded due to the loss of attention and decrease of arousal.
The results in α wave were consistent with the existing studies showing that the significant increase in α activity is associated with the increasing fatigue level [5,24,31,34,35]. The α wave appears in the relaxed and effortless alertness mental state, and gives a relevant indication about the occurrence of a state of relaxation or of low arousal [33,34]. The increasedαactivity is associated with an increased men-tal effort to maintain vigilance level [22]. When participants are getting fatigue, their attention, concentration and vigilance level will decrease. Therefore, the participants need to put more attention and increase mental effort to focus on the target and maintain the vigilance level in the fatigue state compared with the alert state.
The increased β wave is associated with increasing alertness, arousal and excite-ment [33]. In this study, theβactivity shows an increasing trend over time. Previous studies about the association betweenβwave and fatigue are quite variable: theβ ac-tivity had been found altered in [36] with the increasing fatigue level, other studies reported significant increases in βwave [5] and decreases inβ [24] associated with increasing fatigue level, but no significant change in βaccording to other two litera-tures [32,37].
Conclusions
In this paper, an objective approach based on EEG spectral analysis is proposed to evalu-ate the fatigue in SSVEP-based BCIs. In order to prove the feasibility and effectiveness of the proposed method, two elaborate SSVEP-based BCI experiments are designed and tested with two different groups of participants. Consistent experiment results indicate that the significant increases in αand (θ+α)/β, as well as the decrease inθ/αare associ-ated with the increasing fatigue level. In addition, the experiment results also show that the amplitude and SNR of the elicited SSVEPs are significantly affected by users’fatigue in the SSVEP-based BCI experiments. The proposed approach would be promising in pro-viding an objective, quantitative and real-time measure of the fatigue in SSVEP-based BCIs. With such a measure a systematic study on the factors such as stimulus frequency, color and duty cycle, as well as their influences on fatigue in SSVEP-based BCIs could be performed, which would be helpful in understanding the fatigue problem and eventually the design of optimal SSVEP-based BCIs with the fatigue alleviated.
Competing interests
The authors declare that they have no competing interests.
Authors’contributions
FW and TC initiated the idea and conceived the study. TC, CMW and JNC designed and conducted experiments. TC performed data analysis, and drafted the manuscript. FW and YH supervised, revised and gave the final approval of the manuscript. All authors read and approved the final manuscript.
Acknowledgements
This work is supported in part by the Macau Science and Technology Development Fund under grant FDCT 036/2009/ A and the University of Macau Research Committee under grants MYRG139(Y1-L2)-FST11-WF, MYRG079(Y1-L2)-FST12-VMI, MYRG069(Y1-L2)-FST13-WF and MYRG2014-00174-FST.
Author details
1Department of Electrical and Computer Engineering, University of Macau, Macau, China.2Department of Orthopaedics
and Traumatology, The University of Hong Kong, Pokfulam, Hong Kong, China.
Received: 17 December 2013 Accepted: 5 March 2014 Published: 12 March 2014
References
1. Wolpaw JR, Birbaumer N, McFarland DJ, Pfurtscheller G, Vaughan TM:Brain-computer interfaces for communication and control.Clin Neurophysiol2002,113:767–791.
2. Wang Y, Gao X, Hong B, Jia C, Gao S:Brain-computer interfaces based on visual evoked potentials: feasibility of practical system designs.IEEE Eng Med Biol Mag2008,27:64–71.
3. Shen J, Barbera J, Shapiro CM:Distinguishing sleepiness and fatigue: focus on definition and measurement.
Sleep Med Rev2006,10:63–76.
4. Craig A, Tran Y, Wijesuriya N, Boord P:A controlled investigation into the psychological determinants of fatigue.Biol Psychol2006,72:78–87.
5. Craig A, Tran Y, Wijesuriya N, Nguyen H:Regional brain wave activity changes associated with fatigue.
Psychophysiology2012,49:574–582.
6. Van-Gerven M, Farquhar J, Schaefer R, Vlek R, Geuze J, Nijholt A, Ramsey N, Haselager P, Vuurpijl L, Gielen S, Desain P:The brain-computer interface cycle.J Neural Eng2009,6:041001.
7. Pinheiro CG, Naves EL, Pino P, Losson E, Andrade AO, Bourhis G:Alternative communication systems for people with severe motor disabilities: a survey.BioMed Eng OnLine2011,10:31.
8. Müller MM, Hillyard S:Concurrent recording of steady-state and transient event-related potentials as indices of visual-spatial selective attention.Clin Neurophysiol2000,111:1544–1552.
9. Toffanin P, De-Jong R, Johnson A, Martens S:Using frequency tagging to quantify attentional deployment in a visual divided attention task.Int J Psychophysiol2009,72:289–298.
10. Shyu K, Lee P, Liu Y, Sie J:Dual-frequency steady-state visual evoked potential for brain computer interface.
Neurosci Lett2010,483:28–31.
11. Lee P, Sie J, Liu Y, Wu C, Lee M, Shu C, Li P, Sun C, Shyu K:An SSVEP-actuated brain computer interface using phase-tagged flickering sequences: a cursor system.Ann Biomed Eng2010,38:2383–2397.
12. Müller-Putz GR, Pfurtscheller G:Control of an electrical prosthesis with an SSVEP-based BCI.IEEE Trans Biomed Eng2008,55:361–364.
13. Lopez-Gordo MA, Prieto A, Pelayo F, Morillas C:Customized stimulation enhances performance of independent binary SSVEP-BCIs.Clin Neurophysiol2011,122:128–133.
15. Volosyak I, Valbuena D, Lüth T, Malechka T, Gräser A:BCI demographics II: how many (and what kind of) people can use a high-frequency SSVEP BCI?IEEE Trans Neural Syst Rehabil Eng2011,19:232–239.
16. Lee P, Yeh C, Cheng J, Yang C, Lan G:An SSVEP-based BCI using high duty-cycle visual flicker.IEEE Trans Biomed Eng2011,58:3350–3359.
17. Chang M, Baek H, Lee S, Park K:An amplitude-modulated visual stimulation for reducing eye fatigue in SSVEP-based brain-computer interfaces.Clin Neurophysiol, in press.
18. Allison B, Lüth T, Valbunena D, Teymourian A, Volosyak I, Gräser A:BCI demographics: how many (and what kind of) people can use an SSVEP BCI?IEEE Trans Neural Syst Rehabil Eng2010,18:107–116.
19. Bieger J, Molia GG:Light stimulation properties to influence brain activity: a brain-computer interface application.Philips Research Technical Note2010, TN-2010-00315.
20. Allison BZ, Brunner C, Altstätter C, Wagner IC, Grissmann S, Neuper C:A hybrid ERD/SSVEP BCI for continuous simultaneous two dimensional cursor control.J Neurosci Methods2012,209:299–307.
21. Johns MW:A sleep physiologist’s view of the drowsy driver.Psychol Behav2000,3:241–249.
22. Klimesch W:EEG alpha and theta oscillations reflect cognitive and memory performance: a review and analysis.Brain Res Rev1999,29:169–195.
23. Lafrance C, Dumont M:Diurnal variations in the waking EEG: comparisons with sleep latencies and subjective alertness.J Sleep Res2000,9:243–248.
24. Eoh HJ, Chung MK, Kim S:Electroencephalographic study of drowsiness in simulated driving with sleep deprivation.Int J Ind Ergonom2005,35:307–320.
25. Cao T, Wong CM, Wan F, Hu Y:Objective indication of fatigue in SSVEP-based BCI through EEG spectral analysis.In Proceeding of the Fifth International Brain-Computer Interface Meeting: 3-7 June 2013; Pacific Grove. California, USA.Edited by Millán JR, Gao S, Müller-Putz GR, Wolpaw JR, Huggins JE. Verlag der Technischen Universität Graz; 2013:9. 26. Cella M, Chalder T:Measuring fatigue in clinical and community settings.J Psychosom Res2010,69:17–22. 27. Wang Y, Wang R, Gao X, Hong B:A practical VEP-based brain-computer interface.IEEE Trans Neural Syst Rehabil
Eng2006,14:234–240.
28. Japa BT, Lala S, Fischerb P, Bekiaris E:Using EEG spectral components to assess algorithms for detecting fatigue.Expert Syst Appl2009,36:2352–2359.
29. Cajochen C, Brunner DP, Kräuchi K, Graw P, Wirz-Justice A:Power density in theta/alpha frequencies of the wak-ing EEG progressively increases durwak-ing sustained wakefulness.Sleep1995,18:890–894.
30. Cajochen C, Kräuchi K, Arx MV, Möri M, Graw P, Wirz-Justice A:Daytime melatonin administration enhances sleepiness and theta/alpha activity in the waking EEG.Neurosci Lett1996,207:209–213.
31. Lal SKL, Craig A:Driver fatigue: electroencephalography and psychological assessment.Psychophysiology2002, 39:313–321.
32. Caldwell JA, Hall KK, Erickson BS:EEG data collected from helicopter pilots in flight are sufficiently sensitive to detect increased fatigue from sleep deprivation.Int J Aviat Psychol2002,12:19–32.
33. Steriade M, Gloor P, Llinas RR, Da-Silva FHL, Mesulam MM:Basic mechanisms of cerebral rhythmic activities.
Clin Neurophysiol1990,76:481–508.
34. Campagne A, Pebayle T, Muzet A:Correlation between driving errors and vigilance level: influence of the driver’s age.Physiol Behav2004,80:515–524.
35. Trejo LJ, Knuth K, Prado P, Rosipal R, Kubitz K, Kochavi R, Matthews B, Zhang Y:EEG-based estimation of cognitive fatigue: convergent evidence for three-state model.Lect Notes Comput Sc2007,4565:201–211. 36. Wierwille WW, Ellsworth LA:Evaluation of driver drowsiness by trained raters.Accid Anal Prev1994,26:5715–5781. 37. Tanaka H, Hayashi M, Hori T:Topographical characteristics and principal component structure of the
hypnagogic EEG.Sleep1997,20:523–534.
doi:10.1186/1475-925X-13-28
Cite this article as:Caoet al.:Objective evaluation of fatigue by EEG spectral analysis in steady-state visual
evoked potential-based brain-computer interfaces.BioMedical Engineering OnLine201413:28.
Submit your next manuscript to BioMed Central and take full advantage of:
• Convenient online submission
• Thorough peer review
• No space constraints or color figure charges
• Immediate publication on acceptance
• Inclusion in PubMed, CAS, Scopus and Google Scholar
• Research which is freely available for redistribution