Evaluating a Suite of Developer Activity Metrics as Measures of Security
Vulnerabilities
Andrew Meneely and Laurie Williams
North Carolina State University
{apmeneel, lawilli3}@ncsu.edu
Abstract
Deploying vulnerable software can be costly both in terms of patches and security breaches. Since software development primarily involves people, researchers are increasingly analyzing version control data to observe developer collaboration and contribution. We conducted a case study of the Linux kernel to evaluate a suite of developer activity metrics for the purpose of predicting security vulnerabilities. Our suite includes centrality and cluster metrics from network analysis of version control data. Our results support the hypothesis that source code files which have been developed by multiple clusters of developers are likely to be vulnerable. Furthermore, source code files are likely to be vulnerable when changed by many developers who themselves have made many changes to other files. Our results indicate that developer metrics predict vulnerabilities, but may be more likely to perform better in the presence of other code or process metrics.
1. Introduction
Deploying vulnerable software can be costly in terms of both patches and security breaches. Security problems are prevalent, as the number of vulnerabilities reported by the National Vulnerability Database (NVD)1 has more than doubled in the last four years. Development teams can guide their preventive fortification efforts by the prediction of security vulnerabilities. Vulnerability prediction is best performed with easily-obtained metrics that reflect a problematic element of the software project (e.g. maybe more developers cause more problems).
All software projects have one element in common: people. For the most part, software development is
1
http://nvd.nist.gov
performed by development teams working together on a common project. Lack of team cohesion, miscommunications, or misguided effort can all result in problematic software, including security problems.
One can gather information about people and the code they work on from data extracted from version control systems. Intending to capture information about how developers contribute to and collaborate on code, researchers have recently been evolving what we will call “developer activity metrics” by analyzing version control data [2, 3, 7, 10, 11, 14]. By viewing version control data as a network of “which developer worked on which file,” we can use network analysis to infer developer centrality, developer clusters, and types of contribution.
Our research objective is to empirically evaluate how developer activity metrics function as predictors of security vulnerabilities. Specifically, we evaluate
three hypotheses:
• HDNCentrality: Files changed by non-central developers are more likely to have security vulnerabilities than files changed by central developers.
• HDNCluster: Files changed by more than one developer cluster are more likely to be vulnerable than files changed by a single cluster.
• HCNCentrality: Files contributed to by many developers are more likely to have security vulnerabilities. Our metrics evaluation methodology is based on a previously-proposed metrics validation framework by Schneidewind [12] with the following validity criteria: association, consistency, discriminative power, and predictability. We also compare our results to a control metric, number of source lines of code (SLOC).
traced to a set of source files, so evaluation could be performed at the source code file level.
The rest of this paper is organized as follows. Section 2 provides terminology definitions for network analysis terminology and security metrics. Section 3 describes related work in security prediction and developer activity metrics. Sections 4, 5, 6, and 7 outline the metrics involved in this study, the validation framework, the case study, and threats to validity, respectively. We summarize our results in Section 8.
2. Background
We provide two types of background: definitions of terms and metrics in network analysis, along with terms used in our metrics evaluation.
2.1 Network Analysis Definitions
In this paper, we use several terms from network analysis [1] and define their meaning with respect to developer and contribution networks in Section 5. Network analysis is the study of characterizing and quantifying network structures, represented by graphs [1]. In network analysis, vertices of a graph are called
nodes, and edges are called connections. A sequence
of non-repeating, adjacent nodes is a path, and a shortest path between two nodes is called a geodesic
path (note that geodesic paths are not necessarily
unique). In the case of weighted edges, the geodesic path is the path of minimum weight. Informally, a geodesic path is the “social distance” from one node to another.
Centrality metrics are used to quantify the location
of one node relative to other nodes in the network. For direct connections, we use the degree metric, which is defined as the number of neighbors directly connected to a node. In the case of weighted edges, the weighted
degree of a node is the sum of all edge weights that
connect a node to its neighbors. For indirect connections via geodesic paths, we use the metrics
closeness and betweenness. The closeness of node
v
is defined as the average distance from
v
to any other node in the network that can be reached fromv
. Formally, the closeness Dc of nodev
in graph G is defined as)
,
(
)
|
)
,
(
|
1
(
)
(
d
v
t
v
G
V
v
D
G t
G
c
∑
∈
=
(1)where
d
G( t
v
,
)
is the distance (number of edges) fromnode
v
to nodet
and|
V
(
G
,
v
)
|
is the number ofnodes in the graph reachable from
v
.The betweenness [1] of node
v
is defined as the number of geodesic paths that includev
divided by the total number of geodesic paths in the network. In this study, we are only concerned with the relative betweenness of nodes or edges, so we report the non-normalized betweenness values (discarding the denominator). Similarly, the edge betweenness of edge e is defined as the number of geodesic paths which pass through e.2.2 Security Metrics Definitions
The goal of this paper is to evaluate the relationship between developer activity metrics and security vulnerabilities. We use the term internal metrics to describe our developer activity metrics. Internal metrics “measure internal attributes of the software related to design and code” [4]. We use the term
external metric to describe if a software component is
vulnerable or not. An external metric “represent[s] the external perspective of software quality when the software is in use”[4]. The only external metric we are evaluating in this study is nominal: whether or not a file is vulnerable or neutral. We consider a file to be vulnerable if it was found to have at least one
vulnerability that required a patch after release. A
vulnerability is “an instance of a [fault] in the specification, development, or configuration of software such that its execution can violate an [implicit or explicit] security policy” [5].
Since our external metric is nominal, our models will be binary classifiers. A binary classifier can make two possible errors: false positives (FP) and false negatives (FN). A FP is the classification of a neutral file as a vulnerable file, and a FN is the classification of a vulnerable file as neutral. A correctly classified vulnerable file is a true positive (TP), and a correctly classified neutral file is a true negative (TN). For evaluating binary classification, we use precision, recall, accuracy, and vulnerability rate.
• Precision (P) is defined as the proportion of
correctly predicted vulnerable files:
P=TP/(TP+FP).
• Recall (R) is defined as the proportion of
vulnerabilities found: R=TP/(TP+FN).
• Accuracy (A) is the proportion of files correctly
classified: A=(TP+TN)/(TP+TN+FP+FN).
• Vulnerability rate (VR) is the proportion of total
files that were classified as vulnerable:
VR=(TP+FP) /(TP+TN+FP+FN).
only to find no vulnerabilities is preferable to allowing a vulnerability to escape to the field. The vulnerability rate represents the percentage of files that would require testing or inspection to achieve the reported recall.
3. Related Work
Pinzger et al. [11] were the first to propose the contribution network that will be discussed in Section 5.2. The contribution network is designed to use version control data to quantify the direct and indirect contribution of developers on specific resources of the project. The researchers used metrics of centrality in their study of Microsoft Windows Vista and found that closeness was the most significant metric for predicting reliability failures. Files that were contributed to by many developers, especially by developers who were making many different contributions themselves, were found to be more failure-prone than files developed in relative isolation. The argument is that files which are being focused on by a few developers are less problematic than files developed by many developers. In our study, we use centrality metrics on contribution networks to predict vulnerabilities in files.
Nagappan et al. [10] created a logistic regression model for failures based on what they called “Overall Organizational Ownership” (OOW). The metrics for OOW included concepts like organizational cohesiveness and diverse contributions. Among the findings is that more edits made by many, non-cohesive developers leads to more problems post-release. The OOW model was able to predict with 87% average precision and 84% average recall. The OOW model bears a resemblance to the contribution network in that it attempts differentiate healthy changes in software from the problematic changes.
Zimmerman and Nagappan [15] applied network analysis to networks formed by module dependencies for predicting failures in files. Called a “dependency graph”, the researchers defined modules as nodes and two nodes are connected if one module depends on another. By applying metrics of centrality and network motifs to the directed dependency graphs of source code, the researchers found that central components were more failure-prone. Furthermore, network metrics proved to identify 60% of the critical, failure-prone binaries, which was better than object-oriented complexity metrics that only identified 30%. In addition to using centrality metrics of closeness and betweenness, Zimmerman and Nagappan used similar statistical regression techniques for their analysis that we used in our predictability criteria (see Section 6.3).
Several researchers have successfully used the number of developers in the presence of other metrics to predict post-release failures in files. Weyuker et al. [13] were able to incorporate information about the amount and the type of developers who worked on any given file. They reported finding 84.9% of the faults in 20% of the files with the developer information, where without the developer information, 83.9% of the faults were found. Mockus and Weiss [7] created a model that included both the number of developers and a measurement of developer experience. The experience metric was based on the number of commits made by a developer, implying that an experienced developer would make more commits than an inexperienced developer. Hudepohl et al. [3] at Nortel Networks also combined the number of developers with a similarly-defined developer experience metric in their model, EMERALD. Their metric included an experience metric both in terms of the given project and in terms of the developer’s Nortel career. Although our metrics do not include any explicit measurement of experience, contribution networks take into account the fact that some developers make many more commits than other developers without calling it “experience”.
Gonzales-Barahona and Lopez-Fernandez [2] were the first to propose the idea of creating developer networks as models of collaboration from source repositories to differentiate and characterize projects. In addition to a developer network, they used a module network such that two modules were connected if they were committed together. Module networks resemble contribution networks because if two files are committed at the same time, they are both connected to the same developer. Connections in module networks, therefore, become paths through a developer, resulting in similar centrality values as contribution network centrality values.
4. Case Study: Linux Kernel
We performed a case study on the Linux kernel2 as it was distributed in the Red Hat Enterprise Linux 4 (RHEL4) operating system3. Gathering data for our external metric involved tracing through the development artifacts related to each vulnerability reported in the Linux kernel.
When members of the open source community become aware of a possible security vulnerability, members of the Red Hat Security Response (RHSR) team perform the following actions.
2
http://kernel.org/
3
1. Create a defect report in the Red Hat Bugzilla database4. The majority of the subsequent artifacts can be found or linked to the new defect report. 2. Confirm the existence of the vulnerability in both
the current build of the kernel (also called the
upstream version), and the previous release of the
kernel (also called a backport).
3. Form patches to fix the problem as necessary. Sometimes an upstream patch would differ from the backport patch since the kernel is always evolving. 4. Determine if the vulnerability is a regression (a
vulnerability introduced by a patch after release). 5. Register the vulnerability in the National
Vulnerability database (NVD) and the next Red Hat Security Advisory (RHSA). The RHSR Team reports NVD and RHSA data on their security metrics website5.
We collected our security data from the Bugzilla database, the NVD database, and the RHSR security metrics database. Since each vulnerability was handled slightly differently, we examined each defect report manually to ensure that the backport patch was, in fact, needed. Since we are only interested in vulnerabilities that existed at the time of release, we did not include regressions in our data set. For vulnerabilities that did not have all of the relevant artifacts (e.g. defect reports, backport patches), we consulted the director of the RHSR team to correct the data. Our data set is a comprehensive list of reported, non-regression vulnerabilities from RHEL4’s release in February 2005 through July 2008. We included files that only had the following extension in their name: .c, .cpp, .S, and .h. We found 205 files to be vulnerable, which was 2% of the entire system.
For the version control data, we used the Linux kernel source repository6. The RHEL4 operating system is based on kernel version 2.6.9, so we used all of the version control data from kernel version 2.6.0 to 2.6.9, which was about approximately 15 months of development and maintenance. The version control data contains 557 developers and 9,946 commits over 10,454 source files. Most of the kernel had files changed (73%) during those 15 months, including every vulnerable file.
We used SAS7 v9.5 for our statistical analysis and Weka8 v3.4.12 for the Bayesian network prediction model. SLOC for each file was measured by
4
http://bugzilla.redhat.com/
5 http://www.redhat.com/security/data/metrics/ 6
http://git.kernel.org/
7
http://www.sas.com/
8
http://www.cs.waikato.ac.nz/ml/weka/
Understand C++9 for the .c and .h files, and SLOCCount10 was used for the assembly files.
5. Analyzing Developer Activity for
Organizational Observations
In our case study, we used the version control data to observe development activity. As the project progresses, developers make changes to many different parts of the system. With many changes and many developers, changes to files tend to overlap: some developers end up working on the same files around the same time, meaning that they share a common contribution, or a connection, with another developer. As a result of which files they contribute to, some developers end up connected to many other highly-connected developers, some end up in clusters of developers, and some tend stay peripheral to the entire network.
As for the source code, some files are contributed to by many developers who are also making contributions to many other files. Other files are essentially “owned” by developers.
Both developers and files become organized into a network structure with some developers/files being the middle of the network, in a cluster, or on the outside. In this section, we (a) quantify the structure of changes in the system using network analysis to create metrics, and (b) use the network analysis-based interpretation of the metrics to form testable hypotheses. We define our suite of developer activity metrics based on two networks: developer networks and contribution
networks, as will be discussed in Sections 5.1 and 5.2,
respectively.
Metrics that measure how nodes are directly or indirectly connected to the rest of the network are
centrality metrics [1]. A central node might have many
direct connections, that is, a node is directly connected
to many other nodes. A central node may also, for instance, be connected to other nodes that are connected to many other nodes, and so on. Said another way, a node may be central by how closely connected it is via indirect connections (by geodesic paths of length greater than one). Metrics that measure how nodes are directly or indirectly connected to the rest of the network are centrality metrics, which are described in Section 2.1 (degree, closeness, and betweenness). The concepts of centrality are used in all three categories of developer activity metrics.
9
http://www.scitools.com/
10
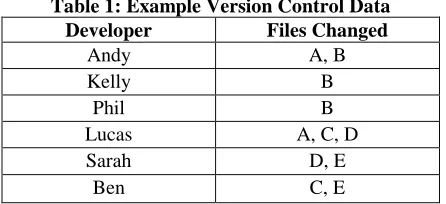
In Sections 5.1 and 5.2, we will use the following example. Suppose we are initially given the version control data in Table 1. In our example, we have six developers (Andy, Kelly, Phil, Lucas, Sarah, and Ben) and five files labeled A through E. The data in Table 1 denote who made changes to which file. Also, more examples of the calculation of developer activity metrics can be found in related work [6, 11].
Table 1: Example Version Control Data
Developer Files Changed
Andy A, B
Kelly B
Phil B
Lucas A, C, D
Sarah D, E
Ben C, E
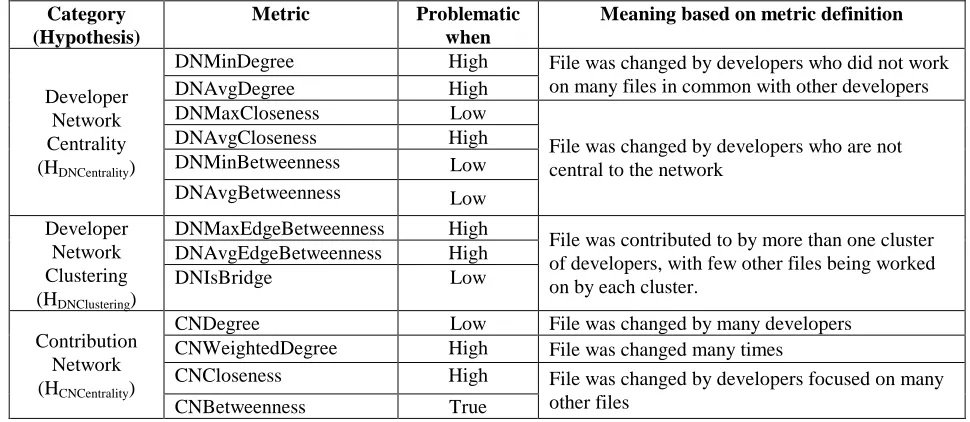
A summary of the interpretation for each metric can be found in Table 2. We empirically evaluate these thirteen metrics as predictors of vulnerable files in Section 6.
5.1 Developer Network
We use the term developer network to be an estimation of the structure of collaboration in a software development project based on developer connections within a software development project [2, 6]. In our developer network, two developers are connected if they have both made a change to at least one file in common during period of time under study. The result is an undirected, unweighted, and simple graph where each node represents a developer and edges are based on whether or not they have worked on the same file during the same release. For our example laid out in Table 1, the developer network is shown in Figure 1.
Figure 1: Resulting developer network from the Table 1
5.1.1 Developer Network Centrality. Each centrality
metric of the developer network captures a different aspect of a developer’s place in the network. A developer’s degree is equal to the number of other developers he or she share changes in files. A
developer with high betweenness is generally more central to the network, as a central developer would lie on more geodesic paths than a non-central developer. A developer with low closeness means that their average social distance is low, implying he or she is well-known. A deeper discussion regarding the meaning of centrality metrics in developer networks can be found in a previous project [6]. In this study, we are using developer network centrality metrics to evaluate the following hypothesis presented in Section 1:
HDNCentrality: Files changed by non-central
developers are more likely to have security vulnerabilities than files changed by central developers.
To evaluate developer activity metrics at the file level, each metric should reflect the network metrics of developers who updated the file throughout the file’s history. To calculate a file’s developer network centrality metrics, we examine a file’s change history in the source code repository, list all of the distinct developers who updated the file, and calculate the maximum/minimum (maximum for closeness, minimum for all other centrality metrics), and average of each developer activity metric over the file’s history. Values are calculated over a set of distinct developers, so if a developer updated a file twice, his or her metrics would only be used once.
We evaluate six metrics related to the centrality in developer networks: DNMinDegree, DNAvgDegree, DNMaxCloseness, DNAvgCloseness, DNMinBetweenness, DNAvgBetweenness
For example, suppose we are calculating the closeness of File B. The closeness of Andy is (1+1+1+1+2+2)/6 = 1.33. Similarly, Kelly and Phil each have closeness of (1+1+2+3+3)/6=1.66. DNAvgCloseness takes the average closeness of all the developers who changed a file, so the average of the three closeness values is 1.55.
5.1.2 Developer Network Clustering. Metrics of node
HDNCluster: Files changed by more than one cluster
are more likely to be vulnerable than files changed by a single cluster.
Cluster metrics of developer networks can be used to identify files that have been worked on by separate clusters of developers. For this study, we use the Edge Betweenness Clustering technique [1] for discovering developer clusters. Edge betweenness is defined similarly to node betweenness, only for edges: the number of geodesic paths in the network that include a given edge. The algorithm for edge betweenness clustering is:
1. Calculate the edge betweenness for each edge in the network
2. Remove the edge of highest betweenness 3. Repeat steps 1 and 2 until one node is isolated The remaining disconnected groups (i.e. weak components) of the network are the clusters of developers. The motivation for using edge betweenness is that the betweenness of edges within a cluster will be very low since the geodesic paths will be evenly distributed (in many cases, developers are directly connected to each other within clusters).
For developer networks, we are interested in identifying the files that lie between clusters. Since files have a many-to-many relationship to edges, we use the average and maximum of edge betweenness on the developer network. Also, we label a file as a bridge file if it was included in one of the removed edges in the edge betweenness clustering algorithm.
We evaluate three metrics related to clustering of developer networks: DNMaxEdgeBetweennnes, DNAvgEdgeBetweenness, DNIsBridge.
In our example, the edge of highest betweenness is the connection between Lucas and Andy. Upon removing the Lucas-Andy edge, two clusters form: Lucas/Sarah/Ben, and Andy/Kelly/Phil. Since file A is on the edge between two clusters, it is considered to be a bridge file.
5.2 Contribution Network
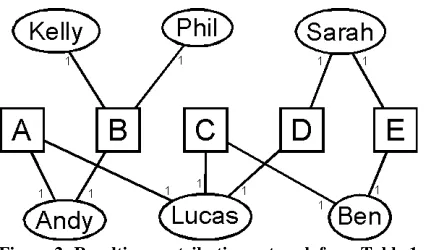
A contribution network is a quantification of the focus made on a given file. Originally described by Pinzger et al [11], the contribution network uses an undirected, weighted, and bipartite graph with two types of nodes: developers and files. An edge exists where a developer made changes to a file. Edges exist only between developers and files (not from developers to developers or files to files). The weight of an edge is the number of version control commits a developer made to the file.
The contribution network from the given example can be found in Figure 2. Note that all of the edges have a weight of one since each developer only made one change to each of his or her files.
Table 2: Summary of developer activity metrics suite
Category (Hypothesis)
Metric Problematic
when
Meaning based on metric definition
DNMinDegree High
DNAvgDegree High
File was changed by developers who did not work on many files in common with other developers DNMaxCloseness Low
DNAvgCloseness High DNMinBetweenness Low Developer
Network Centrality (HDNCentrality)
DNAvgBetweenness Low
File was changed by developers who are not central to the network
DNMaxEdgeBetweenness High DNAvgEdgeBetweenness High Developer
Network Clustering (HDNClustering)
DNIsBridge Low
File was contributed to by more than one cluster of developers, with few other files being worked on by each cluster.
CNDegree Low File was changed by many developers CNWeightedDegree High File was changed many times
CNCloseness High
Contribution Network (HCNCentrality)
CNBetweenness True
Figure 2: Resulting contribution network from Table 1
In contribution networks, files of high centrality have been found to be more problematic, since the effort was more diversified [11]. Centrality by direct connections is quantified by two metrics: a weighted degree and an unweighted degree. The weighted degree of a file is equivalent to the number of commits made to a file. The unweighted degree of a file is equivalent to the number of developers who made changes to the file. Both the number of commits and number of developers may be more commonly known as “code churn” metrics [6, 8, 9]. If a file has high closeness or betweenness, then that file was changed by many developers who made changes to many other files. If a file had a low closeness or betweenness, then the file was worked on by fewer developers who made fewer changes to other files. In this study we are using contribution network centrality metrics to evaluate the following hypothesis:
HCNCentrality: Files contributed to by many developers
are more likely to have security vulnerabilities.
We evaluate four metrics related to contribution networks in this study: CNDegree,
CNWeightedDegree, CNCloseness, CNBetweenness. For our example, the CNDegree for files A and B are two and three, respectively. This would mean that file A had a more focused contribution than file B.
6. Empirical Metric Evaluation
Our evaluation of developer activity metrics is based on the metrics validation framework proposed by Scheneidewind [12]. Evaluating metrics means “to determine whether they measure what they purport to measure” [12]; in this paper, we are evaluating how well developer activity metrics measure how vulnerable a file is. The metrics validation framework contains six validity criteria, four of which we will use in our evaluation: association, consistency, discriminative power, and predictability. The other two criteria, tracking and repeatability, do not apply to this project.
6.1 Association
The goal of the association validity criterion is to show the existence of a direct statistical connection between a developer activity metric and a file having any security vulnerabilities. Since we are evaluating the association of developer activity metrics to a nominal external metric (i.e. “vulnerable” or “neutral”), we use the non-parametric Mann-Whitney significance test to compare the mean of each metric for vulnerable and neutral files.
As shown in Table 3, out of the thirteen internal metrics, 12 had a statistically different average for vulnerable and neutral files at the p<0.05 level (as
Table 3: Association and consistency results
Category (Hypothesis)
Metric Neutral
Average
Vulnerable Average
Support Hypothesis?
Correlation Coefficient
DNMinDegree 76.9 42.8 Yes -0.05
DNAvgDegree 143.4 128.2 No 0.03
DNMaxCloseness 1.9 2.0 Yes 0.05
DNAvgCloseness 1.7 1.6 No -0.03
DNMinBetweenness 5351.3 2359.9 Yes -0.06
Developer Network Centrality (HDNCentrality)
DNAvgBetweenness 10549.0 12038.0 No 0.03
DNMaxEdgeBetweenness 33.3 132.8 Yes 0.13
DNAvgEdgeBetweenness 24.8 65.0 Yes 0.11
Developer Network Clustering
(HDNClustering) DNIsBridge 0.1 0.5 Yes 0.13
CNDegree 2.2 4.9 Yes 0.14
CNWeightedDegree 4.1 13.7 Yes 0.14
CNCloseness 4.1 4.1 N/A* 0.00
Contribution Network (HCNCentrality)
CNBetweenness 3662.8 12199.0 Yes 0.12
Baseline SLOC 271.5 676.4 Yes 0.11
shown in the “Support Hypothesis” column). CNCloseness was the only metric that did not exhibit any difference between vulnerable and neutral files.
The developer network centrality metrics provide mixed results. All of the metrics that average developer centrality indicate that files changed by central
developers are more likely to be vulnerable. However,
metrics which report the lowest developer centrality report that vulnerable files were changed by less
central developers. (Note that a low closeness means a
high centrality.) These conclusions are not completely contradictory, however. For example, having a high minimum betweenness means that all of the developers changing a file were central, as opposed to average of the developer centrality being higher. The mixed
association results, however, are not enough to accept the HDNCentrality hypothesis defined in Section 5.1.1.
The developer network clustering metrics were the most consistent in showing that files that lie between
clusters of developers are more vulnerable on average than files that lie within clusters. Thus, the association criterion supports the HDNClustering hypothesis defined in
Section 5.1.2.
The contribution network centrality metrics also supported HCNCentrality. While the difference in averages for CNCloseness was not significant, the other three centrality metrics for contribution networks were statistically higher for vulnerable files. This indicates that, on average, files with a divided contribution are
more vulnerable than files with a more focused contribution, supporting the HCNCentrality hypothesis
defined in Section 5.2.
6.2 Consistency
The goal of the consistency validity criterion is to show that ranks of individual developer activity metrics match the ranks of vulnerable files. Since binary classification leads to many ties in ranks, we used Kendall’s Tau correlation coefficient between each developer activity metric and having any security vulnerabilities.
The rightmost column of Table 3 denotes the correlation coefficients between the metric and the number of vulnerabilities with the file. All of the correlations, except CNCloseness, are statistically significant, but considerably weak. Correlations for individual metrics are usually somewhat weak as metrics perform best for prediction in combination with each other in a predictive model. The weak, yet
statistically significant consistency results indicate that, while all three hypotheses are supported, their purpose may be more meaningful in a multivariate model than used in isolation.
6.3 Discriminative Power
By evaluating the discriminative power of developer activity metrics, we are examining how well each metric can individually differentiate files as vulnerable or neutral. As suggested by Schneidewind [12], we used discriminant analysis to examine the discriminative power of each metric. We evaluated the discriminative power of each metric using hold-one-out cross validation with precision, recall, accuracy, and vulnerability rate as defined in Section 2.2.
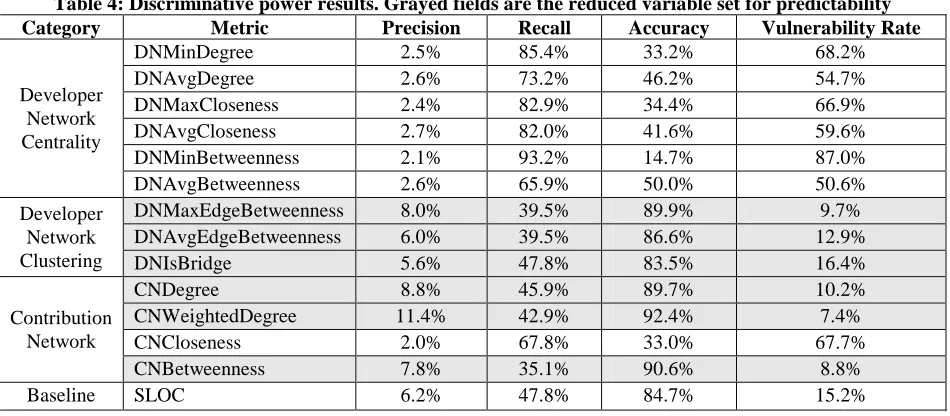
Hold-one-Table 4: Discriminative power results. Grayed fields are the reduced variable set for predictability
Category Metric Precision Recall Accuracy Vulnerability Rate
DNMinDegree 2.5% 85.4% 33.2% 68.2%
DNAvgDegree 2.6% 73.2% 46.2% 54.7%
DNMaxCloseness 2.4% 82.9% 34.4% 66.9%
DNAvgCloseness 2.7% 82.0% 41.6% 59.6%
DNMinBetweenness 2.1% 93.2% 14.7% 87.0%
Developer Network Centrality
DNAvgBetweenness 2.6% 65.9% 50.0% 50.6%
DNMaxEdgeBetweenness 8.0% 39.5% 89.9% 9.7% DNAvgEdgeBetweenness 6.0% 39.5% 86.6% 12.9% Developer
Network
Clustering DNIsBridge 5.6% 47.8% 83.5% 16.4%
CNDegree 8.8% 45.9% 89.7% 10.2%
CNWeightedDegree 11.4% 42.9% 92.4% 7.4%
CNCloseness 2.0% 67.8% 33.0% 67.7%
Contribution Network
CNBetweenness 7.8% 35.1% 90.6% 8.8%
out cross-validation is performed by iteratively removing each data point from the set, training on all but the removed data point, then predicting for the removed point. The evaluation results of the discriminant analysis can be found in Table 4.
The performance of each metric is relatively weak in our analysis. As indicated by the low precision, each classifier has significant problems with false positives. What is more encouraging, however, is that some classifiers (i.e. CNWeightedDegree, DNMaxEdgeBetweenness), caught over a third of the vulnerabilities while maintaining an accuracy of about 90%. Since each vulnerability can be costly, these results may be adequate for some applications. For example, if we chose to test the 9.7% of the files classified as vulnerable by DNMaxEdgeBetweenness alone, 8% of them would actually be vulnerable. However, by doing so we would find 39.5% of the total vulnerabilities. Since the precision is low, 9.7% of the kernel source files would need to be inspected instead of the optimal 2%.
Since developer network clustering and contribution network metrics can individually discriminate with a similar recall and precision of the SLOC baseline metric, the HDNClustering and HCNCentraliy
hypotheses are supported. Since none of the developer
network centrality metrics performed similarly to SLOC, HDNCentrality is not supported by the discriminative criterion.
Although the SLOC metric has a similar recall to the other metrics, the set of vulnerabilities that SLOC identifies are mostly different than what the developer activity metrics identify. To examine the overlap between the predictors, we cross tabulated the correct predictions of each developer activity metric and the correct predictions for SLOC. DNMaxEdgeBetweenness, for instance, correctly identified 27 vulnerabilities (13% of the total) that SLOC missed, and SLOC identified 44 vulnerabilities (21% of the total) that DNMaxEdgeBetweenness missed. Combining the two predictors finds 61.0% of the vulnerabilities in 20.3% of the files. That developer
activity metrics identify different vulnerabilities than
SLOC indicates that developer activity metrics may complement other code metrics in security prediction.
6.4 Predictability
The goal of the predictability validity criterion is to show how well developer metrics perform as group when classifying files as either vulnerable or neutral. For the predictability criterion, we formed five binary classification models based on our suite of developer activity metrics and our baseline metric SLOC. We used two methods of forming models: logistic regression and Bayesian Networks. Since our discriminant analysis showed that developer activity metrics were predicting different vulnerabilities than SLOC, we also evaluated developer activity metrics and SLOC together. Results were cross-validated as described in Section 6.3. Since Bayesian Networks work best with multiple variables, our Bayesian model for SLOC did not yield significant results. The precision, recall, accuracy, and vulnerability rate of the five models can be found in Table 5.
In all five models, the metrics performed with a higher recall than in discriminant analysis, however, still with a significant weakness in precision. Note also that SLOC performed with a similar weakness in precision. Logistic and Bayesian also traded off on recall versus precision when comparing the model types. The logistic regression had more false positives, requiring more files to be inspected; while Bayesian networks found fewer vulnerabilities, but required fewer files to be inspected.
6.5 Summary
In summary, the hypotheses HCNCentrality and HDNClustering are supported by all evaluation criteria, while HDNCentrality was not supported by all evaluation criteria. Also, the best predictors of vulnerable files complemented our baseline metric, meaning that developer activity metrics are best used in the presence of other metrics.
Table 5: Predictability Results
Model Variables Precision Recall Accuracy Vulnerability
Rate
Developer Metrics 5.6% 71.2% 75.9% 25.0%
SLOC 5.8% 51.2% 82.6% 17.4%
Logistic Regression
Developer Metrics & SLOC 5.8% 72.2% 76.4% 24.4% Developer Metrics 7.3% 47.3% 87.1% 12.8% Bayesian
7. Threats to Validity
All of our developer activity metrics require version control data, and therefore change in the system. For developer networks, if a file has no commits to it during the period of study, it has no developers in its history and therefore no measurement can be made. For a contribution network, not having any change to a file would result in centrality metrics of zero, implying a low number of vulnerabilities.
The means by which vulnerabilities are discovered can also have a significant impact on the meaning of our data set. Since we do not know whether or not our neutral files have any vulnerabilities or not, we must assume that the manner in which the vulnerabilities are discovered remain the same for both testers and attackers. Furthermore, we cannot say that our high rate of false positives is actually indicative of real false positives, or that our model is simply finding more vulnerabilities in the system that have not been confirmed.
8. Summary
We evaluated the relationship of a suite of developer activity metrics and security vulnerabilities in a case study of the Linux kernel. Our suite includes centrality and cluster metrics from network analysis of data from version control systems. An empirical analysis of our data demonstrates the following observations: (a) source code files changed by multiple clusters of developers are more likely to be vulnerable than changed by a single cluster; and (b) files are likely to be vulnerable when changed by many developers who themselves have made many changes to other files. Practitioners can use these observations to prioritize security fortification efforts or to consider organizational changes among developers. While the results are statistically significant, the weak correlations indicated that developer activity metrics are likely to perform best for prediction in the presence of other metrics.
9. Acknowledgements
We thank the Realsearch reading group and Mark Cox for their feedback on this paper. This research is supported by the Center for Advanced Computers and Communications.
10. References
[1] Network Analysis: Methodological Foundations. Berlin: Springer, 2005.
[2] Gonzales-Barahona, J. M., Lopez-Fernandez, L., and Robles, G., "Applying Social Network Analysis to the Information in CVS Repositories," in 2005 Mining
Software Repositories, Edinburgh, Scotland, United
Kingdom, 2004.
[3] Hudepohl, J. P., Aud, S. J., Khoshgoftaar, T. M., Allen, E. B., and Mayrand, J., "Emerald: Software Metrics and Models on the Desktop," IEEE Software, vol. 13, no.5, pp. 56-60, 1996.
[4] ISO, ISO/IEC DIS 14598-1 Information Technology - Software Product Evaluation, 1996.
[5] Krsul, "Software Vulnerability Analysis," in Computer Science West Lafayette: Purdue University, 1998. [6] Meneely, A., Williams, L., Osborne, J., and Snipes, W.,
"Predicting Failures with Developer Networks and Social Network Analysis " in Foundations in Software
Engineering, Atlanta, GA, 2008, p. to appear.
[7] Mockus, A. and Weiss, D. M., "Predicting Risk of Software Changes," Bell Labs Technical Journal, vol. 5,pp. 169-180, 2002.
[8] Munson, J. C. and Elbaum, S. G., "Code Churn: A Measure for Estimating the Impact of Code Change," in
IEEE International Conference on Software
Maintenance, 1998.
[9] Nagappan, N. and Ball, T., "Use of Relative Code Churn Measures to Predict System Defect Density," in
27th International Conference on Software
Engineering, St. Louis, MO, USA, 2005.
[10] Nagappan, N., Murphy, B., and Basili, V. R., "The Influence of Organizational Structure on Software Quality," in International Conference on Software
Engineering, Leipzig, Germany, 2008, pp. 521-530.
[11] Pinzger, M., Nagappan, N., and Murphy, B., "Can Developer-Module Networks Predict Failures?," in
Foundations in Software Engineering, Atlanta, GA,
2008, p. to appear.
[12] Schneidewind, N. F., "Methodology For Validating Software Metrics," IEEE Transactions on Software
Engineering, vol. 18, no.5, pp. 410-422, 1992.
[13] Weyuker, E. J., Ostrand, T. J., and Bell, R. M., "Using Developer Information as a Factor for Fault Prediction," in Predictor Models in Software Engineering, Minneapolis, Minnesota, 2007, pp. 8-8.
[14] Yu, L. and Ramaswamy, S., "Mining CVS Repositories to Understand Open-Source Project Developer Roles," in Fourth International Workshop on Mining Software
Repositories, Minneapolis, Minnesota, 2007, p. 4.
[15] Zimmermann, T. and Nagappan, N., "Predicting Defects using Network Analysis on Dependency Graphs," in
29th International Conference on Software