JIEM, 2014 – 7(1): 311-335 – Online ISSN: 2013-0953 – Print ISSN: 2013-8423 http://dx.doi.org/10.3926/jiem.1053
An LCA Study of an Electricity Coal Supply Chain
Chao Wang, Dong Mu
School of Economics and Management, Beijing Jiaotong University (China)
[email protected], [email protected]
Received: December 2013 Accepted: March 2014
Abstract:
Purpose:
The aim of this paper is to provide methods to find the emission source and estimate
the amount of waste gas emissions in the electricity coal supply chain, establish the model of
the environmental impact (burden) in the electricity coal supply chain, detect the critical factor
which causes significant environmental impact, and then identify the key control direction and
reduce amount of environmental pollution in the electricity coal supply chain.
Design/methodology/approach:
In this context, life cycle inventory and life cycle
assessment of China’s electricity coal were established in three difference stages: coal mining,
coal transportation, and coal burning. Then the outcomes were analyzed with the aim to reduce
waste gases emissions’ environmental impact in the electricity coal supply chain from the
perspective of sensitivity analysis.
in electricity coal supply chain is the most effective way to reduce the environmental impact of
waste gas emissions. (4) Of the three subsystems examined (coal mining, coal transportation,
and coal burning), transportation requires the fewest resources and has the lowest waste gas
emissions. However, the energy consumption for this subsystem is significant (excluding the
mine mouth case), and transportation distance is found to have a substantial effect on the oil
consumption and non-coal energy consumption. (5) In electricity coal supply chain, the biggest
environmental impact of waste gas emissions is GWP, followed by EP, AP, POCP and ODP,
and regional impact is greater than the global impact.
Practical implications:
The model and methodology established in this paper could be used
for environmental impact assessment of waste gas emissions in electricity coal supply chain and
sensitivity analysis in China, and it could supply reference and example for similar researches.
The data information on life cycle inventory, impact assessment and sensitivity analysis could
supply theory and data reference for waste gas emissions control in electricity coal supply chain.
Originality/value:
To the best of our knowledge, this is the first time to study the
environmental influence of electricity coal supply chain by employing a LCA approach from life
cycle of electricity coal.
Keywords:
life cycle assessment; electricity coal supply chain; sensitivity analysis
1. Introduction
According to the official data from the National Bureau of Statistic (CSY, 2013), in 2012, the velocity of national electric power grows overwhelmingly in the recent years in China. And 81% of the electricity was produced from the coal-fired power plant (IEA, 2010). Therefore, coal plays a dominant role in China economic growth. Coal accounts for almost 90% of China’s primary energy storage (Qiu, 2013) and accounts for about 70% of China’s primary energy production and consumption (Yan, 2006). Because of its abundance in proven reserves and its stability in supply, coal will continue to be a key component of primary energy mix in China at least over the next few decades (Li & Leung, 2012). However, coal also accounts for a large share of CO2 emissions generated by anthropogenic activities, and based on Miao (2009) over
70% of total SP, 90% of SO2, 67% of NOx, 85% of CO2 produced by fossil fuels come from coal
Electricity coal life cycle involves coal-mining, transportation and coal-burning process (Liu & Zhao, 2011) which is also called electricity coal supply chain. It has seriously adverse effects on natural environment and human society. Main waste gas emissions includes CO2, SO2, NOx
and smoke dust, which could cause acid rain, ozonosphere damage and global warming after emission. Coal-mining process can result in overburden waste and slag heaps, mine fires (Mann & Spath, 2001). The combustion of fuel for the coal transportation can result in air pollution, water pollution, traffic hazards etc. SO2, NOx and particulate matters are released from the
power plant in coal-burning process. However most researchers only give rise to the growing concern of the discharges and control methods of pollutants in coal burning process, not from the perspective of coal lifecycle, because of the high consumption of coal and high levels of waste emissions. Therefore, various measures have been taken to achieve better use of resources and energy as well as implement more sustainable practices in the coal-electricity system. Bates (1995), Uchiyama (1996), Restrepo, Miyake, Kleveston and Bazzo (2012) and Liang, Wang, Zhou, Huang, Zhou and Cen (2012) aimed at power plants in U.K, Japan, Brail and China respectively, studied the power plants’ influence on environment with a Life Cycle Assessment (LCA) method. Pacca and Horvath (2002) calculated Global Warming Potential (GWP) of coal, gas, solar power and wind energy power plants. Hondo (2005) calculated greenhouse gas emission in eight power plants’ construction, operation and retirement processes in Japan, using LCA method, process analysis and input-output analysis method. Kannan, Leong, Osman and Ho (2007) studied on five power plants and their influence on environment in Singapore from the point of power generation technology with LCA and LCC methods.
2. The case study
The electricity coal supply chain involves the coal mining process, coal transportation process and coal burning process, all based in China. The goal of coal mining is to remove coal from the ground. After coal preparation/cleaning, coal is moved to the coal-fired power plant by barge, rail or truck. This paper presents a thorough case study of the environmental impact of waste gas emissions in an electricity coal supply chain, where the coal is mined by an underground colliery- Jiangzhuang Coal Mine (JZCM) of Zaozhuang Coal Mining Group Co.,Ltd. and is transported 93 Km by heavy-truck and then burned at Shiliquan Plant (SLQP) of Zaozhuang which is a coal-fired power plant.
2.1. Coal mining process
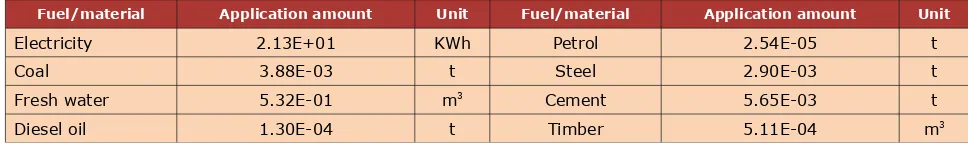
Underground mining operations include: cutting, drilling, blasting, loading, and hauling. Auxiliary operations include ventilation, drainage, power, communications, and lighting. Roof support is another task which is considered to be a unit operation. The raw coal output of JZCM was 3.4 million tons in 2012. In the same year, it used 1.81 million m3 fresh water, 0.44 thousand
tons of diesel oil, 0.086 thousand tones of petrol, 9.87 thousand tons of steel, 19.7 thousand tons of cement and 1.74 thousand m3 of timber. The energy consumption includes 7.23 million
kWh of electricity and 13.2 thousand tons of coal. It produced waste comprising 0.461 million tons of coal gangues, 0.235 million tons of washed gangue, 0.168 million tons of coal slurry, 1.78 million tons of mining wastewater and other waste. Table 1 gives the underground mining equipment fuel and material requirement, and Table 2 gives a breakdown of the electrical details. The research result of Clean Production Standard in Coal Washing and Processing Industry (2010) shows that electricity consumption of raw coal production in state-owned key coal mines usually ranges between 15 kWh/t and 25 kWh/t, and the rock bottom electricity consumption reaches 4.4 kWh/t.
Fuel/material Application amount Unit Fuel/material Application amount Unit
Electricity 2.13E+01 KWh Petrol 2.54E-05 t
Coal 3.88E-03 t Steel 2.90E-03 t
Fresh water 5.32E-01 m3 Cement 5.65E-03 t
Diesel oil 1.30E-04 t Timber 5.11E-04 m3
Equipment Total(kW) Hours used/day Load (kW) Electrical consumption MWh/day kWh/day/Mt coal
Longwall unit 1860 16 1860 29.76 21.4
Continuous miner 890 10 890 8.90 6.1
Loading machine 245 10 245 2.45 2.9
Shuttle car 423 10 423 4.23 3.1
Roof bolter 85 12 85 1.02 0.8
Ratio feeder 196 10 197 1.96 1.8
Triple-rock duster 70 12 70 0.84 0.7
Auxiliary fan 25 18 25 0.45 0.4
Supply car 209 12 209 2.51 1.7
Conveyor 596 16 596 9.54 7.3
Ventilation fan 375 24 375 9.00 6.9
Pumps, bolting 315 10 315 3.15 3.0
Lighting N/A 24 268 6.43 4.8
Table 2. Underground mining electrical requirements
Techniques Process Equipment
Screening Screen grader
Crushing Crusher
Jig washing Jigger, heavy-media separator, heavy medium cyclone
Dewatering Dewatering centrifuge
Loading Truck, crane
Table 3. Coal preparation equipment requirements
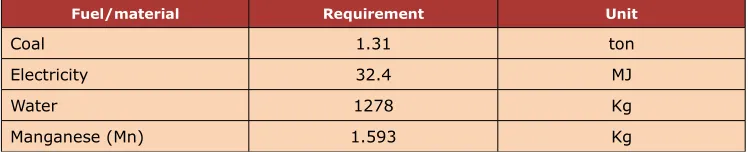
Fuel/material Requirement Unit
Coal 1.31 ton
Electricity 32.4 MJ
Water 1278 Kg
Manganese (Mn) 1.593 Kg
Table 4. Coal preparation fuel and material requirement (Unit: /of ton MAF raw coal)
2.2. Coal transportation process
In China, the main transportation methods are railways, highways and waterways. In the coal transportation process, this paper only considers coal that is transported from the coal mine to the power plant. Ammonium nitrate and other blasting materials which are transported to the coal mine, and ammonia (NH3), hydrogen chloride (HCl), sodium hydroxide (NaOH), calcium
carbonate (CaCO3), etc, which are transported to the power plant are not included in the LCA.
According to the investigation, from JZCM to SLQP, the coal is shipped by steyr-king heavy duty trucks which have a loading capacity of 24 tons. The distance is 93 Km, the total diesel fuel consumption is 36L, and the transportation routing is presented in Figure 1.
2.3. Coal burning process
The burning process occurred in coal-fired power plants, and data collected from SLQP are as show below. The total installed capacity is 1225 MW, and the power generation is 8.39 billion kW. In 2012, SLQP consumed 1.91 million tons of raw coal, 1.62 million tons of coal gangue, 2.76 million tons of coal slurry, and 58.30 million tons of fresh water. The power plant inventory includes energy and non-energy (material) demand (See Table 5).
Number of generators 4 Raw coal 227 (g/KWh)
Installed capacity 1225 (MW) Diesel 194 (g/KWh)
Installation time Apr. 1995 Fresh water 6.94E-03 (g/KWh)
Efficiency 32% Electricity 1.16E-01 (KWh)
Fuel type Lean coal Water consumption 33595 (t/day)
Ammonia water N/A (g/KWh) Cooling water 56000 (t/h)
Coal slurry 329 (g/KWh) Power capacity 8.29 (GWh)
Coal gangue 192 (g/KWh) Pollution control system ESP
Middlings 65.4 (g/KWh) Generator life expectancy 30 (year)
Pollution control equipment ESP Generator type Pulverized coal boiler
Fuel properties Low Calorific Value =22675KJ/Kg,Sulf concent=1.24%,ash concent=26.82%
Table 5. Power plant inventory
3. Life cycle analysis of the electricity coal supply chain
An LCA approach is adopted to investigate the cumulative environmental burden produced by the supply chain generating 1 kWh of electricity (reference flow).
3.1. Goal and scope definition
The overall objectives of the LCA study are to:
• Demonstrate the usefulness of the LCA method in measuring the environmental impacts of a defined electricity coal supply chain system.
• Provide an overall understanding of an electricity coal supply chain and the associated environmental burden involved in the main processes of the supply chain.
• Highlight important areas for future research (further LCA studies concerning coal cinder utilization and the cost factor).
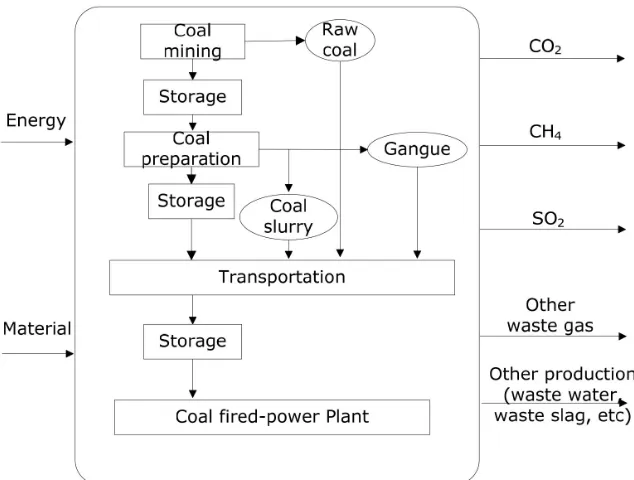
The scope of the LCA study (system boundary) is defined as follows: The system starts with the mining of coal and ends with electricity as the product. The main processes are the coal mining process, coal transportation process and coal burning process. The power plant which supplies energy to the supply chain is included in the system.
Figure 2. System boundary of the electricity coal supply chain
Based on the scope of the LCA, the supply chain model is displayed in Figure 2. The model represents a “Mining to Products (MTP)” system as distinct from a “Cradle to Grave” system. This means that coal’s end of life (recycling) is not included in the study.
3.2. Life cycle inventory (LCI) 3.2.1. Main processes
3.2.1.1. Coal mining process
In the coal mining process, a lot of waste gases will be released. For example, greenhouse gases like CO2 and CH4 will be released during the coal mining process, and gases like CO2, SO2,
CO and H2S will be spontaneously released from coal gangues. The mining process has great
effects on the regional ecological environment, with the major sources of waste gases being the mine ventilation process, coal gangue, and the coal preparation process. All emissions of waste gases in the mining process are listed in Appendix A.
3.2.1.2. Coal transportation process
The atmospheric environmental problems arising in the coal transportation process are mainly caused by the burning of transport fuels, spontaneous combustion of coal in the process of transportation and coal dust pollution near the transport route. Main waste gases consist of HC, CO, NOx, SO2 and H2S. Considering the coal transport from JZCM to SLQP by heavy duty
trucks, all emissions of waste gases in the coal transportation process are listed in Appendix A.
3.2.1.3. Coal burning process
The coal-fired power plants in coal burning process often burn large quantities of low grade coal with high sulfur and high ash, even coal gangues, and are adjudged as the greatest sources of waste gases in China. Waste gases from burning mainly contain CO2, SO2, CO and
NOx. The direct consequence is that smoke dust and SO2 emissions are dominant among
emissions from industrial various sectors in China (Zhao, Wang, Nielsen, Li & Hao, 2010). In fact, the emissions of SO2 from coal and electricity account for more than 59% of the emissions
in Controlled Zones for Acid rain and Sulfur Dioxide (Lu, Streets, Zhang, Wang, Carmichael, Cheng et al., 2010). All emissions of waste gases in the coal burning process are listed in Appendix A.
3.2.2. Interpretation of LCI
Appendix A represents waste gas emissions in the coal mining process, coal transportation process and coal burning process in the electricity coal supply chain. It is seen that:
• In terms of total air emissions, CO2 is emitted in the greatest quality, accounting for
98.8% wt% of the total air emissions for all processes examined. The vast majority of CO2, about 93.6%, is emitted from the power plant when the coal is combusted. (See Table
• Excluding the CO2, the main waste gases emissions in the electricity coal supply chain
are displayed in Table 6. The largest proportion of the main waste gases is CH4, because
JZCM is a high gas mine which releases 200m3 CH
4 from CBM in producing one ton of
coal. SO2 mainly comes from the coal burning process. Because there is no
denitrification process in SLQP, the percentage of NOx in the burning process, mining
process and transportation process is 66.5%, 28% and 5.56% respectively.
Process in electricity supply chain CO2
Other mainly waste gas
CH4 SO2 NOx
(g/KWh) (%) (g/KWh) (g/KWh) (g/KWh)
Coal mining process (g/KWh) (a) 50.328 5.17 3.58E+00 4.01E-01 3.67E-01
Coal transportation process (g/kWh) (b) 11.981 1.23 1.93E-04 7.98E-02 2.64E-03
Coal burning process (g/KWh) (c) 910.22 93.6 3.72E+00 9.54E-01 8.20E-01
Sum (g/KWh) 972.53 100 7.30 1.43 1.19
Note:
(a) Mining process is the underground mining process of JZCM;
(b) Transportation process is that coal is transported 93Km by truck from JZCM to SHQP; (c) Burning process is that coal is burned by SHQP.
Table 6. Main waste gas emissions
3.3. Impact assessment and discussion
GaBi 4 Education software (PE Intentional, 2011) is used to carry out the impact assessment stage of the case study. Gabi 4’s CML 2001 is adopted to calculate the following environmental impacts: (i) Global Warming Potential (GWP), (ii) Eutrophication Potential (EP), (iii) Photochemical Oxidants Creation Potential (POCP), (iv) Acidification Potential (AP), (v) Ozone Depletion Potential (ODP). The impact assessment method consists of three steps: characterization, normalization and final weighted scores.
3.3.1. Characterization
In this step, the LCI data are sorted into ‘‘classes’’ or environmental impact categories according to the effect they have on the environment. For example, CO2 will be classified under
3.3.1.1. Global Warming Potential
Global Warming Potential (GWP) is derived by summing the emissions of the GHG multiplied by their respective GWP factors. The gases that contribute to Global Warming Potential are mainly CO, CO2, CH4, and N2O. GWP in the electricity coal supply chain is calculated in Table 7. In the
coal life cycle, GWP mainly occurs in the coal burning process. So reducing the emissions of CO2 and N2O in the coal burning process is the main approach to decrease GWP in the
electricity coal supply chain.
Mining Process TransportationProcess Burning Process
Stressors CO2 CH4 N2O CO2 CH4 N2O CO2 CH4 N2O
Amount 50.33 3.58 0.00 11.98 0.19 0.00 910.22 0.04 0.04
Normalization g CO2 -Equiv. 50.33 89.38 0.22 11.98 4.83 0.09 910.22 93.07 11.72
Normalization g CO2 -Equiv. (Process) 139.93 16.90 922.87
Normalization g CO2 -Equiv.
(Electricity Coal Supply Chain) 1079.71
Note: Data in above table rounded off to two decimals.
Table 7. GWP of waste gases in electricity coal supply chain (g/KWh)
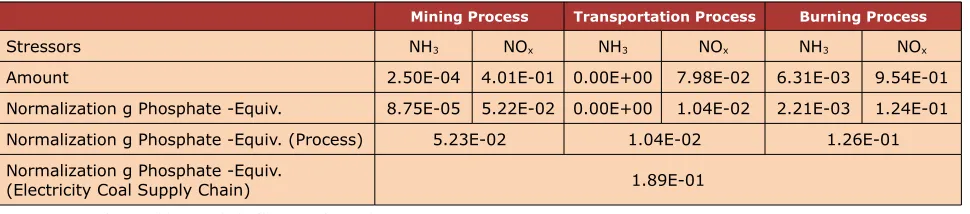
3.3.1.2. Eutrophication Potential
Eutrophication Potential (EP) is defined as the potential of nutrients to cause over-fertilization of water and soil which in turn can result in increased growth of biomass. EP in the electricity coal supply chain is calculated in Table 8. In the coal life cycle, EP mainly occurs in the coal burning process. So reducing the emissions of NH3 and NOx in the coal burning process is the
main approach to decrease EP in the electricity coal supply chain.
Mining Process Transportation Process Burning Process
Stressors NH3 NOx NH3 NOx NH3 NOx
Amount 2.50E-04 4.01E-01 0.00E+00 7.98E-02 6.31E-03 9.54E-01
Normalization g Phosphate -Equiv. 8.75E-05 5.22E-02 0.00E+00 1.04E-02 2.21E-03 1.24E-01
Normalization g Phosphate -Equiv. (Process) 5.23E-02 1.04E-02 1.26E-01
Normalization g Phosphate -Equiv.
(Electricity Coal Supply Chain) 1.89E-01
Note: Data in above table rounded off to two decimals.
3.3.1.3. Photochemical Oxidants Creation Potential
Photochemical Oxidants Creation Potential (POCP) is related to the potential for VOCs and oxides of nitrogen to generate photochemical or summer smog. It is usually expressed relative to the POCP classification factor for ethylene. POCP in the electricity coal supply chain is calculated in Table 9. In the coal life cycle, POCP mainly occurs in the coal mining process. So reducing the emissions of CH4, CO and NMVOC in coal mining process is the main approach to
decrease POCP in the electricity coal supply chain.
Mining Process Transportation Process Burning Process
Stressors CH4 CO NMVOC CH4 CO NMVOC CH4 CO NMVOC
Amount E+003.58 E-011.11 E-023.24 1.93E-01 E-021.90 E-033.21 E-023.72 E-011.68 E-022.35
Normalization g Ethene
-Equiv. E-022.15 E-033.01 E-021.18 1.16E-03 E-045.14 E-031.17 E-042.23 E-034.53 E-038.57 Normalization g Ethene
-Equiv. (Process) 3.63E-02 2.84E-03 1.33E-02
Normalization g Ethene -Equiv.
(Electricity Coal Supply Chain) 5.24E-02
Note: Data in above table rounded off to two decimals.
Table 9. POCP of waste gases in electricity coal supply chain (g/KWh)
3.3.1.4. Acidification Potential
Acidification Potential (AP) is based on the contributions of SO2, NOx, HCl, NH3 and HF to the
potential acid deposition in the form of H+ (protons). Appendix A shows that SO2, NOx, HCl,
HF and NH3 mainly come from coal mining process and transportation process, and emissions
of HCl, HF and NH3 relative to emissions of SO2 and NOx are negligible. AP in the electricity coal
supply chain is calculated in Table 10. In the coal life cycle, AP mainly occurs in the coal burning process. So reducing the emissions of SO2 and NOx in the coal burning process is the
main approach to decrease AP in the electricity coal supply chain.
Mining Process Transportation Process Burning Process
Stressors NOx SO2 NOx SO2 NOx SO2
Amount 4.01E-01 3.67E-01 7.98E-02 2.64E-03 9.54E-01 8.20E-01
Normalization g SO2 -Equiv. 2.81E-01 3.67E-01 5.59E-02 2.64E-03 6.68E-01 8.20E-01
Normalization g SO2 -Equiv. (Process) 6.48E-01 5.85E-02 1.49E+00
Normalization g SO2 -Equiv.
(Electricity Coal Supply Chain) 2.19E+00
3.3.1.5. Ozone Depletion Potential
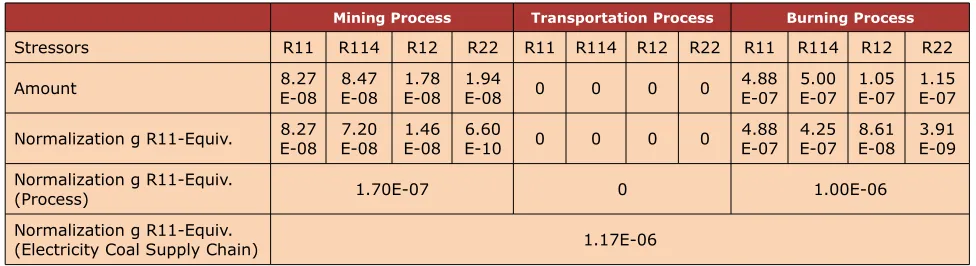
Ozone Depletion Potential (ODP) indicates the potential for emissions of chlorofluorocarbon (CFC) compounds and other halogenated hydrocarbons to deplete the ozone layer. ODP in the electricity coal supply chain is calculated in Table 11. In the coal life cycle, ODP mainly occurs in the coal burning process. So reducing the emissions of CFC-11, R114, R12 and R22 in the coal burning process is the main approach to decrease ODP in the electricity coal supply chain.
Mining Process Transportation Process Burning Process
Stressors R11 R114 R12 R22 R11 R114 R12 R22 R11 R114 R12 R22
Amount 8.27E-08 E-088.47 1.78E-08 E-081.94 0 0 0 0 4.88E-07 5.00E-07 E-071.05 1.15E-07
Normalization g R11-Equiv. 8.27E-08 E-087.20 1.46E-08 E-106.60 0 0 0 0 4.88E-07 4.25E-07 E-088.61 3.91E-09
Normalization g R11-Equiv.
(Process) 1.70E-07 0 1.00E-06
Normalization g R11-Equiv.
(Electricity Coal Supply Chain) 1.17E-06
Note: Data in above table rounded off to two decimals.
Table 11. ODP of waste gases in electricity coal supply chain (g/KWh)
Based on the above analysis, GWP, EP, POCP, AP and ODP in the coal mining process, coal transportation process and coal burning process are shown in Table 12.
Classification ProcessMining TransportationProcess BurningProcess Electricity CoalSupply Chain Unit
GWP 1.40E-01 1.69E-02 9.23E-01 1.08E+00 kg CO2-Equiv.
EP 5.23E-05 1.04E-05 1.26E-04 1.89E-04 kg PO43-Equiv.
POCP 3.63E-05 2.84E-06 1.33E-05 5.24E-05 kg C2H4-Equiv.
AP 6.57E-04 5.85E-05 1.51E-03 2.22E-03 kg SO2-Equiv.
ODP 1.70E-10 0.00E+00 1.00E-09 1.17E-09 kg R11-Equiv.
Table 12. Impact assessment of each process in electricity coal supply chain
3.3.2. Normalization
Hauschild, Alting & editors, 1997), EDIP 2003 (Dreyer, Niemann & Hauschild, 2003), IMPACT 2002+ (Jolliet, Margni, Charles, Humbert, Payet, Rebitzer et al., 2003), Ecological Scarcity (UBP Method) (Frischknecht, Steiner & Jungbluth, 2009) and so on. However, the shortcomings of these methods are that most indicators, normalization factors and weighting factors are based on the data of Netherlands, Denmark, and the European Union. Because these normalization factor and weighting factors depend on the actual conditions of a particular country or region, they cannot be used to process the data of the Chinese electricity coal supply chain. Thus, this paper uses Chinese normalization factors and weighting factors given by the Environment Research Center in Chinese Academy of Science and Technical University of Denmark (Yang, Cheng & Wang, 2002). Table 13 illustrates that in the electricity coal supply chain, the biggest environmental impact of waste gas emissions is GWP, followed by EP, POCP, AP and ODP.
3.3.3. Final weighted scores
It is assumed that the relative importance of various impacts is the same. However, in fact, the relative importance of various impacts is different, which on the one hand depends on the characteristics of the environment itself, while on the other hand this reflects the current understanding of human society and its degree of concern. In the final stage, the normalized scores are multiplied by a weighting factor representing the relative importance of the total environmental impact. The environmental impacts of GWP, EP, POCP, AP and ODP after weighting are shown in Table 13. It is seen that the coal burning process has the biggest environmental impact, followed by the coal mining process and the coal transportation process.
Classification Step processMining Transportationprocess Burningprocess Electricity coalsupply chain Category Environmentalburden
Global
GWP Normalization 1.61E-05 1.94E-06 1.06E-04 1.24E-04
1.03E-04
2.61E-04 Weighting 1.34E-05 1.61E-06 8.81E-05 1.03E-04
ODP Normalization 8.50E-10 0.00E+00 5.00E-09 5.85E-09 Weighting 2.30E-09 0.00E+00 1.35E-08 1.58E-08
Regional
AP Normalization 1.88E-05 1.67E-06 4.31E-05 6.34E-05
1.58E-04 Weighting 1.37E-05 1.22E-06 3.15E-05 4.63E-05
EP Normalization 2.84E-05 5.65E-06 6.85E-05 1.03E-04 Weighting 2.07E-05 4.13E-06 5.00E-05 7.50E-05
POCP Normalization 4.78E-05 3.74E-06 1.75E-05 6.89E-05 Weighting 2.53E-05 1.98E-06 9.28E-06 3.65E-05
Sum Weighting 7.31E-05 8.94E-06 1.79E-04 2.61E-04
Table 13. Impact assessment in electricity coal supply chain (Unit: man·a)
4. Sensitivity analysis
A sensitivity analysis was conducted to determine the parameters that had the largest effect on the results and to determine the impact of estimated data as well as variations in data on the conclusions. One variable may affect several factors and thus several process steps, or it may affect only one process in the overall life cycle assessment. For instance, changing the coal-burning efficiency can affect the amount of coal required at the plant, which in turn affects the coal mining and transportation requirements. However, varying the transportation distance affects only the emissions associated with the coal transportation process. These effects were taken into account automatically in the LCA model. The base case assumed transportation to the average user (QLQP) by truck. The following are abbreviations used in the different sensitivity analyses: A means base case; B means CH4 utilization ratio is 30%; C
means nearest user; D means farthest user; E means increase coal-burning efficiency by 5 points; F means decrease coal-burning efficiency by 5 points.
4.1. Coal mining process - utilization ratio of CH4 sensitivity analysis
CH4 emissions in the electricity coal supply chain is mainly caused by the emissions of CBM in
the coal mining process, which accounts for 94% of the total CH4 emissions in the electricity
coal supply chain. So the reduction of CH4 emissions mainly focuses on the coal mining
process, and the utilization of CH4 as an alternative mode of power generation. At present, the
mature technology, with the main technologies being gas turbine power generation, steam turbine power generation, gas-fired generator power generation, combined cycle system power generation and CHER power generation.
The coal seam in JZCM has low air permeability and the coal bed is soft, so recovery and utilization of CBM is quite difficult. In addition, without data about power consumption of CH4
recovery equipment, the waste gas emissions from the equipment is ignored. Thus, this paper considers the environmental impacts caused by waste gas emissions in the electricity coal supply chain based on the assumption that the utilization ratio of CH4 can reach 30%. The
results are shown in Table 14 and a comparative analysis of impact assessment is made in Table 15.
Classification Environmental burden Normalization factor Normalization Weightingfactor Weighting
GWP 1.05E+00 kg CO2-Equiv. 8700 Kg CO2 eq./(man·a) 1.21E-04man·a 0.83 1.00E-04man·a
EP 1.89E-04 kg PO43-Equiv. 1.84 Kg PO43- eq./(man·a) 1.03E-04man·a 0.73 7.52E-05man·a
POCP 4.85E-05 kg C2H4-Equiv. 0.76 Kg C2H4 eq./(man·a) 6.38E-05man·a 0.53 3.38E-05man·a
AP 2.22E-03 kg SO2-Equiv. 35 Kg SO2 eq./(man·a) 6.34E-05man·a 0.73 4.63E-05man·a
ODP 1.17E-09 kg R11-Equiv. 0.2 Kg R11 eq./(man·a) 5.85E-09man·a 2.7 1.58E-08man·a
Table 14. Normalization and weighting analysis (utilization rate of CH4 is 30%)
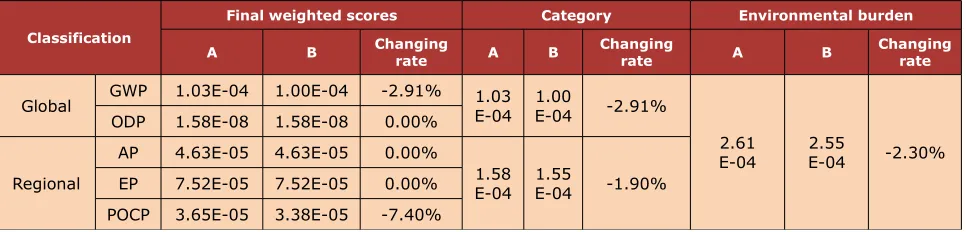
Classification
Final weighted scores Category Environmental burden
A B Changingrate A B Changingrate A B Changingrate
Global GWP 1.03E-04 1.00E-04 -2.91% 1.03E-04 1.00E-04 -2.91%
2.61
E-04 2.55E-04 -2.30% ODP 1.58E-08 1.58E-08 0.00%
Regional
AP 4.63E-05 4.63E-05 0.00%
1.58
E-04 1.55E-04 -1.90% EP 7.52E-05 7.52E-05 0.00%
POCP 3.65E-05 3.38E-05 -7.40%
Table 15. Comparative analysis of impact assessment in electricity coal supply chain (Unit: man·a)
Under the assumption that the utilization ratio of CH4 is 30% in the coal mining process, Table
15 gives the global environmental burden, regional environmental burden and total environmental burden of waste gas emissions in the electricity coal supply chain change as 2.91%, 1.9% and 2.3%, respectively. So the environmental burden caused by waste gases emissions is not sensitive to the change of CH4 in the coal mining process and utilization of CH4
4.2. Coal transportation process - transportation distance sensitivity analysis
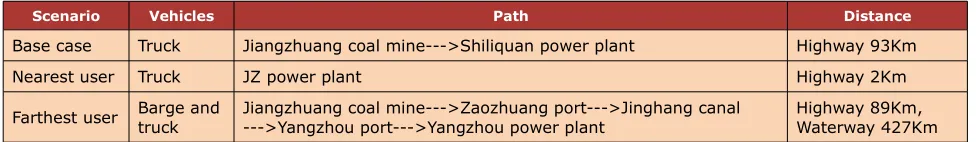
This section analyzes sensitivity of transportation distance and studies the environmental impact of transportation distance on waste gas emissions in the electricity coal supply chain. According to the investigation of JZCM, the fastest user is Yangzhou power plant, and the nearest user is JZ plant, mine mouth power plant. Detailed data are shown in Table 16.
Scenario Vehicles Path Distance
Base case Truck Jiangzhuang coal mine--->Shiliquan power plant Highway 93Km
Nearest user Truck JZ power plant Highway 2Km
Farthest user Barge and truck Jiangzhuang coal mine--->Zaozhuang port--->Jinghang canal--->Yangzhou port--->Yangzhou power plant Highway 89Km, Waterway 427Km
Table 16. Comparison of three scenarios
Table 17 gives the change of input index (standard coal, diesel, electricity consumption and non-coal energy) and Table 18 presents the change of output index (GWP, EP, POCP, AP and ODP), in order to assess the environmental impact of three different of transportation distances. And it shows that change of transportation distance has a great influence on diesel and non-coal energy.
Input index Quality Unit C A D
Standard coal Mass g -0.01% 438.171 0.03%
Diesel Mass g -48.96% 12.1 243.31%
Electricity consumption Energy (gross calorific value) MJ -2.41% 0.0325 7.01%
Non-coal energy Energy (gross calorific value) MJ -33.62% 0.7239 112.97%
Table 17. Impact of electricity coal supply chain on transportation distance (Input index)
Classification Final weighted scores Category Environmental burden
A C Changing rate A C Changing rate A C Changing rate
Global GWP 1.03E-04 1.01E-04 -1.85% 1.03E-04 1.01E-04 -1.83%
2.61
E-04 2.51E-04 -3.70% ODP 1.58E-08 1.58E-08 0.00%
Regional
AP 4.63E-05 4.54E-05 -2.02%
1.58
E-04 1.50E-04 -4.92% EP 7.52E-05 7.52E-05 -0.01%
POCP 3.65E-05 2.97E-05 -18.71%
Classification Final weighted scores Category Environmental burden
A D Changing rate A D Changing rate A D Changing rate
Global GWP 1.03E-04 1.09E-04 6.31% 1.03E-04 1.10E-04 6.33%
2.61
E-04 2.84E-04 8.89% ODP 1.58E-08 1.58E-08 0.00%
Regional
AP 4.63E-05 4.88E-05 5.41%
1.58
E-04 1.75E-04 10.55% EP 7.52E-05 7.52E-05 0.03%
POCP 3.65E-05 5.06E-05 38.76%
Table 18. Impact of electricity coal supply chain on transportation distance (Output index)
4.3. Coal burning process - coal-burning efficiency sensitivity analysis
Both a decrease and an increase in the coal-burning efficiency were examined. The base case efficiency for the average is 37%. The coal-burning efficiency is changed by plus or minus five percentage points for each system, i.e., 32% and 42% for the Average system. Changing the coal-burning efficiency had a large effect on the energy efficiency and energy ratios defined in Table 19.
Input index Quality Unit E A F
Standard coal Mass g -12.91% 438.171 17.43%
Diesel Mass g -12.91% 12.1 17.43%
Electricity consumption Energy (gross calorific value) MJ -12.91% 0.0325 17.43%
Non-coal energy Energy (gross calorific value) MJ -12.91% 0.7239 17.43%
Table 19. Impact of electricity coal supply chain on coal boiler efficiency (Input index)
Classification
Final weighted scores Category Environmental burden
Base case E Changingrate Basecase E Changingrate Basecase E Changingrate
Global GWP 1.03E-04 8.97E-05 -12.91% 1.03E-04 E-058.97 -12.90%
2.61
E-04 E-042.27 -12.90% ODP 1.58E-08 1.38E-08 -12.91%
Regional
AP 4.63E-05 4.03E-05 -12.91%
1.58
E-04 E-041.38 -12.91% EP 7.52E-05 6.55E-05 -12.91%
POCP 3.65E-05 3.18E-05 -12.91%
Classification
Final weighted scores Category Environmental burden
Base case F Changingrate Basecase F Changingrate Basecase F Changingrate
Global GWP 1.03E-04 1.21E-04 17.43% 1.03E-04 E-041.21 17.45%
2.61
E-04 E-043.07 17.44% ODP 1.58E-08 1.86E-08 17.43%
Regional
AP 4.63E-05 5.44E-05 17.43%
1.58
E-04 E-041.86 17.43% EP 7.52E-05 8.83E-05 17.43%
POCP 3.65E-05 4.29E-05 17.43%
Table 20. Impact of electricity coal supply chain on coal boiler efficiency (Output index)
5. Conclusion
LCA results help to pinpoint several tangible strategies to decrease the environmental impact in the coal life cycle, from coal mine to coal-fired power plant. The results show that the environmental burden of the coal burning process is greatest, followed by the coal mining process, and finally the coal transportation process. In the electricity coal supply chain, the biggest environmental impact of waste gas emissions is GWP, followed by EP, AP, POCP and ODP, and the regional impact is greater than the global impact. Improving the coal-burning efficiency of a coal-fired power plant is the most effective way to reduce the environmental burden of waste gas emissions in the electricity coal supply chain.
While there are certain limitations in the LCA supply chain case study in its current ‘‘cradle-to-gate’’ approach, in future research a full LCA study will incorporate a ‘‘cradle-to-grave’’ scheme including recycling, re-use and/or various disposal methods. And a cost factor will be integrated with LCA methods.
Acknowledgement
The authors are grateful to the anonymous referees for a careful checking and helpful comments that improved this paper.
References
Bates, J. (1995). Full life cycle atmospheric emissions and global warming impacts from UK electricity generation. London.
Björk, A., Erlandsson, M., Häkli, J., Jaakkola, K., Nilsson, Å., Nummila, K., et al. (2011). Monitoring environmental performance of the forestry supply chain using RFID. Computers in Industry, 62(8), 830-841. http://dx.doi.org/10.1016/j.compind.2011.08.001
Clean Production Standard in Coal Washing and Processing Industry. (2010). HJ 446-2008.
China Department of the environment.
CSY. (2013). China Statisitcal Yearbook 2012. Beijing.
Dreyer, L.C., Niemann, A.L., & Hauschild, M.Z. (2003). Comparison of three different LCIA methods: EDIP97, CML2001 and Eco-indicator 99. The international journal of life cycle assessment, 8(4), 191-200. http://dx.doi.org/10.1007/BF02978471
Frischknecht, R., Steiner, R., & Jungbluth, N. (2009). The Ecological Scarcity
Method-Eco-Factors 2006-A method for impact assessment in LCA (Methode der ökologischen
Knappheit–Ökofaktoren 2006-Methode für die Wirkungsabschätzung in Ökobilanzen).
Goedkoop, M., Demmers, M., & Collignon, M. (1995). The eco-indicator 95. PRé Consultants Amersfoort (NL).
Goedkoop, M., & Spriensma, R. (2001). The eco-indicator99: A damage oriented method for life cycle impact assessment: Methodology report.
Hondo, H. (2005). Life cycle GHG emission analysis of power generation systems: Japanese case. Energy, 30(11), 2042-2056. http://dx.doi.org/10.1016/j.energy.2004.07.020
International Energy Agency, IEA (2010). Electricity Information 2010. In OECO (Ed.). Paris.
Jolliet, O., Margni, M., Charles, R., Humbert, S., Payet, J., Rebitzer, G., et al. (2003). IMPACT 2002+: A new life cycle impact assessment methodology. The international journal of life cycle assessment, 8(6), 324-330. http://dx.doi.org/10.1007/BF02978505
Korre, A., Nie, Z., & Durucan, S. (2012). Life Cycle Assessment of the natural gas supply chain and power generation options with CO 2 capture and storage: Assessment of Qatar natural gas production, LNG transport and power generation in the UK. Sustainable Technologies, Systems & Policies(CCS Workshop), 11.
Lave, L.B., & Freeburg, L.C. (1973). Health effects of electricity generation from coal, oil, and nuclear fuel. Nuclear safety, 14(5), 409-428.
Li, R., & Leung, G.C.K. (2012). Coal consumption and economic growth in China. Energy policy, 40(0), 438-443. http://dx.doi.org/10.1016/j.enpol.2011.10.034
Liang, X., Wang, Z., Zhou, Z., Huang, Z., Zhou, J., & Cen, K. (2012). Up-to-date life cycle assessment and comparison study of clean coal power generation technologies in China.
Journal of cleaner production, 39(0), 24-31. http://dx.doi.org/10.1016/j.jclepro.2012.08.003
Liu, Z., & Zhao, Q. (2011). Research on the Scale-Planning Model for the Coal Logistics Center Based on Coal Logistics Network Planning. Journal of System and Management Sciences, 1(1), 59-69.
Lu, Z., Streets, D., Zhang, Q., Wang, S., Carmichael, G., Cheng, Y., et al. (2010). Sulfur dioxide emissions in China and sulfur trends in East Asia since 2000. Atmospheric Chemistry and Physics, 10(13), 6311-6331. http://dx.doi.org/10.5194/acp-10-6311-2010
Mann, M., & Spath, P. (2001). A life cycle assessment of biomass cofiring in a coal-fired power plant. Clean Products and Processes, 3(2), 81-91. http://dx.doi.org/10.1007/s100980100109
Miao, Y.X. (2009). Exploration and Analysis of 5,000,000 t/a coal washing technology. Hebei
Chemical Engineering and Industry, 32(6), 45-47(In Chinese).
Pacca, S., & Horvath, A. (2002). Greenhouse gas emissions from building and operating electric power plants in the Upper Colorado River Basin. Environmental Science & Technology, 36(14), 3194-3200. http://dx.doi.org/10.1021/es0155884
Pan, B., & Mu, D. (2011). Research on CDM projects in electricity coal supply chain. Paper presented at the International Conference on Information, Services and Management Engineering (ISME2011).
PE Intentional. (2011). www.gabi-software.com/america/index/.
Qiu, Z. (2013). On the analysis of building a public information platform based on e-Commerce for coal logistics. Journal of Industrial Engineering and Management, 6(4), 986-995.
Restrepo, Á., Miyake, R., Kleveston, F., & Bazzo, E. (2012). Exergetic and environmental analysis of a pulverized coal power plant. Energy, 45(1), 195-202.
http://dx.doi.org/10.1016/j.energy.2012.01.080
Uchiyama, Y. (1996). Life cycle analysis of electricity generation and supply systems. A paper in the technical document: IAEA-SM-338/33, 279-291.
Wenzel, H., Hauschild, M., Alting, L., & editors. (1997). Environmental assessment of products.
Vol. 1. London, UK: Chapman & Hall.
Yan, L.H. (2006). Japanese post-war energy security strategy and implications for China. Beijing, University of International Business and Economics (In Chinese).
Yang, J.X., Cheng, X., & Wang, R.S. (2002). Methodology and application of life cycle assessment. Beijing: China Meteorological Press (In Chinese).
You, F., Tao, L., Graziano, D.J., & Snyder, S.W. (2012). Optimal design of sustainable cellulosic biofuel supply chains: Multiobjective optimization coupled with life cycle assessment and input–output analysis. AIChE Journal, 58(4), 1157-1180. http://dx.doi.org/10.1002/aic.12637
Zhao, Y., Wang, S., Nielsen, C. P., Li, X., & Hao, J. (2010). Establishment of a database of emission factors for atmospheric pollutants from Chinese coal-fired power plants.
Atmospheric Environment, 44(12), 1515-1523. http://dx.doi.org/10.1016/j.atmosenv.2010.01.017
Appendix A
Waste gases emissions in electricity coal supply chain (g/KWh)
Emission to air Coal supplychain Undergroundmining Transport Powerplant
H ea vy m et al s to a ir
Antimony 3.21E-05 2.28E-05 0.00E+00 9.22E-06
Arsenic (+V) 6.82E-05 1.77E-05 0.00E+00 5.06E-05
Arsenic trioxide 2.22E-12 9.25E-13 0.00E+00 1.29E-12
Cadmium (+II) 8.34E-06 3.46E-06 0.00E+00 4.88E-06
Chromium (+III) 1.11E-08 8.31E-10 0.00E+00 1.03E-08
Chromium (unspecified) 2.34E-05 1.05E-05 0.00E+00 1.30E-05
Cobalt 1.78E-05 1.30E-05 0.00E+00 4.81E-06
Copper (+II) 1.41E-05 5.30E-06 0.00E+00 8.79E-06
Heavy metals to air (unspecified) 2.18E-09 6.04E-12 0.00E+00 2.17E-09
Hydrogen arsenic (arsine) 1.84E-10 7.68E-11 0.00E+00 1.07E-10
Iron 1.95E-06 7.21E-07 0.00E+00 1.23E-06
Lanthanides 4.91E-10 2.54E-10 0.00E+00 2.38E-10
Lead (+II) 1.39E-04 4.69E-05 0.00E+00 9.23E-05
Manganese (+II) 7.08E-05 1.40E-05 0.00E+00 5.68E-05
Mercury (+II) 2.04E-05 1.13E-06 0.00E+00 1.92E-05
Molybdenum 7.79E-08 4.05E-08 0.00E+00 3.74E-08
Nickel (+II) 3.90E-05 2.73E-05 0.00E+00 1.17E-05
Palladium 3.73E-16 8.58E-17 0.00E+00 2.87E-16
Rhodium 3.60E-16 8.28E-17 0.00E+00 2.77E-16
Selenium 2.16E-04 6.02E-05 0.00E+00 1.56E-04
Silver 1.25E-15 1.01E-15 0.00E+00 2.39E-16
Tellurium 1.48E-09 1.11E-10 0.00E+00 1.37E-09
Thallium 1.08E-08 7.45E-10 0.00E+00 1.01E-08
Tin (+IV) 6.26E-05 2.44E-06 0.00E+00 6.02E-05
Titanium 3.84E-08 1.27E-08 0.00E+00 2.56E-08
Vanadium (+III) 1.10E-04 9.23E-05 0.00E+00 1.79E-05
Zinc (+II) 3.25E-04 1.15E-04 0.00E+00 2.09E-04
In or g an ic e m is si on s to a
ir Ammonia 6.56E-03 2.50E-04 0.00E+00 6.31E-03
Ammonium 1.34E-10 4.99E-13 0.00E+00 1.33E-10
Ammonium nitrate 7.75E-11 1.05E-11 0.00E+00 6.69E-11
Barium 1.82E-04 7.66E-05 0.00E+00 1.06E-04
Beryllium 1.41E-06 7.00E-07 0.00E+00 7.13E-07
Boron compounds (unspecified) 1.80E-03 1.85E-04 0.00E+00 1.62E-03
Bromine 1.00E-03 2.21E-04 0.00E+00 7.81E-04
Carbon dioxide 9.73E+02 5.03E+01 1.20E+01 9.10E+02
Carbon dioxide (biotic) 1.47E+00 7.50E-01 0.00E+00 7.20E-01
Carbon disulphide 1.81E-08 1.19E-09 0.00E+00 1.69E-08
Carbon monoxide 2.98E-01 1.11E-01 1.90E-02 1.68E-01
Chloride (unspecified) 1.82E-05 9.86E-06 0.00E+00 8.38E-06
Chlorine 3.82E-09 1.72E-10 0.00E+00 3.65E-09
Cyanide (unspecified) 3.80E-07 2.00E-07 0.00E+00 1.81E-07
Fluoride 1.10E-05 5.20E-06 0.00E+00 5.78E-06
Fluorine 4.24E-10 1.19E-10 0.00E+00 3.05E-10
Helium 2.19E-06 1.26E-06 0.00E+00 9.26E-07
Hydrogen 4.77E-04 4.46E-06 0.00E+00 4.72E-04
Hydrogen bromine (hydrobromic acid) 2.66E-08 1.96E-10 0.00E+00 2.64E-08
Hydrogen chloride 1.43E-02 6.31E-03 0.00E+00 7.97E-03
Hydrogen cyanide (prussic acid) 3.38E-08 2.25E-09 0.00E+00 3.15E-08
Hydrogen fluoride 3.45E-03 1.75E-03 0.00E+00 1.70E-03
Hydrogen iodide 2.91E-11 1.14E-13 0.00E+00 2.90E-11
Hydrogen phosphorous 1.20E-11 9.32E-12 0.00E+00 2.65E-12
Hydrogen sulphide 8.93E-05 2.45E-05 0.00E+00 6.48E-05
Lead dioxide 1.31E-11 1.06E-11 0.00E+00 2.50E-12
Nitrogen (atmospheric nitrogen) 9.99E-02 2.38E-02 0.00E+00 7.62E-02
Nitrogen dioxide 5.06E-14 0.00E+00 0.00E+00 5.06E-14
Nitrogen monoxide 1.80E-09 1.26E-10 0.00E+00 1.67E-09
Nitrogen oxides 1.43E+00 4.01E-01 7.98E-02 9.54E-01
Nitrous oxide (laughing gas) 4.04E-02 7.47E-04 2.99E-04 3.93E-02
Oxygen 9.78E-02 6.03E-02 0.00E+00 3.75E-02
Scandium 1.97E-10 1.27E-10 0.00E+00 7.00E-11
Steam 1.67E-03 4.70E-04 0.00E+00 1.62E-03
Strontium 8.78E-09 5.06E-09 0.00E+00 3.72E-09
Emission to air Coal supplychain Undergroundmining Transport Powerplant
Sulphur hexafluoride 8.92E-10 7.21E-10 0.00E+00 1.71E-10
Sulphuric acid 5.78E-08 7.34E-09 0.00E+00 5.05E-08
Tin oxide 1.14E-12 9.20E-13 0.00E+00 2.17E-13
Zinc oxide 2.27E-12 1.84E-12 0.00E+00 4.34E-13
Zinc sulphate 3.88E-09 1.62E-09 0.00E+00 2.26E-09
O rg a n ic e m is si on s to a ir ( g ro u p V O C )
Anthracene 2.67E-10 1.12E-10 0.00E+00 1.55E-10
Benzo{a}anthracene 1.34E-10 5.64E-11 0.00E+00 7.80E-11
Benzo{a}pyrene 6.37E-08 5.23E-09 0.00E+00 5.84E-08
Benzo{ghi}perylene 1.20E-10 5.03E-11 0.00E+00 6.95E-11
Benzofluoranthene 2.40E-10 1.01E-10 0.00E+00 1.39E-10
Chrysene 3.30E-10 1.39E-10 0.00E+00 1.91E-10
Dibenz(a)anthracene 7.47E-11 3.14E-11 0.00E+00 4.33E-11
Indenopyrene 8.92E-11 3.74E-11 0.00E+00 5.18E-11
Naphthalene 2.80E-08 1.18E-08 0.00E+00 1.63E-08
Phenanthrene 8.81E-09 3.70E-09 0.00E+00 5.11E-09
Polycyclic aromatic hydrocarbons (PAH) 1.27E-05 1.58E-06 0.00E+00 1.11E-05 Dichloromethane (methylene chloride) 5.21E-15 1.20E-15 0.00E+00 4.01E-15 Halogenated hydrocarbons (unspecified) 2.86E-15 8.30E-16 0.00E+00 2.03E-15 Polychlorinated biphenyls (PCB unspecified) 3.96E-10 1.40E-10 0.00E+00 2.56E-10 Polychlorinated dibenzo-p-dioxins (2,3,7,8 - TCDD) 5.20E-11 1.91E-12 0.00E+00 5.01E-11
R 11 (trichlorofluoromethane) 5.71E-07 8.27E-08 0.00E+00 4.88E-07
R 114 (dichlorotetrafluoroethane) 5.84E-07 8.47E-08 0.00E+00 5.00E-07
R 12 (dichlorodifluoromethane) 1.23E-07 1.78E-08 0.00E+00 1.05E-07
R 13 (chlorotrifluoromethane) 7.70E-08 1.12E-08 0.00E+00 6.59E-08
R 22 (chlorodifluoromethane) 1.34E-07 1.94E-08 0.00E+00 1.15E-07
Tetrafluoromethane 3.69E-09 1.17E-09 0.00E+00 2.52E-09
Vinyl chloride (VCM; chloroethene) 6.69E-08 3.09E-08 0.00E+00 3.60E-08
Acetaldehyde (Ethanal) 4.41E-06 3.05E-06 0.00E+00 1.36E-06
Acetic acid 1.71E-05 1.11E-05 0.00E+00 6.04E-06
Acetone (dimethylcetone) 4.30E-06 3.01E-06 0.00E+00 1.29E-06
Acrolein 1.88E-09 7.91E-10 0.00E+00 1.09E-09
Aldehyde (unspecified) 3.93E-07 2.11E-07 0.00E+00 1.82E-07
Alkane (unspecified) 3.73E-03 3.56E-04 0.00E+00 3.37E-03
Alkene (unspecified) 3.72E-03 3.46E-04 0.00E+00 3.37E-03
Aromatic hydrocarbons (unspecified) 1.44E-06 1.07E-06 0.00E+00 3.70E-07
Benzene 2.47E-05 7.81E-06 0.00E+00 1.69E-05
Butadiene 1.32E-10 3.66E-13 0.00E+00 1.32E-10
Butane 7.37E-04 3.64E-04 0.00E+00 3.74E-04
Butane (n-butane) 3.58E-04 3.37E-05 0.00E+00 3.24E-04
Cyclohexane (hexahydro benzene) 4.15E-07 2.73E-08 0.00E+00 3.88E-07
Diethylamine 3.35E-15 1.25E-17 0.00E+00 3.33E-15
Ethane 2.73E-03 1.04E-03 0.00E+00 1.70E-03
Ethanol 7.62E-06 5.43E-06 0.00E+00 2.18E-06
Ethene (ethylene) 2.39E-07 1.11E-07 0.00E+00 1.29E-07
Ethyl benzene 3.72E-03 3.45E-04 0.00E+00 3.37E-03
Fluoranthene 8.70E-10 3.65E-10 0.00E+00 5.05E-10
Fluorene 2.76E-09 1.16E-09 0.00E+00 1.60E-09
Formaldehyde (methanal) 1.04E-03 1.04E-04 0.00E+00 9.38E-04
Heptane (isomers) 2.33E-05 1.26E-05 0.00E+00 1.07E-05
Hexamethylene diamine (HMDA) 7.76E-12 2.15E-14 0.00E+00 7.74E-12
Hexane (isomers) 3.53E-05 1.88E-05 0.00E+00 1.66E-05
Mercaptan (unspecified) 8.83E-07 4.09E-07 0.00E+00 4.74E-07
Methanol 7.23E-06 5.38E-06 0.00E+00 1.85E-06
NMVOC (unspecified) 5.59E-02 3.24E-02 0.00E+00 2.35E-02
Octane 1.28E-05 6.94E-06 0.00E+00 5.90E-06
Pentane (n-pentane) 2.65E-03 3.45E-04 0.00E+00 2.30E-03
Phenol (hydroxy benzene) 9.95E-11 5.67E-11 0.00E+00 4.27E-11
Propane 4.09E-03 1.81E-03 0.00E+00 2.27E-03
Propene (propylene) 3.38E-04 3.14E-05 0.00E+00 3.06E-04
Propionic acid (propane acid) 5.52E-10 2.67E-10 0.00E+00 2.84E-10
Styrene 4.59E-10 3.03E-11 0.00E+00 4.29E-10
Toluene (methyl benzene) 1.69E-03 1.57E-04 0.00E+00 1.53E-03
Trimethylbenzene 1.11E-11 8.96E-12 0.00E+00 2.12E-12
Emission to air Coal supplychain Undergroundmining Transport Powerplant O th er em is si o n s to a ir
Exhaust 3.80E-03 1.27E-03 0.00E+00 3.68E-03
non used primary energy from wind power 0.00E+00 0.00E+00 0.00E+00 0.00E+00 Unused primary energy from solar energy 0.00E+00 0.00E+00 0.00E+00 0.00E+00
Used air 2.68E+00 2.77E-01 0.00E+00 2.41E+00
Waste heat 0.00E+00 0.00E+00 0.00E+00 0.00E+00
Pa rt ic le s to a
ir Dust (PM10) 1.06E-02 5.90E-03 0.00E+00 4.72E-03
Dust (PM2,5 - PM10) 1.38E-03 0.00E+00 1.38E-03 0.00E+00
Dust (PM2.5) 8.51E-02 4.79E-02 0.00E+00 3.72E-02
Dust (unspecified) 1.49E-01 7.90E-02 0.00E+00 7.04E-02
Metals (unspecified) 3.81E-10 2.99E-10 0.00E+00 8.20E-11
Wood (dust) 4.20E-10 3.40E-10 0.00E+00 8.02E-11
R ad io ac ti ve e m is si o n s to a ir
Antimony (Sb124) 0.00E+00 0.00E+00 0.00E+00 0.00E+00
Argon (Ar41) 0.00E+00 0.00E+00 0.00E+00 0.00E+00
Carbon (C14) 0.00E+00 0.00E+00 0.00E+00 0.00E+00
Cesium (Cs134) 0.00E+00 0.00E+00 0.00E+00 0.00E+00
Cesium (Cs137) 0.00E+00 0.00E+00 0.00E+00 0.00E+00
Cobalt (Co58) 0.00E+00 0.00E+00 0.00E+00 0.00E+00
Cobalt (Co60) 0.00E+00 0.00E+00 0.00E+00 0.00E+00
Hydrogen (H3) 0.00E+00 0.00E+00 0.00E+00 0.00E+00
Iodine (I129) 0.00E+00 0.00E+00 0.00E+00 0.00E+00
Iodine (I131) 0.00E+00 0.00E+00 0.00E+00 0.00E+00
Krypton (Kr85) 0.00E+00 0.00E+00 0.00E+00 0.00E+00
Krypton (Kr85m) 0.00E+00 0.00E+00 0.00E+00 0.00E+00
Plutonium (Pu alpha) 0.00E+00 0.00E+00 0.00E+00 0.00E+00
Radon (Rn222) 0.00E+00 0.00E+00 0.00E+00 0.00E+00
Uranium (total) 7.25E-07 1.02E-07 0.00E+00 6.23E-07
Uranium (U234) 0.00E+00 0.00E+00 0.00E+00 0.00E+00
Uranium (U235) 0.00E+00 0.00E+00 0.00E+00 0.00E+00
Uranium (U238) 0.00E+00 0.00E+00 0.00E+00 0.00E+00
Xenon (Xe131m) 0.00E+00 0.00E+00 0.00E+00 0.00E+00
Xenon (Xe133) 0.00E+00 0.00E+00 0.00E+00 0.00E+00
Xenon (Xe133m) 0.00E+00 0.00E+00 0.00E+00 0.00E+00
Xenon (Xe135) 0.00E+00 0.00E+00 0.00E+00 0.00E+00
Xenon (Xe135m) 0.00E+00 0.00E+00 0.00E+00 0.00E+00
Xenon (Xe137) 0.00E+00 0.00E+00 0.00E+00 0.00E+00
Xenon (Xe138) 0.00E+00 0.00E+00 0.00E+00 0.00E+00
Journal of Industrial Engineering and Management, 2014 (www.jiem.org)
Article's contents are provided on a Attribution-Non Commercial 3.0 Creative commons license. Readers are allowed to copy, distribute and communicate article's contents, provided the author's and Journal of Industrial Engineering and Management's names are included.