VOLUME 38, ARTICLE 25, PAGES 651
,
690
PUBLISHED 22 FEBRUARY 2018
http://www.demographic-research.org/Volumes/Vol38/25/ DOI: 10.4054/DemRes.2018.38.25
Research Article
Cohort fertility decline in low fertility countries:
Decomposition using parity progression ratios
Kryštof Zeman
Éva Beaujouan
Zuzanna Brzozowska
Tomáš Sobotka
© 2018 Zeman, Beaujouan, Brzozowska & Sobotka.
This open-access work is published under the terms of the Creative Commons Attribution 3.0 Germany (CC BY 3.0 DE), which permits use, reproduction, and distribution in any medium, provided the original author(s) and source are given credit.
1 Introduction 652
2 Background: Post-baby boom fertility decline(s) 654
2.1 Regional diversity in cohort fertility trajectories 654 2.2 Social, economic, and cultural factor trends affecting cohort
fertility in the post-war era
656 2.3 Regional contexts of post-war cohort fertility trends: Which parity
was driving the trend to low fertility?
658 2.4 Shift to very low completed cohort fertility levels 660
2.5 Research questions 662
3 Data and methods 663
4 Results 669
4.1 Changes in parity progression ratios and regional patterns of
fertility decline 669
4.2 Decomposition of fertility decline using parity progression ratios 671
4.3 Fertility decline below 1.75 children per woman 673
5 Discussion: The regional context of cohort fertility declines 677
6 Acknowledgements 681
Cohort fertility decline in low fertility countries:
Decomposition using parity progression ratios
Kryštof Zeman1 Éva Beaujouan2 Zuzanna Brzozowska2, 3
Tomáš Sobotka2
Abstract
BACKGROUND
The long-term decline in cohort fertility in highly developed countries has been widely documented. However, no systematic analysis has investigated which parity contributed most to the fertility decline to low and very low levels.
OBJECTIVE
We examine how the contribution of changing parity progression ratios varied across cohorts, countries, and broader regions in Europe, North America, Australia, and East Asia. We pay special attention to countries that reached very low completed cohort fertility, below 1.75 children per woman.
METHODS
Using population censuses and large-scale surveys for 32 low fertility countries, we decompose the change in completed cohort fertility among women born between 1940 and 1970. The decomposition method takes into account the sequential nature of childbearing as a chain of transitions from lower to higher parities.
RESULTS
Among women born between 1940 and 1955, the fertility decline was mostly driven by reductions in the progression ratios to third and higher-order births. By contrast, among women born between 1955 and 1970, changes in fertility showed distinct regional patterns: in Central and Eastern Europe they were fuelled by falling second-birth rates, whereas in the German-speaking countries, Southern Europe, and East Asia decreases in first-birth rates played the major role.
1 Wittgenstein Centre for Demography and Global Human Capital (IIASA, VID/ÖAW, WU), Vienna Institute
of Demography/Austrian Academy of Sciences, Austria. E-Mail:[email protected].
2 Wittgenstein Centre for Demography and Global Human Capital (IIASA, VID/ÖAW, WU), Vienna Institute
of Demography/Austrian Academy of Sciences, Austria.
CONCLUSIONS
Pathways to low and very low fertility show distinct geographical patterns, which reflect the diversity of the cultural, socioeconomic, and institutional settings of low fertility countries.
CONTRIBUTION
Our study highlights the importance of analysing parity-specific components of fertility in order to understand fertility change and variation. We demonstrate that similar low levels of completed cohort fertility can result from different combinations of parity-specific fertility rates.
1. Introduction
The long-term decline in cohort fertility rates across developed countries has been widely documented (Frejka and Calot 2001; Frejka 2008; Myrskylä, Goldstein, and Cheng 2013). Among women born around 1940, who were in prime reproductive years towards the end of the post-war baby boom, the completed cohort fertility rate was between 1.9 and 2.5 children per woman in most European countries and in Japan, between 2.5 and 2.7 children per woman in Australia, New Zealand, and the United States, and even higher in South Korea and Singapore. By contrast, women born three decades later, around 1970, had on average fewer than two children in all the highly developed countries except Australia, France, New Zealand, Norway, the United States, and a few smaller European countries (Council of Europe 2005; Frejka, Jones, and Sardon 2010; Sobotka et al. 2015; Van Bavel et al. 2015; Human Fertility Database 2016). This fall in fertility was accompanied by a continuous decline in the share of large families (with three and more children), and, especially among women born in the 1960s, by increasing proportions of women without children or with one child (e.g., Schoen 2006; Frejka and Sardon 2007; Frejka 2008; Frejka, Jones, and Sardon 2010; Sobotka 2017; Beaujouan, Brzozowska, and Zeman 2016; Human Fertility Database 2016; Van Bavel et al. 2015).
expectation is in line with Frejka’s (2008) analysis, which finds that decreasing progressions to first and second births played a key role in fertility declines among European women born after 1955. Billari and Kohler (2004: 171) suggest that a pattern of ‘lowest-low’ fertility in Europe is characterised by “a low probability of progression after the first child (but not particularly low levels of first-birth childbearing)”. However, many factors, including family policies, economic uncertainty, family size norms and preferences, and population heterogeneity, may have affected the importance of specific parities in the cohort fertility decline to low levels. As a result, low fertility countries vary considerably in their parity composition (Frejka and Sardon 2007).
In this study we analyse the role of changing first,4 second, and third and
higher-order birth rates in cohort fertility decline in 32 low fertility countries in Europe, North America, Australia, and East Asia including Singapore.5 Specifically, for each country
we decompose the change in completed cohort fertility among women born between 1940 and 19706 using parity progression ratios (PPR). The data is derived mostly from
censuses, registers, and large-scale surveys containing a question on the number of children ever born. We focus on women aged 43 or older at the time the data was collected, who had by then (almost) completed their childbearing. By adopting a cohort perspective we analyse the achieved level (quantum) of fertility and do not have to address timing distortions that have strongly affected period fertility indicators in the highly developed countries in the last four decades (Billari and Kohler 2004; Bongaarts and Sobotka 2012).
We also analyse how the contribution of the changing parity progression ratios to completed cohort fertility varied across cohorts and countries, and whether it was different in countries with very low completed cohort fertility below 1.75 children per woman.
Our study is structured as follows. First, we review the existing evidence on cohort fertility trends in the highly developed countries (Section 2). This part also outlines our main expectations about the geographical variation of parity-specific drivers of cohort fertility decline. In Section 3 we outline the data and methods used. Section 4 examines
4 Parity progression ratio to first birth and childlessness are complementary, therefore we use the terms
‘declining parity progression ratio to first birth’ and ‘increasing childlessness’ interchangeably. Next to ‘parity progression ratios’ we also use the term ‘parity-specific transition rates’.
5 Unlike the other Asian countries and territories with a longer history of low fertility (Japan, Hong Kong,
South Korea, Taiwan), which are in East Asia, Singapore belongs to South-East Asia. For simplicity, we label this culturally similar set of rich countries ‘East Asia’, following the example of Frejka, Jones, and Sardon (2010).
6 The latest cohort covered in this study differs by country, depending on data availability. It ranges from the
parity-specific components of fertility decline among women born in 1940–1970. It first inspects all the 32 countries analysed, grouped into broader regions, and then focuses on the subset of countries that reached low completed cohort fertility, below 1.75 children per woman. Finally, in Section 5 we discuss the main findings.
2. Background: Post-baby boom fertility decline(s)
2.1 Regional diversity in cohort fertility trajectories
Among women born between 1940 and 1970, completed cohort fertility in the developed countries followed diverse trajectories as it moved towards or below two children per woman. Most typically, it declined continuously (e.g., in Italy, Spain, Slovakia, and South Korea), but it also showed a U-shaped trend (especially in the United States and Denmark) or an inverted U-shaped trajectory (e.g., in Hungary), with the timing of these changes varying across countries (Frejka and Calot 2001; Sardon 2006a, 2006b; Frejka, Jones, and Sardon 2010; Myrskylä, Goldstein, and Cheng 2013). In the early 1970s cohorts, fertility ranged from 1.4–1.5 children per woman in Spain, Italy, Ukraine, and Germany to slightly above 2.0 in France, the United States, and Sweden (Sobotka et al. 2015).
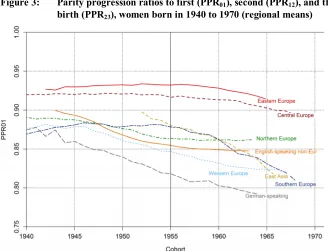
Figure 1 illustrates this diversity for women born between 1940 and 1970 in low fertility countries, grouped into eight broader regions. The grouping adopted throughout the study is based on similarities in fertility trends (as seen in Figure 1), and corresponds to the country classification commonly used in population research (e.g., Council of Europe 2005; Frejka and Sardon 2007; Myrskylä, Goldstein, and Cheng 2013). The main characteristics of these country groups in terms of their policies and broad economic and cultural trends after World War Two are outlined in Section 2.2; the full list of countries and regions is detailed in the Supplement tables.
countries studied here, Slovakia was a major exception from the broader regional pattern, with an initial fertility level above 2.5 children per woman.
Figure 1: Completed cohort fertility in the analysed low fertility countries, grouped by broader regions, women born in 1940–1970
The English-speaking countries outside Europe retained higher fertility than most of the other analysed countries. The United States saw a swift reduction in fertility in the 1940s cohorts, followed by a stabilisation and a gradual increase among women born between 1955 and 1970, whereas Australia and New Zealand experienced continuous but less pronounced fertility declines. In East Asia, Japan stands out for having already reached low fertility of around two children per woman among women born in the 1930s (Frejka, Jones, and Sardon 2010; not available in our data). Relatively stable cohort fertility among Japanese women born between 1940 and 1955 was followed by a renewed fertility decline in the younger birth cohorts, with women born in 1970 reaching one of the lowest completed cohort fertility levels globally, 1.46. Singapore experienced a fast transformation from large family size (above 3 children per woman born in 1940) to very low fertility, reaching similar values as Japan among women born in the 1960s. South Korea, starting at a high level of 3.9 children per woman among those born in 1940, appears to have followed a similar trajectory of fertility decline as Singapore, with a ‘lag’ of about ten cohorts.
2.2 Social, economic, and cultural factor trends affecting cohort fertility in the post-war era
In the highly developed countries the post-war decades saw a variety of cultural, economic, and social developments. In the West of Europe and in the English-speaking non-European countries the generation of women born between 1940 and the mid-1950s grew up in times of unprecedented economic prosperity. They saw a sharp rise in their labour force participation (although often on a part-time basis), experienced new sexual freedom provided by highly effective hormonal contraception, and initiated the sociocultural changes described as the second demographic transition (Van de Kaa 1987; Lesthaeghe 2010). In the East of Europe the vast majority of women worked full time. In most of the state-socialist countries, women had only limited access to the contraceptive pill and relied heavily on abortion (Stloukal 1999). With the exception of rapidly rising divorce rates in some countries, the new family behaviours and values spreading in the West remained marginal in Central and Eastern Europe (Sobotka 2011).
highly developed Japan) when women born around 1950 were reaching adulthood and forming their families.
Women born between the mid-1950s and 1970 saw, in their youth, the first post-war economic recessions (especially the energy crisis in the 1970s), rising unemployment, and vanishing lifetime jobs (Blossfeld et al. 2005). In the Eastern Bloc they experienced the collapse of state socialism and across Europe the shrinking of the welfare state. They also benefited from expanding educational opportunities, including a gradual rise in university education. In the Western world, people born between the mid-1950s and 1970 continued the sociocultural changes initiated by the older cohorts, which resulted in a widening acceptance of less conventional family forms and living arrangements, including voluntary childlessness (Sobotka and Testa 2008; Merz and Liefbroer 2012; Kreyenfeld and Konietzka 2017). These changes also involved increasing gender equality, especially in the domestic sphere (McDonald 2000). In East Asia, childbearing remained confined to marriage. The traditional expectations about women’s role in the family made it difficult for women to continue working after marriage, despite their increasing education and employment opportunities. This growing conflict between career opportunities and family life expectations resulted in a rising rate of nonmarriage (and childlessness), especially among highly educated women (Jones and Gubhaju 2009; Tsuya 2015; Yoo 2016).
and evidenced in Figure 1, in many countries and regions these two broad cohort groups witnessed distinct fertility developments, with many countries seeing a shift to sub-replacement fertility and a slow-down or a stabilisation in their cohort fertility decline among the cohorts born after 1955. We refer to ‘older’ vs. ‘younger’ cohorts to distinguish women born between 1940 and 1955 from those born between 1955 and 1970.
2.3 Regional contexts of post-war cohort fertility trends: Which parity was driving the trend to low fertility?
Although our study is the first to offer a systematic analysis of the parity-specific components of cohort fertility decline across the developed world, many studies have addressed the topic for specific countries, regions, and cohort groups. Here we summarise their findings and, based on this review, specify for each region and broad cohort which parity progression rate is expected to have been the main driver of the observed fertility decline among women born in 1940–1970 (Table 1). These expectations are later addressed in our empirical analysis (Section 4).
The regional differences in policies, economic development, and social trends correspond to a wide diversity in parity-specific fertility changes across the analysed regions. In Western and Northern Europe the fertility decrease in the older cohorts was largely connected to couples limiting their family size to two children and thus reducing their third and higher-order birth rates (Frejka and Sardon 2007). The broad fertility stabilisation in the 1950s and 1960s cohorts may not have been dominated by any specific parity. Relatively good living standards together with well-developed family policies, most comprehensive in Belgium, France, and the Nordic countries, slowed down the fall in fertility across all parities, especially in second and third-birth rates (Toulemon, Pailhé, and Rossier 2008; Andersson et al. 2009; Neels and De Wachter 2010).
In Southern Europe the rapid social and economic changes of the 1960s and 1970s together with the spread of highly effective contraception contributed to strong reductions in the transition rates to third and further births among the older cohorts. Subsequently, in the 1950s and 1960s cohorts, rising women’s employment in combination with precarious labour market conditions, limited work flexibility for women, and traditional gender roles within the family depressed second-birth rates (Adserà 2011) and fuelled further decline in third and higher-order birth rates to very low levels (Delgado, Meil, and Zamora López 2008; De Rose, Racioppi, and Zanatta 2008).
In Central Europe the almost universal full-time employment of women during state socialism resulted in very low third-birth rates. In addition, the negative attitudes towards childlessness (Sobotka and Testa 2008; Merz and Liefbroer 2012) explain why fertility decline was largely driven by falling second-birth rates, especially in cohorts bearing children during the state-socialist era (Sobotka 2011). The same factors should also operate in Eastern Europe. In addition, the lower living standards (especially among the late-1960s cohorts who were in their prime reproduction ages in the turbulent period of the 1990s) and relatively poor housing conditions in the region further depressed second-birth rates (Avdeev and Monnier 1995). Falling transitions to second birth were the most important ‘determinant’ of completed cohort fertility decline to very low levels (Frejka and Gietel-Basten 2016). For instance, in Russia four in ten women born in the late 1960s had only one child (Barkalov 1999; Andreev, Shkolnikov, and Begun 2002).
In view of their cultural proximity and a similar post-war economic development, the fertility trends in the English-speaking countries outside Europe resembled those in Northern and Western Europe. Sharp reductions in third and higher-order birth rates dominated the fertility decline among women born in the 1940s, i.e., among those who had children in the 1960s, right after the baby boom era (see Morgan 1996 for the United States).
parents provide for their education, including after-class tutoring (Anderson and Kohler 2012; Tan, Morgan, and Zagheni 2016).
Summing up these region-specific trends, we expect that among women born between 1940 and 1955 who were of prime childbearing age between 1960 and 1985, reductions in third and higher-parity progression rates (Table 1) dominated cohort fertility decline in all regions (except Western Germany). By contrast, among the younger cohorts born between 1955 and 1970 the picture differs by region. In the former state-socialist countries of Central and Eastern Europe the fall in second-birth rates likely had the strongest impact on overall fertility decline. In Western Europe, Southern Europe, the three German-speaking countries of Central Europe, and East Asia we expect the rise in childlessness to play the main role. In the English-speaking countries outside Europe we reckon that the continuing reductions in third and higher-order births contributed most to the continuing fertility decline (except in the United States, where the earlier decline reversed in the post-1950 cohorts). Finally, we do not formulate any expectations for the Nordic countries, where fertility decline has ended or slowed down sharply among women born after 1955.
Table 1: Expected dominant parity components of fertility decline among the older (women born between 1940 and 1955) and younger (women born between 1955 and 1970) cohorts analysed, by region
Region Cohorts 1940–1955 Cohorts 1955–1970
Eastern Europe PPR23+ PPR12
Central Europe PPR23+ PPR12
Western Europe PPR23+ PPR01
Northern Europe PPR23+ –
German-speaking PPR23+
(PPR01 in W. Germany)
PPR01
Southern Europe PPR23+ PPR01
English-speaking non-European PPR23+ PPR23+
East Asia PPR23+ PPR01
2.4 Shift to very low completed cohort fertility levels
usually defined as a TFR below 1.5 (e.g., McDonald 2006), whereas ‘lowest-low fertility’ or ‘ultra-low fertility’ is commonly defined as a TFR falling below 1.3 (Kohler, Billari, and Ortega 2002; Jones, Straughan, and Chan 2008). However, demographers have not yet adopted a common definition of very low cohort fertility. Because of the tempo distortions negatively affecting period fertility indicators, during the last four decades cohort fertility in the low fertility countries has typically stayed at a higher level than the conventional period fertility rates. Two recent contributions, by Myrskylä, Goldstein, and Cheng (2013) and Rindfuss, Choe, and Brauner-Otto (2016), adopt a completed cohort fertility level of 1.75 children per woman as a threshold below which cohort fertility becomes ‘very low’. We use the same threshold and label completed cohort fertility below 1.75 as very low.7 Among women born in 1950, cohort
fertility fell below 1.75 children per woman only in Germany (Pötzsch 2016). Later on, more than ten countries saw their cohort fertility dropping below 1.75, especially among women born in the early 1960s (Frejka, Jones, and Sardon 2010; Myrskylä, Goldstein, and Cheng 2013).
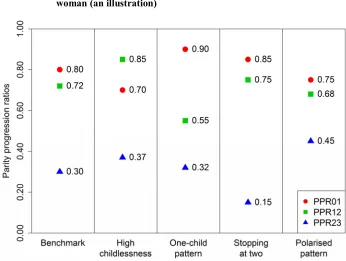
The configurations of parity-specific fertility can vary greatly, even when summing up to similar cohort fertility levels (e.g., to 1.6 children per woman, as in the example presented in Figure 2). The benchmark combination of generally low parity progression ratios across all parities can be contrasted with four other hypothetical combinations: one with high childlessness at 30% (and the corresponding low progression to first birth, with the PPR01 at 0.70); another with a strong one-child
pattern, marked by very low progression to second birth (PPR12 at 0.55); the next one
with a stopping-at-two pattern of very low progression rates to third and fourth births (PPR23 and PPR34 at 0.15); and, finally, a polarised pattern combining high
childlessness (25%) and a high likelihood of progressing to third or fourth birth (PPR23
and PPR34 at 0.45). While we do not expect any country to fit any of these stylised
combinations perfectly, we believe they will be useful for discussing parity-specific fertility trends in the countries with very low fertility.
7 We do not aim to suggest that a ‘very low’ completed cohort fertility of 1.6 or 1.7 is unsustainable or that it
Figure 2: Possible combinations of parity progression ratios (PPR) corresponding to a completed cohort fertility of 1.6 children per woman (an illustration)
Notes: For simplicity, these illustrations limit the family size to a maximum of four children, where PPR34 equals PPR23.
2.5 Research questions
To summarize, we address the following questions and hypotheses:
∂ Differences between cohorts. In the cohorts born between 1940 and 1955 we expect that the fertility decline was largely driven by the shrinking higher-order birth rates, manifested by falling progression ratios to third and later births. By contrast, among women born between 1955 and 1970 the decline in progression to first and second birth becomes an important driver of their fertility decline.
∂ Shift to very low cohort fertility levels. We pay particular attention to countries that experienced a fall in completed cohort fertility below 1.75 children per woman. Can we identify systematic differences between countries and regions in parity-specific pathways to very low completed cohort fertility?
3. Data and methods
We collected data for 32 countries with persistent low fertility. To summarise the key trends we present some of the results for the eight broader regions specified in Section 2.1 and Figure 1 (see also Supplement tables for further details). As we use data for women aged 43 and older with almost completed reproductive histories, our analysis spans birth cohorts from 1940 to 1965–1971. For a few countries we lack data for several older cohorts and start the analyses with cohorts born between 1941 and 1945. The averages computed for the regions may thus include a different number of countries for a few cohorts, depending on data availability. In the decomposition analysis we look at changes in two broad cohort intervals, women born between (around) 1940 and 1955 and women born between 1955 and (around) 1970. Japan was excluded from the analyses of fertility change among older cohorts because data was only available for women born after 1952. For details on the data sources see Supplement Table S-1.
Whenever possible we base our analysis on the most recent census data from the 2011 census round, which usually collected information on children ever born among all women living in a country. Such data is available for 17 countries and comes mostly from the Cohort Fertility and Education database (CFE 2017; Zeman et al. 2014). Other data sources include large-scale surveys (merged Enquête Famille et Logements surveys from 1982, 1990, 1999, and 2011 for France, and Famiglie e soggetti sociali 2003 and 2009 for Italy), microcensus data (2012 round for Germany8), and other
sources provided by the national statistical offices (ONS 2014 for England and Wales). We also utilise data from population registers (Denmark, Finland, Norway, the Netherlands, and Sweden) and the Human Fertility Database (HFD 2017),9 which
contains data from the censuses around 2001, supplemented by fertility rates for the subsequent period 2013–2014 (Austria, Slovenia, Switzerland, Ukraine). For Japan and the United States, where more recent census data does not provide information on
8 We show data for Western Germany, i.e., the former Federal Republic of Germany excluding Berlin. We do
not present data for Eastern Germany (including Berlin) as the sample size is too small and the resulting indicators of cohort fertility and parity distribution are not robust.
9 The HFD data was extracted from the respective files on female population exposure by parity in the input
women’s parity, cohort fertility is reconstructed from period age-specific fertility rates by birth order using the HFD methodology (Jasilioniene et al. 2015).
By using census and large-scale survey or register data we cover the number of children ever born to women living in each country at the time of the census or survey. Relying on this retrospective data provides more stable and often more reliable information on family size distribution than the cohort fertility data reconstructed from the long-term series of period indicators that dominated research on cohort fertility in the past (see the methods section in Council of Europe 2005 and Calot and Sardon 2004 for the information on the computation of cohort indicators provided by the European Demographic Observatory). Cohort measures reconstructed from period fertility rates are very sensitive to the quality of birth order reporting in vital statistics, and also to the reliability of past population estimates by age and sex. Furthermore, period data only contains records of births that took place within a country, the reproductive histories of immigrants before their arrival date being ignored. The cohort fertility histories created in this way are somewhat artificial and may not reflect the actual childlessness of residents in countries with high immigration or emigration. Different methods used for estimating completed cohort fertility can also explain some of the differences10 between
our indicators and those based on period series, published in Frejka and Calot 2001, Council of Europe 2005, Sardon 2006a, 2006b, Frejka and Sardon 2007, and Myrskylä, Goldstein, and Cheng 2013.
In the late-1960s birth cohorts, 13 out of 32 countries analysed here had fertility below 1.75 (see Figure 1). Except for Slovenia, they belong to four of the eight analysed regions: Eastern Europe (Belarus, Bulgaria, Russia, and Ukraine), Southern Europe (Greece, Italy, and Spain), ‘German-speaking countries’ (Austria, Germany, and Switzerland), and East Asia (Japan and Singapore). Two of these countries, Greece and Slovenia, only reached a completed cohort fertility level below 1.75 in the latest cohort observed in our data. Therefore, our analysis of cohort fertility decline to very low levels focuses on the remaining 11 countries.
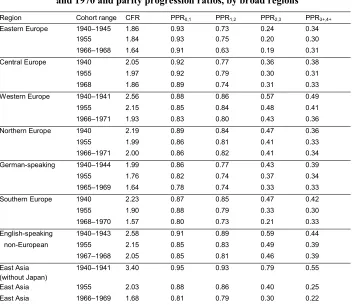
We measure the cohort fertility level with the completed cohort fertility rate (CFR), and decompose its change between the initial and final birth cohorts into the changes in the parity progression ratios (PPRi-1,i). The PPRi-1,i expresses the probability
of reaching parity i among women of parity i-1 (see Table 2 for average CFR and PPRs in the early-1940s, 1955, and the late-1960s birth cohorts in the analysed regions). For each birth cohort analysed, the CFR can be defined as the sum of parity-specific CFRi:
10 The discrepancy between the CFR levels published by Sardon (2006a, 2006b), Council of Europe (2005)
CFR = ∑ CFR (1)
where CFRi is the average number of children of birth order i born to women from a
given cohort. It relates the number of women who reached parity i or higher to the total number of women in that cohort.
The parity progression ratios to first birth and to higher birth orders are given as:
PPR , = CFR , (2)
PPR , = for i > 1. (3)
We combine data on fourth and further births together, computing an indicator of the progression rate from the third and order births to the fourth and higher-order births:
PPR , = (4)
It also holds that:
CFR = ∏ PPR , (5)
We decompose changes in the CFR into the contribution of changes in the transition to first birth (dPPR01), second birth (dPPR12), and third and higher-order
births (dPPR23+). The decomposition method we employ proceeds directly from
Barkalov (1999; formulae [3–6] on pp. 52–53) and takes into account the sequential nature of childbearing as a chain of transitions across parities, starting from the transition to first birth and then proceeding to subsequent parity transitions (see Appendix of Zeman et al. 2017 for the method details). The underlying idea is that the change in the progression rate to a given parity i affects not only the number of women in this parity but also all the higher-parity distributions.11 The difference between CFR
in initial cohort c1 and in final cohort c2 is expressed as:
11 Consider, for instance, a hypothetical case of a population where women have three children at most and
each parity progression rate (PPR01, PPR12, and PPR23) is fixed at 0.8. The total share of women with three
children is then computed as 0.80 * 0.80 * 0.80 = 0.512. If the first birth progression rate, PPR01, falls to 0.6,
CFR − CFR = ∑ − ∑ CFR (6)
The relationship between completed cohort fertility rate and parity progression ratios is expressed as:
CFR = PPR , + PPR , ∗ PPR , + PPR , ∗ PPR , ∗ PPR , + PPR , ∗ PPR , ∗
PPR , ∗ ,, (7)
In order to estimate the contribution of changes in PPR01, PPR12, and PPR23 and
higher to the overall change in the CFR between two cohorts, changes in parity progression ratios are considered stepwise, from lower to higher parities. We analyse the contribution of changes in each progression rate between the two cohorts compared, c1 and c2, by fixing the values of the subsequent progressions to higher parities at the level of the initial cohort, c1.
This is done directly within the completed cohort fertility rates. Thus, under the condition of fixed PPR1,2 and higher, the completed cohort fertility rate is computed as:
CFR , = PPR , + PPR , ∗ PPR , + PPR , ∗ PPR , ∗ PPR , +
PPR , ∗ PPR , ∗ PPR , ∗ PPR , /(1 − PPR , ) (8)
Completed cohort fertility rate under the condition of fixed PPR2,3 and higher is
computed as:
CFR , = PPR
, + PPR , ∗ PPR , + PPR , ∗ PPR , ∗ PPR , +
PPR , ∗ PPR , ∗ PPR , ∗ PPR , /(1 − PPR , ) (9)
Using these results, we compute the contribution of changes in each parity-progression ratio, dPPR ,., to the overall change in completed cohort fertility rate
(equations 10–12). We calculate the contribution of the change in first-birth and second-birth progression rates and the contribution of the change in progression rates to third, fourth, and higher parities, using the ‘frozen’ completed cohort fertility rates in equations (8) and (9).
dPPR ,, = CFR , − CFR , (11)
dPPR ,, = CFR − CFR , (12)
To simplify the discussion of the contribution of change in PPRs to the CFR, we do not detail the contribution of declining parity progression ratios after the third birth, which had relatively small influence in most of the analysed countries, especially among the younger cohorts. We use the indicator dPPR23+defined in equation (12),
which includes the combined effects of changes in progression rates to third birth and to fourth and later births.
A similar method of decomposing the differences in total fertility rate into the contribution of individual parity-progression ratios was developed by Ní Bhrolcháin (1987) and Pullum, Tedrow, and Herting (1989), extended further by Barkalov (1999), and formalised by Das Gupta (1993, example 3.7, pp. 33–35). Later, Andreev, Shkolnikov, and Begun (2002) proposed a more general method and developed the algorithm of a stepwise replacement as a universal tool for the decomposition of differences between values of aggregate measures by age and other demographic dimensions. They concluded that their general replacement method is more exact than Barkalov’s method, which we use in this paper. However, the difference between the two methods in our decomposition results was relatively small12 and we opted for using
the simpler and intuitively easy to understand method of Barkalov.
The decomposition approach presented here entails some information loss: we analyse changes between only three cohorts (1940, 1955, and 1970) without examining cohort-to-cohort trends in detail, and we cluster countries into regions, even though fertility trajectories between countries within each region differ in some cases. However, analysing long-series data from many countries requires simplifications in order to summarise the observed changes and to find general patterns and mechanisms explaining the observed trends. Even when some regions include outliers in terms of their completed cohort fertility levels and trends (Slovakia, Ireland, Greece, United States), the parity-specific fertility patterns in these countries are still closer to other countries in the region than to other regions. Our analysis also confirmed that the dynamics of parity-specific fertility changes and the resulting contribution of different parities to the decline in completed fertility in these countries mostly followed the
12 To assess the sensitivity of the presented results to the analytical method chosen here, we also computed the
alternative decomposition of the CFR decline for two countries, Italy and South Korea, using the method by Andreev, Shkolnikov, and Begun (2002). The resulting difference was relatively small, with the latter method showing a stronger impact of declining second-birth rates (PPR12) and a weaker impact of third and
trends in broader regions to which they belong (see Table S-1). As we demonstrate in the next section, the regional approach we adopted for much of our analyses allows us to identify distinct patterns of cohort fertility change and its parity components in these broader country groups. The link between these patterns and the institutional and socioeconomic context cannot be established as rigorously as in advanced statistical modelling. However, our comprehensive methodological approach allows us to draw firm conclusions when keeping a balance between making generalisations and acknowledging particularities and nuances.
Table 2: Completed cohort fertility among women born around 1940, 1955, and 1970 and parity progression ratios, by broad regions
Region Cohort range CFR PPR0,1 PPR1,2 PPR2,3 PPR3+,4+
Eastern Europe 1940–1945 1.86 0.93 0.73 0.24 0.34
1955 1.84 0.93 0.75 0.20 0.30
1966–1968 1.64 0.91 0.63 0.19 0.31
Central Europe 1940 2.05 0.92 0.77 0.36 0.38
1955 1.97 0.92 0.79 0.30 0.31
1968 1.86 0.89 0.74 0.31 0.33
Western Europe 1940–1941 2.56 0.88 0.86 0.57 0.49
1955 2.15 0.85 0.84 0.48 0.41
1966–1971 1.93 0.83 0.80 0.43 0.36
Northern Europe 1940 2.19 0.89 0.84 0.47 0.36
1955 1.99 0.86 0.81 0.41 0.33
1966–1971 2.00 0.86 0.82 0.41 0.34
German-speaking 1940–1944 1.99 0.86 0.77 0.43 0.39
1955 1.76 0.82 0.74 0.37 0.34
1965–1969 1.64 0.78 0.74 0.33 0.33
Southern Europe 1940 2.23 0.87 0.85 0.47 0.42
1955 1.90 0.88 0.79 0.33 0.30
1968–1970 1.57 0.80 0.73 0.21 0.33
English-speaking 1940–1943 2.58 0.91 0.89 0.59 0.44
non-European 1955 2.15 0.85 0.83 0.49 0.39
1967–1968 2.05 0.85 0.81 0.46 0.39
East Asia (without Japan)
1940–1941 3.40 0.95 0.93 0.79 0.55
East Asia 1955 2.03 0.88 0.86 0.40 0.25
East Asia 1966–1969 1.68 0.81 0.79 0.30 0.22
4. Results
4.1 Changes in parity progression ratios and regional patterns of fertility decline
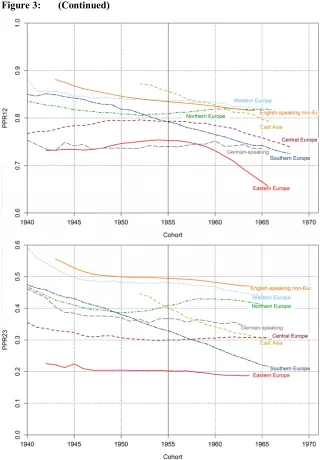
Low transition rates to second and third births explain why cohort fertility in Eastern Europe and, to a smaller extent, in Central Europe was lower than in other regions in the early-1940s birth cohorts. In Eastern Europe the progression to third birth declined slowly but steadily, remaining the lowest of all the regions until the mid-1960s cohorts, when Southern Europe experienced plummeting third-birth rates, eventually reaching equally low values (Figure 3).
Figure 3: (Continued)
German-speaking countries exhibited the highest levels of childlessness among the analysed cohorts, followed by Southern Europe and East Asia in the 1960s cohorts. The first two regions also had low transition rates to second birth. While in the German-speaking countries second-birth rates stabilised at a low level, in Southern Europe they raced continuously down, coinciding with a steep decline in the progression to third birth.
The development of parity transitions in Western and Northern Europe were comparable to that of the English-speaking non-European countries. In all three regions the largest falls in parity progression ratios took place between the 1940 and 1955 birth cohorts. The levels of childlessness varied greatly, with lower values in the United States, Scandinavia, and France and higher shares in Finland (which was very similar to England and Wales with respect to all indicators), Ireland, and the Netherlands (see Supplement Table S-1). The progression to third birth remained substantially higher in the English-speaking non-European countries than in Western and Northern Europe, while the transition rates to second birth eventually converged in these regions.
In East Asia, rapid declines across all parity progression ratios took place among the analysed cohorts, starting from very high levels among women born in the early 1950s and reaching low values among those born in 1965. Although comprising only three countries in our dataset, the region shows immense diversity, especially in childlessness rates, which increased dramatically in Japan and Singapore but only moderately in South Korea, where they remained below 10%.
4.2 Decomposition of fertility decline using parity progression ratios
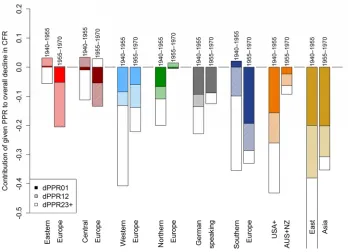
The decomposition of fertility trends into the contribution of changes in parity progression ratio to first (dPPR01), second (dPPR12), and third and later births (dPPR23+; Figure 4) allows us to quantify which parity was driving the fertility decline in the different cohorts, countries, and regions analysed. Overall, the results confirm our general expectations: The fertility decline among women born between 1940 and 1955 was mostly driven by the decreasing transition to higher-order births, whereas the change among the younger cohorts born between 1955 and 1970 was mostly due to falling transitions to first and second births, though showing striking regional differences.
0.43 children per women), but it resulted equally from increasing childlessness and declining third and higher-order progression rates, with a smaller contribution of decreasing second-birth progression rate. Similar changes in parity progression ratios took place in the German-speaking countries, but they were moderate, leading to a fertility decline of 0.23 children per woman. In Western Europe, cohort fertility fell by 0.41 children per woman, of which 0.28 – or two-thirds – was accounted for by the decline in higher parity births. Finally, Central and Eastern Europe experienced only a modest fertility decline of 0.08 and 0.03 respectively, which was entirely driven by the fall in third and higher-order progression rates. These were the only regions in which women born between 1940 and 1955 experienced an increase in the transition to second birth.
Fertility decline was weaker among women born between 1955 and around 1970 in all regions except Eastern and Central Europe, and resulted mostly from decreases in parity progression ratios to first and second births. However, the role of each of these transitions differed widely across regions. The sharp fall in second-birth progression rate in Eastern Europe accounted for three-quarters of the CFR drop of 0.20 children per woman. In Central Europe the fertility decline was more moderate (–0.11), but it was also mostly driven by falling second-birth rates, with childlessness playing a smaller role (Figure 4).
By contrast, in Western Europe and the English-speaking non-European countries the decrease in CFR resulted equally from declines in PPR01, PPR12, and PPR23, or
higher. A CFR drop of 0.13 in the German-speaking countries was caused mostly by the increase in childlessness. Southern Europe and East Asia saw the largest fertility reductions, by 0.33 or 0.35 children per woman, resulting primarily from rises in childlessness (which constituted almost 60% of the overall fall in fertility) and decreases in second-birth rates, and only marginally from reductions in higher-order births.
In the Nordic countries, fertility hardly changed (Finland, Norway, and Sweden) or even increased (Denmark). In the United States fertility increased, unlike in Australia and New Zealand, mostly as a result of elevated transitions to first and third birth (Supplement Table S-1).
Figure 4: Contribution of changes in parity progression ratio to first (dPPR01), second (dPPR12), and higher order births (dPPR23+) to the decline in completed cohort fertility among women born between (around) 1940 and 1955 (left-hand bars) and between 1955 and (around) 1970 (right-hand bars), by region
Source: Own calculations based on sources listed in the Supplement Table S-1.
4.3 Fertility decline below 1.75 children per woman
Countries in which fertility declined below 1.75 children per woman for at least two successive cohorts belong to four regions: Eastern Europe and Southern Europe, the German-speaking countries, and East Asia (see details in Table 3, Figure 5, and Figure 6).
reaching the level of 1.53 children per woman in the late-1960s cohorts. By contrast, in Italy and Spain fertility fell much more quickly: the CFR declined on average by 0.02– 0.03 per cohort, heading towards the level of 1.5 in the late-1960s cohorts. However, nowhere did the fertility decline proceed as fast as in Japan. Within seven birth cohorts, fertility in Japan dropped by 0.25 children per woman, falling to 1.49 in the 1969 cohort.
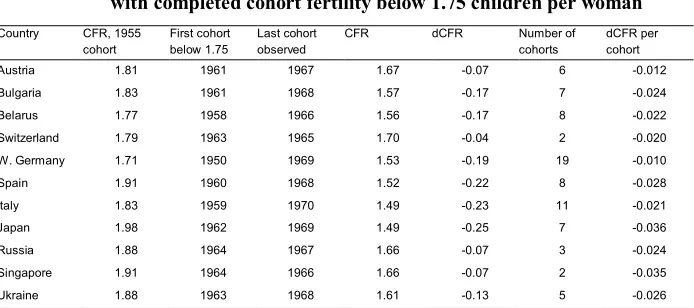
Table 3: Key indicators of cohort fertility decline to very low levels; countries with completed cohort fertility below 1.75 children per woman
Country CFR, 1955
cohort
First cohort below 1.75
Last cohort observed
CFR dCFR Number of
cohorts
dCFR per cohort
Austria 1.81 1961 1967 1.67 -0.07 6 -0.012
Bulgaria 1.83 1961 1968 1.57 -0.17 7 -0.024
Belarus 1.77 1958 1966 1.56 -0.17 8 -0.022
Switzerland 1.79 1963 1965 1.70 -0.04 2 -0.020
W. Germany 1.71 1950 1969 1.53 -0.19 19 -0.010
Spain 1.91 1960 1968 1.52 -0.22 8 -0.028
Italy 1.83 1959 1970 1.49 -0.23 11 -0.021
Japan 1.98 1962 1969 1.49 -0.25 7 -0.036
Russia 1.88 1964 1967 1.66 -0.07 3 -0.024
Singapore 1.91 1964 1966 1.66 -0.07 2 -0.035
Ukraine 1.88 1963 1968 1.61 -0.13 5 -0.026
Source: Own calculations based on sources listed in the Supplement Table S-1.
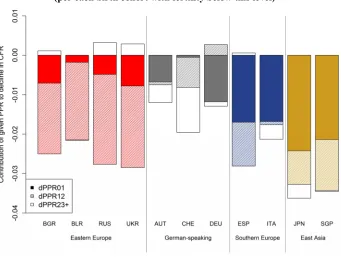
Figure 5: Average contribution of changes in parity progression ratio to first (dPPR01), second (dPPR12), and further birth (dPPR23+) to the decline in completed cohort fertility in countries with the CFR below 1.75 (per each birth cohort with fertility below this level)
Source: Own calculations based on sources listed in the Supplement Table S-1.
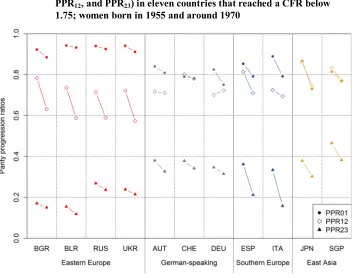
combination embodies first the stopping-at-two pattern, and then the one-child pattern depicted in Figure 2. Finally, in East Asia each progression rate fell to low levels, with first and second-birth trajectories moving in tandem. There, the combination of parity progression ratios did not strictly correspond to one of our stylised combinations, but moved towards a mix of the high childlessness and one-child configurations. Besides Switzerland, these are the only countries where progression to first birth reached as low levels as the second-birth progression rates.
The various changes in parity-specific transition rates resulted in distinct parity compositions. While most of the very low fertility regions have experienced high and increasing childlessness, Eastern Europe is characterised by a high proportion of one-child families, quickly increasing at the expense of families with two and more one-children (see Appendix Figure A-1 in Zeman et al. 2017).
Figure 6: Parity progression ratios to first, second, and third birth (PPR01, PPR12, and PPR23) in eleven countries that reached a CFR below 1.75; women born in 1955 and around 1970
5. Discussion: The regional context of cohort fertility declines
Our study provides a systematic analysis of the parity components of cohort fertility decline in the low fertility countries among women born between 1940 and 1970. The fall in fertility among the older cohorts analysed, born between 1940 and 1955, was mostly driven by reductions in the progression ratios to third and higher-order births. It was also stronger in countries where the fertility transition started later, especially in Ireland, Spain, and East Asia. Only a few countries deviated from these broader regional patterns, with the fall in first-birth rates (and the concomitant rise in childlessness) dominating the fertility decline in Western Germany, Switzerland, and the Netherlands.
Among women born between 1955 and 1970 the fertility decline slowed down in most regions except Southern and Central Europe, where it continued, and in Eastern Europe, where it accelerated in connection with the turbulent social and economic transition after the collapse of state socialism. We have identified distinct regional trajectories of fertility change, which were also manifested in the countries and regions that saw their CFR falling to very low levels of below 1.75 children per woman. Clearly, countries and regions followed different pathways towards very low fertility, broadly confirming our hypotheses sketched in Table 1. The main distinction can be drawn between the countries of Central and Eastern Europe, where the fertility decline was primarily driven by falling second-birth rates, and the German-speaking countries, Southern Europe, and East Asia, where the fall in first-birth rates was more relevant. In the Nordic countries and the United States, fertility broadly stabilised or increased, while the fertility declines in Western Europe and in Australia and New Zealand were driven equally by relatively minor changes across all parity-specific transition rates. Thus, in two broad regions – Western Europe and English-speaking countries outside Europe – our parity-specific predictions were not supported by the empirical data.
The fact that the regional trends in parity progression ratios differed from each other, even in regions with similarly low cohort fertility, suggests that there is no uniform explanation of low fertility that fits all low fertility countries (see also Rindfuss and Choe 2015). Here we summarise the key differences between regions and discuss selected region-specific factors that were arguably important in the later phase of the observed cohort fertility decline, i.e., among women born after 1955.
(Berrington, Stone, and Beaujouan 2015; Schoen 2006). This pattern is partly driven by unplanned pregnancies, which are most common among lower-educated women (Musick et al. 2009). In the United States these women consequently have more children than they intended (Morgan and Rackin 2010).
Western and Northern Europe together with the English-speaking non-European countries are the most gender-equal regions globally, whose institutional arrangements make it “easier, not easy” (Rindfuss, Choe, and Brauner-Otto 2016: 1) for women to combine work and family. The most developed work- and family- friendly policies with generous family transfers, high level of childcare coverage, and policies promoting work-family balance are found in the Nordic countries (Rindfuss, Choe, and Brauner-Otto 2016) and in some countries of Western Europe, especially France (Klüsener, Neels, and Kreyenfeld 2013). There, the family-friendly policies have nurtured and maintained positive attitudes towards larger families (Toulemon, Pailhé, and Rossier 2008). In the Netherlands the male breadwinner model is still widely accepted but the labour market offers abundant and rewarding part-time job opportunities (Mills 2015). Thus, it is not surprising that in these countries no major change in the structure of the families was observed, but rather a smooth and moderate change in cohort fertility across all parities.
contributing to high childlessness and generally low levels of fertility (Adserà 2005; De Rose, Racioppi, and Zanatta 2008).
In Central and Eastern Europe, fertility fell mostly due to the declining transition to second child, while third-birth rates remained low, which contrasted with these regions having the highest first-birth rates among all those analysed and their continuing negative attitudes to childlessness (Sobotka and Testa 2008; Merz and Liefbroer 2012). Especially highly educated women often choose to have only one child to satisfy the social norm of becoming a mother, while at the same time limiting the inevitable double burden of working full-time and taking care of household tasks (Frejka 2008; Brzozowska 2015). The transition to a market economy, new economic uncertainties, and relatively low wages together with traditional gender roles within the family have contributed to the continuously rising share of one-child families, with the second-birth progression ratio in Eastern Europe falling to or below 0.6. This development has been strengthened by the ‘failure’ of many couples to realise their childbearing intentions (Spéder and Kapitány 2014). The rise in one-child families has been particularly dramatic in Eastern Europe, which is economically weaker and suffered a turbulent social and economic transition in the 1990s (e.g., Philipov, Spéder, and Billari 2006; Sobotka 2011).
East Asia has experienced the most rapid shift from high to very low fertility levels among the analysed regions. Among women born after 1955 this decline was fuelled by a fall across all parity progression ratios, with South Korea lagging behind in the first-birth decline. The whole region has undergone a rapid transformation towards high education and rising career aspirations among younger men and women, combined with long working hours and a competitive labour market (see contributions in Rindfuss and Choe 2015). At the same time, gender roles within the family have remained far more traditional than in Europe (Jones, Straughan, and Chan 2008) and, until recently, family policies mostly focused on financial incentives that did not promote the reconciliation of work and family. For women, having children usually implies quitting the labour market (Ma 2014; Rindfuss, Choe, and Brauner-Otto 2016). In addition, the social pressure to invest in children’s education is stronger than anywhere else in the world, further nurturing the trend towards higher childlessness and more one-child families.
uniform set of factors. However, most of the lowest-fertility countries remain strongly gender-unequal, fostering the traditional male-breadwinner model and not actively supporting the reconciliation of work and family (Esping-Andersen 2009). The strong increase in very small families (0 or 1 child) in all these countries lends support to the idea that gender systems are “critical components” in explaining fertility levels and differentials (McDonald 2000, 2006; Esping-Andersen 2009; Esping-Andersen and Billari 2015; Baizán, Arpino, and Delclòs 2016). The next key factor is economic uncertainty, which has been affecting the fertility decisions of younger cohorts, especially in Southern, Central, and Eastern Europe.
How will the fertility trends develop among women born in the 1970s and the early 1980s? In Central and Eastern Europe, childlessness is likely to start rising faster than in the previous cohorts because of educational expansion and the progressive westernisation of lifestyles. This includes rising aspirations regarding self-realisation, living standards, and parenting, and new structural constraints such as unstable labour markets and costly housing leading to a late departure from the parental home, documented for the region since the 1990s (e.g., Sobotka 2011; Frejka and Gietel-Basten 2016). One-child families are set to become yet more prevalent in Central Europe. Similarly, in Southern Europe and East Asia we expect further increases in childlessness and a more pronounced shift to one-child families. In the other regions the available data and projections suggest a broad stabilisation of cohort fertility among women born in the 1970s (Myrskylä, Goldstein, and Cheng 2013), which indicates that parity-specific fertility is also likely to remain similar to that observed in the late 1960s cohorts.
labour market reforms in creating more career opportunities, more stable employment for the young, and a more gender-equal social and work environment.
6. Acknowledgements
References
Adserà, A. (2004). Changing fertility rates in developed countries. The impact of labour market institutions.Journal of Population Economics 17(1): 1–27.doi:10.1007/ s00148-003-0166-x.
Adserà, A. (2005). Vanishing children: From high unemployment to low fertility in developed countries. American Economic Review95(2): 189–193.doi:10.1257/ 000282805774669763.
Adserà, A. (2011). Where are the babies? Labor market conditions and fertility in Europe.European Journal of Population27(1): 1–32. doi:10.1007/s10680-010-9222-x.
Anderson, T. and Kohler, H.-P. (2012). Education fever and the East Asian fertility puzzle: A case study of low fertility in South Korea. Asian Population Studies
9(2): 196–215.doi:10.1080/17441730.2013.797293.
Andersson, G., Rønsen, M., Knudsen, L.B., Lappegård, T., Neyer, G., Skrede, K., Teschner, K., and Vikat, A. (2009). Cohort fertility patterns in the Nordic countries. Demographic Research 20(14): 313–352. doi:10.4054/DemRes. 2009.20.14.
Avdeev, A. and Monnier, A. (1995). A survey of modern Russian fertility.Population:
An English Selection 7: 1–38.
Andreev, E.M., Shkolnikov, V.M., and Begun, A.Z. (2002). Algorithm for decomposition of differences between aggregate demographic measures and its application to life expectancies, healthy life expectancies, parity-progression ratios, and total fertility rates. Demographic Research 7(14): 499–522.
doi:10.4054/DemRes.2002.7.14.
Baizán, P., Arpino, B., and Delclòs, C.E. (2016). The effect of gender policies on fertility: The moderating role of education and normative context. European
Journal of Population32(1): 1–30.doi:10.1007/s10680-015-9356-y.
Barkalov, N.B. (1999). The fertility decline in Russia, 1989–1996: A view with period parity-progression ratios.Genus 55(3–4): 11–60.
Beaujouan, É., Brzozowska, Z., and Zeman, K. (2016). Childlessness trends in twentieth century Europe: Limited link to growing educational attainment.
Berrington, A., Stone, J., and Beaujouan, É. (2015). Educational differences in timing and quantum of childbearing in Britain: A study of cohorts born 1940–1969.
Demographic Research 33(26): 733–764.doi:10.4054/DemRes.2015.33.26.
Billari, F.C. and Kohler, H.-P. (2004). Patterns of low and very low fertility in Europe.
Population Studies 58(2): 161–176.doi:10.1080/0032472042000213695.
Biryukova, S., Sinyavskaya, O., and Nurimanova, I. (2016). Estimating effects of 2007 family policy changes on probability of second and subsequent births in Russia. Moscow: National Research University Higher School of Economics (Working paper WP BRP 68/SOC/2016).
Blossfeld, H.-P., Klijzing, E., Mills, M., and Kurz, K. (2005). Globalization,
uncertainty, and youth in society: The losers in a globalizing world. New York:
Routledge.
Bongaarts, J. and Sobotka, T. (2012). A demographic explanation for the recent rise in European fertility. Population and Development Review 38(1): 83–120.
doi:10.1111/j.1728-4457.2012.00473.x.
Brzozowska, Z. (2015). Female education and fertility under state socialism in Central and Eastern Europe. Population (English Edition) 70(4): 731–769.
Bujard, M. and Sulak, H. (2016). Mehr Kinderlose oder weniger Kinderreiche? Eine Dekomposition der demografischen Treiber in unterschiedlichen Phasen des Geburtenrückgangs in Deutschland. Kölner Zeitschrift für Soziologie und
Sozialpsychologie 68(3): 487–514.doi:10.1007/s11577-016-0373-6.
Bumpass, L.L., Rindfuss, R.R., Choe, M.K., and Tsuya, N.O. (2009). The institutional context of low fertility: The case of Japan.Asian Population Studies 5(3): 215– 235.doi:10.1080/17441730903351479.
Burkimsher, M. and Zeman, K. (2017). Childlessness in Switzerland and Austria. In: Kreyenfeld, M. and Konietzka, D. (eds.). Childlessness in Europe: Contexts,
causes, and consequences. Cham: Springer: 115–137.
doi:10.1007/978-3-319-44667-7_6.
Calot, G. and Sardon, J.-P. (2004). Methodology for the calculation of Eurostat’s demographic indicators: Detailed report by the European Demographic Observatory. Brussels: European Commission (Population and Social Conditions 3/2003/F/no 26).
Council of Europe (2005). Recent demographic developments in Europe 2004. Strasbourg: Council of Europe Publishing.
Das Gupta, P. (1993). Standardization and decomposition of rates: A user’s manual. Washington, D.C.: US Bureau of the Census (Current Population Reports, Special Studies P23–186). https://www.census.gov/content/dam/Census/library/ publications/1993/demo/p23-186.pdf.
Delgado, M., Meil, G., and Zamora López, F. (2008). Spain: Short on children and short on family policies. Demographic Research 19(27): 1059–1104.
doi:10.4054/DemRes.2008.19.27.
De Rose, A., Racioppi, F., and Zanatta, A.L. (2008). Italy: Delayed adaptation of social institutions to changes in family behaviour. Demographic Research 19(19): 665–704.doi:10.4054/DemRes.2008.19.19.
Ekert-Jaffé, O., Joshi, H., Lynch, K., Mougin, R., Rendall, M.S., and Shapiro, D. (2002). Fertility, timing of births, and socioeconomic status in France and Britain: Social policies and occupational polarisation. Population (English
Edition)57(3): 475–507.doi:10.2307/3246636.
Esping-Andersen, G. (2009). The incomplete revolution: Adapting to women’s new
roles. Cambridge: Polity Press.
Esping-Andersen, G. and Billari, F.C. (2015). Re-theorizing family demographics.
Population and Development Review 41(1): 1–31. doi:10.1111/j.1728-4457.
2015.00024.x.
Frejka, T. (2008). Parity distribution and completed family size in Europe: Incipient decline of the two-child family model. Demographic Research 19(4): 47–72.
doi:10.4054/DemRes.2008.19.4.
Frejka, T. and Calot, G. (2001). Cohort reproductive patterns in low fertility countries.
Population and Development Review 27(1): 103–132.doi:10.1111/j.1728-4457.
2001.00103.x.
Frejka, T. and Gietel-Basten, S. (2016). Fertility and family policies in Central and Eastern Europe after 1990.Comparative Population Studies 41(1): 3–56. Frejka, T., Jones, G.W., and Sardon, J.-P. (2010). East Asian childbearing patterns and
policy developments. Population and Development Review 36(3): 579–606.
Frejka, T. and Sardon, J.-P. (2007). Cohort birth order, parity progression ratio, and parity distribution trends in developed countries.Demographic Research16(11): 315–374.doi:10.4054/DemRes.2007.16.11.
Frejka, T. and Zakharov, S. (2013). The apparent failure of Russia’s pronatalist family policies.Population and Development Review 39(4): 635–647. doi:10.1111/j.17 28-4457.2013.00631.x.
Goldscheider, F., Bernhardt, E., and Lappegård, T. (2015). The gender revolution: A framework for understanding changing family and demographic behavior.
Population and Development Review 41(2): 207–239.doi:10.1111/j.1728-4457.
2015.00045.x.
Human Fertility Database (2017). Human Fertility Database [electronic resource]. Rostock and Vienna: Max Planck Institute for Demographic Research and Vienna Institute of Demography.www.humanfertility.org.
Jasilioniene, A., Jdanov, D.A., Sobotka, T., Andreev, E.M., Zeman, K., and Shkolnikov, V.M. (2015). Methods protocol for the Human Fertility Database. Rostock: Max Planck Institute for Demographic Research.
Jones, G.W., Straughan, P., and Chan, A. (2008). Ultra-low fertility in Pacific Asia:
Trends, causes, and policy issues.New York: Routledge.
Jones, G.W. and Gubhaju, B. (2009). Factors influencing changes in mean age at first marriage and proportions never marrying in the low-fertility countries of East and Southeast Asia.Asian Population Studies 5(3): 237–265. doi:10.1080/1744 1730903351487.
Kim, E.H.-W. and Cheung, A.K.L. (2015). Women’s attitudes toward family formation and life stage transitions: A longitudinal study in Korea.Journal of Marriage
and Family 77(5): 1074–1090.doi:10.1111/jomf.12222.
Klüsener, S., Neels, K., and Kreyenfeld, M. (2013). Family policies and the Western European fertility divide: Insights from a natural experiment in Belgium.
Population and Development Review 39(4): 587–610.doi:10.1111/j.1728-4457.
2013.00629.x.
Kohler, H.-P., Billari, F.C., and Ortega, J.A. (2002). The emergence of lowest-low fertility in Europe during the 1990s.Population and Development Review 28(4): 641–680.doi:10.1111/j.1728-4457.2002.00641.x.
Kreyenfeld, M. and Konietzka, D. (2017). Childlessness in Europe: Contexts, causes,
Lee, R. and Mason, A. (2014). Is low fertility really a problem? Population aging, dependency, and consumption. Science 346(6206): 229–234. doi:10.1126/ science.1250542.
Leitner, S. (2010). Germany outpaces Austria in childcare policy: The historical contingencies of ‘conservative’ childcare policy. Journal of European Social
Policy 20(5): 456–457.doi:10.1177/0958928710380482.
Lesthaeghe, R.J. (2010). The unfolding story of the second demographic transition.
Population and Development Review 36(2): 211–251.doi:10.1111/j.1728-4457.
2010.00328.x.
Ma, L. (2014). Economic crisis and women’s labor force return after childbirth: Evidence from South Korea. Demographic Research 31(18): 511–552.
doi:10.4054/DemRes.2014.31.18.
McDonald, P. (2000). Gender equity, social institutions, and the future of fertility.
Journal of Population Research 17(1): 1–15.doi:10.1007/BF03029445.
McDonald, P. (2006). Low fertility and the state: The efficacy of policy. Population
and Development Review32(3): 485–510.doi:10.1016/j.fertnstert.2006.07.1078.
Merz, E.M. and Liefbroer, A.C. (2012). The attitude toward voluntary childlessness in Europe: Cultural and institutional explanations.Journal of Marriage and Family
74(3): 587–600.doi:10.1111/j.1741-3737.2012.00972.x.
Mills, M.C. (2015). The Dutch fertility paradox: How the Netherlands has managed to sustain near replacement fertility. In: Rindfuss, R.R. and Choe, M.K. (eds.).Low
and lower fertility: Variations across developed countries.New York: Springer:
161–188.doi:10.1007/978-3-319-21482-5_9.
Morgan, S.P. (1996). Characteristic features of modern American fertility. In: Casterline, J.B., Lee, R.D., and Foote, K.A. (eds.).Fertility in the United States:
New patterns, new theories. New York: Population Council: 19–63.
doi:10.2307/2808004.
Morgan, S.P. and Rackin, H. (2010). The correspondence between fertility intentions and behavior in the United States. Population and Development Review 36(1): 91–118.doi:10.1111/j.1728-4457.2010.00319.x.
Musick, K., England, P., Edgington, S., and Kangas, N. (2009). Education differences in intended and unintended fertility. Social Forces 88(2): 543–572.
Myrskylä, M., Goldstein, J., and Cheng, Y.-H.A. (2013). New cohort fertility forecasts for the developed world: Rises, falls, and reversals. Population and
Development Review39(1): 31–56.doi:10.1111/j.1728-4457.2013.00572.x.
Neels, K. and De Wachter, D. (2010). Postponement and recuperation of Belgian fertility: How are they related to rising female educational attainment?Vienna
Yearbook of Population Research 8: 77–106. doi:10.1553/populationyearbook
2010s77.
Ní Bhrolcháin, M. (1987). Period parity progression ratios and birth intervals in England and Wales, 1941–1971: A synthetic life table analysis. Population
Studies 41(1): 103–125.doi:10.1080/0032472031000142556.
ONS (2014). Percentage distribution of women of childbearing age by number of live-born children, age, and year of birth of woman, 1920–1995, England and Wales. Newport: Office for National Statistics.
Philipov, D., Spéder, Z., and Billari, F.C. (2006). Soon, later, or ever? The impact of anomie and social capital on fertility intentions in Bulgaria (2002) and Hungary (2001).Population Studies60(3): 289–308.doi:10.1080/00324720600896080. Pötzsch, O. (2016). Fertility in Germany before and after the 2011 Census: Still no
trend reversal in sight.Comparative Population Studies 41(1): 87–118.
Pullum, T.W., Tedrow, L.M., and Herting, J.R. (1989). Measuring change and continuity in parity distributions. Demography 26(3): 485–498. doi:10.2307/ 2061608.
Rindfuss, R.R. and Choe, M.K. (2015). Low and lower fertility: Variations across
developed countries. Cham: Springer International. doi:10.1007/978-3-319-214
82-5.
Rindfuss, R.R., Choe, M.K., and Brauner-Otto, S.R. (2016). The emergence of two distinct fertility regimes in economically advanced countries. Population
Research and Policy Review 35(3): 287–304.doi:10.1007/s11113-016-9387-z.
Sardon, J. (2006a). Recent demographic trends in Europe and the other developed countries.Population (English Edition) 61(3): 197–266.doi:10.3917/pope.603. 0197.
Sardon, J. (2006b). Fertility in the developed English-speaking countries outside Europe: Canada, United States, Australia, and New Zealand. Population
Schoen, R. (2006). Insights from parity status life tables for the 20th century US.Social
Science Research 35(1): 29–39.doi:10.1016/j.ssresearch.2004.06.002.
Sobotka, T. (2011). Fertility in Central and Eastern Europe after 1989: Collapse and gradual recovery.Historical Social Research 36(2): 246–296.
Sobotka, T. (2012). Fertility in Austria, Germany, and Switzerland: Is there a common pattern?Comparative Population Studies 36(2–3): 263–304.
Sobotka, T. (2017). Childlessness in Europe: Reconstructing long-term trends among women born in 1900–1972. In: Kreyenfeld, M. and Konietzka, D. (eds.).
Childlessness in Europe: Contexts, causes, and consequences. Cham: Springer:
17–53.
Sobotka, T. and Testa, M.R. (2008). Attitudes and intentions toward childlessness in Europe. In: Höhn, C., Avramov, D., and Kotowska, I.E. (eds.). People,
population change, and policies. Dordrecht: Springer: 177–211. doi:10.1007/
978-1-4020-6609-2_9.
Sobotka, T., Zeman, K., Potančoková, M., Eder, J., Brzozowska, Z., Beaujouan, É., and Matysiak, A. (2015). European Fertility Datasheet 2015 [electronic resource]. Vienna: Vienna Institute of Demography / Wittgenstein Centre for Demography and Global Human Capital (IIASA, VID/ÖAW, WU). http://fertilitydata sheet.org/.
Stloukal, L. (1999). Understanding the “abortion culture” in Central and Eastern Europe. In: David, H.P. and Skilogianis, J. (eds.). From abortion to contraception: A resource to public policies and reproductive behavior in
Central and Eastern Europe from 1917 to the present. Westport: Greenwood
Press: 23–37.
Spéder, Z. and Kapitány, B. (2014). Failure to realize fertility intentions: A key aspect of the post-communist fertility transition. Population Research and Policy
Review 33(3): 393–418.doi:10.1007/s11113-013-9313-6.
Striessnig, E. and Lutz, W. (2013). Can below-replacement fertility be desirable?
Empirica 40(3): 409–425.doi:10.1007/s10663-013-9213-3.
Tan, P.L., Morgan, S.P., and Zagheni, E. (2016). A case for “reverse one-child” policies in Japan and South Korea? Examining the link between education costs and lowest-low fertility. Population Research and Policy Review 35(3): 327–350.
Tsuya, N.O. (2015). Below-replacement fertility in Japan: Patterns, factors, and policy implications. In: Rindfuss, R.R. and Choe, M.K. (eds.).Low and lower fertility. Cham: Springer: 87–106.
Toulemon, L., Pailhé, A., and Rossier, C. (2008). France: High and stable fertility.
Demographic Research 19(16): 503–556.doi:10.4054/DemRes.2008.19.16.
Van Bavel, J., Klesment, M., Beaujouan, É., Brzozowska, Z., Puur, A., Reher, D.S., Requena, M., Sandström, G., Sobotka T., and Zeman, K. (2015). Women’s
education and cohort fertility during the baby boom. Paper presented at the
Annual Meeting of the Population Association of America, San Diego, United States, April 30–May 2, 2015.
Van de Kaa, D.J. (1987). Europe’s second demographic transition.Population Bulletin
42(1): 1–59.
Wilson, C. (2013). Thinking about post-transitional demographic regimes: A reflection.
Demographic Research 28(46): 1373–1388.doi:10.4054/DemRes.2013.28.46.
Yoo, S.H. (2016). Postponement and recuperation in cohort marriage: The experience of South Korea. Demographic Research 35(35): 1045–1078.doi:10.4054/Dem Res.2016.35.35.
Zeman, K., Brzozowska, Z., Sobotka, T., Beaujouan, É., and Matysiak, A. (2014). Cohort Fertility and Education Database: Methods protocol [electronic resource]. Vienna: Vienna Institute of Demography. http://www.eurrep.org/wp-content/uploads/EURREP_Database_Methods_Protocol_Dec2014.pdf.