R E S E A R C H A R T I C L E
Open Access
Parallel evolution of highly conserved
plastid genome architecture in red
seaweeds and seed plants
JunMo Lee
1, Chung Hyun Cho
1, Seung In Park
1, Ji Won Choi
1, Hyun Suk Song
1, John A. West
2,
Debashish Bhattacharya
3†and Hwan Su Yoon
1*†Abstract
Background:The red algae (Rhodophyta) diverged from the green algae and plants (Viridiplantae) over one billion
years ago within the kingdom Archaeplastida. These photosynthetic lineages provide an ideal model to study plastid genome reduction in deep time. To this end, we assembled a large dataset of the plastid genomes that were available, including 48 from the red algae (17 complete and three partial genomes produced for this analysis) to elucidate the evolutionary history of these organelles.
Results:We found extreme conservation of plastid genome architecture in the major lineages of the multicellular
Florideophyceae red algae. Only three minor structural types were detected in this group, which are explained by recombination events of the duplicated rDNA operons. A similar high level of structural conservation (although with different gene content) was found in seed plants. Three major plastid genome architectures were identified in representatives of 46 orders of angiosperms and three orders of gymnosperms.
Conclusions:Our results provide a comprehensive account of plastid gene loss and rearrangement events involving
genome architecture within Archaeplastida and lead to one over-arching conclusion: from an ancestral pool of highly rearranged plastid genomes in red and green algae, the aquatic (Florideophyceae) and terrestrial (seed plants) multicellular lineages display high conservation in plastid genome architecture. This phenomenon correlates with, and could be explained by, the independent and widely divergent (separated by >400 million years) origins of complex sexual cycles and reproductive structures that led to the rapid diversification of these lineages.
Keywords:Plastid genome architecture, Parallel evolution, Rhodophyta, Florideophyceae, Seed plants
Abbreviations:AU, Approximately unbiased; BD, Breakpoint distance; CDS, Coding sequences; EGT, Endosymbiotic
gene transfer; IR, Inverted repeat; LSC, Large single copy; ML, Maximum likelihood; MLB, Maximum likelihood bootstrap support; mya, Million years ago; NGS, Next-generation sequencing; OGF, Orthologous gene family; ORF, Open-reading frame; rDNA, Ribosomal DNA operon; SSC, Small single copy; tRNA, Transfer RNA
Background
Eukaryotes acquired the photosynthetic organelle, the plas-tid, from a cyanobacterium through primary endosymbi-osis that was followed by its integration as an intracellular organelle [1]. This double membrane-bound photosyn-thetic compartment [2] is widely believed to have had a
single origin in the common ancestor of the Archaeplas-tida that comprises glaucophytes, red algae (Rhodophyta), and Viridiplantae (including green algae and land plants) [3, 4]. Despite the maintenance of many core components of the protein translation apparatus, photosystem, and ATPase complexes, the long-term impacts of Muller’s ratchet [5] has reduced the size of plastid genomes to ~100–200 kbp with some exceptional cases [e.g., the parasitic red alga Choreocolax polysiphoniae (90 kbp) and the non-photosynthetic land plantsEpipogium roseum (19 kbp) and E. aphyllum (30 kbp)] [6, 7]. This is in
* Correspondence:[email protected]
†Equal contributors
1Department of Biological Sciences, Sungkyunkwan University, Suwon 16419,
Republic of Korea
Full list of author information is available at the end of the article
© 2016 Yoon et al.Open AccessThis article is distributed under the terms of the Creative Commons Attribution 4.0
contrast to a size of several megabases that likely defined the genome of the cyanobacterial endosymbiont. Plastid genome reduction is explained by outright gene loss or intracellular transfer to the host nuclear genome through endosymbiotic gene transfer (EGT) [8–11].
Red algae comprise ~7100 species found primarily in marine environments, although some also occur in fresh-water habitats. Beyond their important ecological roles, red algae are crucial to the evolution of marine phyto-plankton. This is because a single or, potentially, multiple ancient red algal lineages donated their plastid to a myriad of chlorophyll c-containing forms such as haptophytes, cryptophytes, stramenopiles, dinoflagellates, and apicom-plexans through secondary (or additional rounds of) endosymbiosis [12–14]. Due to the importance of these chlorophyllc-containing groups as primary producers and grazers, a large number (currently 75) of species with red algal-derived plastids have been sequenced. However, the donor lineage of these plastids remains relatively poorly studied, with only 29 plastid genomes reported, and these primarily from a single red algal class, the sexually repro-ducing (with one exception, see below) Florideophyceae, with no genomes available from three other classes that rely primarily on asexual reproduction (Stylonematophyceae, Compsopogonophyceae, and Rhodellophyceae) [6, 15–27]. This imbalance in available data is readily apparent when compared to Viridiplantae, for which hundreds of complete plastid genomes have been determined. These “green” plastid genomes have been used to re-solve basal group relationships in Viridiplantae and to document the high genome architecture variability in most green algae when compared to the extreme con-servation found in flowering plants (about 800 ge-nomes in GenBank) [28–30].
Given their shared evolutionary history, red algae and Viridiplantae provide an ideal test bed to compare plas-tid genome architecture and the extent of gene loss and EGT over >1 billion years of evolution. To enable this analysis, we determined 17 novel red algal plastid ge-nomes with three additional datasets derived from par-tial plastid genomes, bringing the total to 48 for this phylum. These genomes represent most red algal classes as well as the 12 orders of the largest subclass Rhodyme-niophycidae (5011 species) in the class Florideophyceae (6755 species; see Algaebase: http://www.algaebase.org). With these broadly sampled genome data we asked the following two questions: what are the major trends in gene loss and EGT in these taxa, and what can we learn about the evolution of genome architecture following the ancient split of the red and green lineages within the Archaeplastida? Our results demonstrate extensive vari-ation in algal plastid gene content and genome architecture but identify highly conserved plastid genomes in
Florideo-phyceae and seed plants. We speculate that the
independent origins of complex sexual cycles may have constrained the evolution of these latter genomes.
Results and discussion
General features of red algal plastid genomes
Seventeen complete red algal plastid genomes were deter-mined using next-generation sequencing (NGS) methods (Additional file 1: Table S1). An additional three partial genome datasets were added for the phylogenetic analysis. Genome size and gene contents varied at the class and species level. For instance, plastid genome size in the early-diverging red algal class Cyanidiophyceae was smaller (145–167 kbp) than in the other classes: Stylonematophy-ceae (Bangiopsis subsimplex, 204 kbp), Compsopogono-phyceae (Erythrotrichia carnea, 210 kbp; Rhodochaete parvula, 222 kbp), Porphyridiophyceae (Porphyridium purpureum, 217 kbp; P. sordidum, 259 kbp), and the well-supported monophyletic group comprising Bangiophy-ceae (187–196 kbp) and Florideophyceae (167–194 kbp). An average of 202 protein-coding sequences (cds) was found in these plastid genomes with some variation in cds number and the encoded gene inventory (e.g., there were
184 cds in Galdieria sulphuraria and Hildenbrandia
rivularis, whereas there were 235 cds in Grateloupia taiwanensis and 224 cds in P. purpureum) (Additional file 1: Tables S1 and S2). Most of the early-diverged classes contained two copies of the ribosomal DNA operon (rDNA), whereas single or partially inactivated (pseudo-genes) duplicated rDNAs were found in most florideophy-cean species (Additional file 1: Table S1). This suggests the independent loss of one copy of the rDNA operon in these taxa. Duplicated rDNA operons (or inverted repeat including rDNAs) are broadly distributed in all primary and secondary plastids as well as in cyanobac-terial genomes [31–34]. Most red algal plastid genomes contained ~30 transfer RNAs (tRNAs), except G. sul-phuraria (39 tRNAs) and nine Bangiophyceae species
(35–37 tRNAs). The Stylonematophyceae,
andgltB) in early-diverging red algae. Nine bangiophycean species likely underwent independent losses of this region.
Phylogeny and genome architecture of red algal plastid genomes
Several aspects of the red algal tree of life remain unre-solved. These include the relationships among: 1) the basal classes, 2) the 12 orders of Rhodymeniophycidae, and 3) the nine orders of Nemaliophycidae [35–37]. These relationships have now been clarified using the max-imum likelihood (ML) tree (Additional file 3: Figure S2) that was inferred using a dataset of 191 concatenated plas-tid protein-coding genes (Additional file 1: Table S4) with the outgroup taxa in the class Cyanidiophyceae [38, 39]. Although there remain unresolved relationships among the early-diverged classes, the relationships of all 12 orders of Rhodymeniophycidae are well resolved (72–100 % ML bootstrap support, MLB), and monophyly of the three nemaliophycidaen orders are well supported (100 % MLB).
Based on this multigene phylogeny, we studied struc-tural variation among red algal plastid genomes using MUMmer [40] with the Gracilariales species Gracilaria tenuistipitataas the reference. This analysis showed that plastid genome architecture in the classes Cyanidiophy-ceae, StylonematophyCyanidiophy-ceae, CompsopogonophyCyanidiophy-ceae, and Porphyridiophyceae are highly diverged when compared to the conserved architecture in the classes Bangiophy-ceae and FlorideophyBangiophy-ceae (Additional file 3: Figure S3). Cyanidiophyceae show high within-class structural vari-ation (Additional file 3: Figure S4) when compared to Bangiophyceae and Florideophyceae (Additional file 3: Figure S3). The plastid genomes of the basal lineages (Stylonematophyceae, Compsopogonophyceae, and Por-phyridiophyceae) represent a wide swath of red algal di-versity and have retained a large number of introns (Additional file 1: Table S1). To test the effect of the in-tron data on our results, we excluded these intervening regions from the analysis (Additional file 3: Figure S5b) and found that structural variation remained comparable between these two analyses (Additional file 3: Figure S5a).
Although plastid genomes in the class Bangiophyceae are conserved, it is important to note that they derive from a single order (Bangiales). In comparison, the diverse orders of the Florideophyceae, except the subclass Hildenbrandio-phycidae (H. rivularis,H. rubra, andApophlaea sinclairii), showed surprisingly highly conserved plastid genome archi-tectures (Additional file 3: Figure S3). This latter result sug-gests that plastid genome synteny was constrained in the non-Hildenbrandiophycideae members of Florideophyceae.
Independent convergent structural changes in major red algal plastid genomes
The complete set of red algal plastid genomes was used to generate a highly resolved multigene tree for this
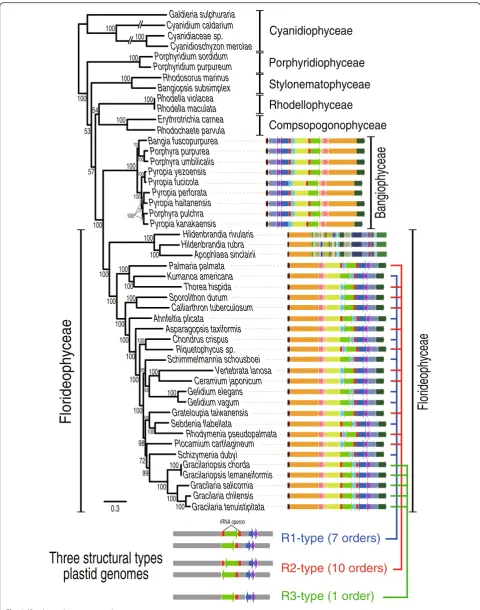
phylum. Using this tree as reference, we found that most florideophycean species, except Hildenbrandiophycidae, have three different plastid genome architectures (Fig. 1) that we named R1- (Rhodophyta-type 1), R2-, and R3-type. R1- and R2-types co-occurred in multiple places in the tree, even within highly supported monophyletic clades. For example, within the well-supported Nema-liophycidae (100 % MLB), two R2-types (Palmaria and Thorea) and one R1-type (Kumanoa) were present. The same result was found for the Chondrus (R1-type) and Riquetophycus (R2-type) monophyletic clade (100 % MLB). The R3-type was limited to the five Gracilariales spe-cies. To determine if these plastid types define convergence or, alternatively, poorly resolved nodes in the phylogenetic tree, every species with the R1- and R2-type architecture was artificially enforced into a monophyletic group. There-after, we used the approximately unbiased (AU) test [41, 42] to determine if the enforced tree was significantly better, or worse, or not different from the original top-ology. Our results show that the enforced tree topology was significantly worse and was rejected at p-value = 1e−20. This suggests that the structural types evolved in a convergent manner in most florideophycean species.
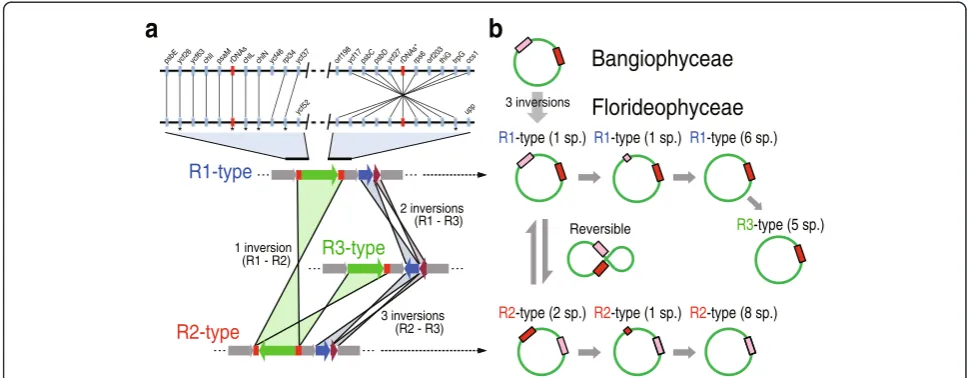
Origins of the R1-, R2-, and R3-type plastid genome architectures
R3-type (1 order)
R1-type (7 orders)
R2-type (10 orders)
Three structural types
plastid genomes
Bangiophyceae
Florideophyceae
rRNA operon
Cyanidiophyceae
Stylonematophyceae
Compsopogonophyceae
Porphyridiophyceae
Bangiopsis subsimplex
Gracilaria chilensis Gelidium vagum
Gracilaria salicornia Schizymenia dubyi
Gracilariopsis lemaneiformis Porphyra pulchra
Porphyra purpurea
Pyropia perforata Pyropia haitanensis
Thorea hispida Kumanoa americana Porphyridium sordidum
Porphyra umbilicalis Erythrotrichia carnea
Hildenbrandia rubra
Plocamium cartilagineum Ahnfeltia plicata
Rhodochaete parvula Cyanidioschyzon merolae
Calliarthron tuberculosum
Chondrus crispus
Gelidium elegans Pyropia yezoensis
Palmaria palmata
Gracilariopsis chorda Porphyridium purpureum
Asparagopsis taxiformis
Ceramium japonicum Pyropia kanakaensis
Gracilaria tenuistipitata Sporolithon durum
Hildenbrandia rivularis
Vertebrata lanosa
Sebdenia flabellata Galdieria sulphuraria Cyanidium caldarium
Riquetophycus sp.
Pyropia fucicola
Rhodymenia pseudopalmata Cyanidiaceae sp.
Schimmelmannia schousboei
Grateloupia taiwanensis Bangia fuscopurpurea
Apophlaea sinclairii
0.3
Rhodosorus marinus
Rhodella violacea Rhodella maculata
100 100
100
100 99 72 98
100
100 100
100 100
93 95
100
100
100 100 100
100 100
100 100
100 100
100 100
100 100
100 100 70
100 57
54
53 100
100
100
100
100 100 100
Fe
a
ec
y
h
p
o
e
dir
ol
Rhodellophyceae
Parallel events in plant plastid genome evolution
We found that plastid genome reduction and structural conservation characterized seed plants (angiosperms and gymnosperms). Based on a preliminary survey of struc-tural variation among the available 703 flowering plant (angiosperm) plastid genomes (see Additional file 1: Tables S5 and S6 and Additional file 4: Figures S6–S15), we chose 62 (46 orders and one un-ranked taxa) that included all orders in this angiosperm clade (sampling details are shown in “Methods”). In addition, 20 plastid genomes were sampled from other Viridiplantae lineages, including five gymnosperms (from 67 available), three pte-ridophytes (from 18 available), two bryophytes (from 12 available), five charophytes (from 11 available), and five green algae (from 58 available).
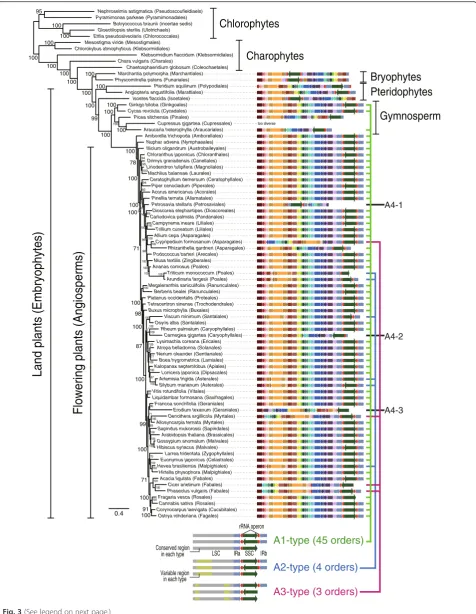
Structural variation in angiosperm plastid genomes was inferred using Ostrya rehderiana as the reference, due to its conserved, canonical architecture. The minor rearrangements we found in these genomes are shown in Fig. 3, which presents a ML tree made using a concatenated dataset of 77 plastid genes (Fig. 3, Additional file 1: Table S7, and Additional file 4: Figure S6). Green algal and charophyte plastid genomes were highly variable in architecture (Additional file 4: Figures S7 and S8).
In contrast, bryophyte, pteridophyte, gymnosperm, and angiosperm genomes showed high conservation (Additional file 4: Figures S9–S14). Within the flowering plants, three
major genome types (A1–A3; named for angiosperm
types) were identified, as well as several atypical cases (about 40 structural types were collectively denoted as the Rest-type), based on a comparison of the large single copy (LSC) and small single copy (SSC) regions and the direction and presence/absence of inverted repeats (IRs). The A1-type (49 species from 45 orders; Additional file 4: Figure S11) was most widespread in the phylogeny, with the A2-type (six species from four orders; Additional file 4: Figure S12), A3-type (four species from three or-ders; Additional file 4: Figure S13), and Rest-type (three species from three orders; Additional file 4: Figure S14) being sporadically distributed among taxa, as described above for Florideophyceae plastid genome types. Inver-sions of the entire SSC were present in all four types, together with the absence of the IR, but this was highly variable in the Rest-type (i.e., Petrosavia stellaris, Car-negiea gigantea, Erodium texanum, see Fig. 3). IR loss occurred in nine species of seed plants but only three cases also had inversion of the SSC (A1:Fragaria vesca; A2: Triticum monococcum; and A3: Cicer arietinum). (See figure on previous page.)
Fig. 1Red algal plastid genomes in the class Florideophyceae. In this synteny analysis of R1-type (seven orders), R2-type (10 orders), and R3-type (one order) structures, conserved color-schemes indicate a homologous plastid region except in the subclass Hildenbrandiophycidae, where synteny is not maintained, although the same color scheme applies. All of theredrectangular boxes indicate rDNA operons. Each color indicates a conserved genomic fragment. Under the tree, a simplified synteny image of the three different plastid genome types is shown in which thegray arrowsindicate conservation andgreen,blue, andpurplearrows indicate variable regions
Bangiophyceae
Florideophyceae
R3-type
R2-type R1-type
upp ycf52
ccs1 trpG thiG orf203 rps6 rDNAs* ycf27 psbD psbC ycf17 orf198 ycf37 rpl34 ycf46 chlN chlL rDNAs psaM chlI ycf63 ycf26 psbE
* * * * * * R1-type (1 sp.) R1-type (1 sp.) R1-type (6 sp.)
Reversible
R2-type (2 sp.) R2-type (1 sp.) R2-type (8 sp.)
R3-type (5 sp.) 3 inversions
2 inversions
3 inversions 1 inversion
(R1 - R2)
(R1 - R3)
(R2 - R3)
a
b
Atropa belladonna (Solanales)
Cupressus gigantea (Cupressales)
Gloeotilopsis sterilis (Ulotrichaels)
Dioscorea elephantipes (Dioscoreales)
Oenothera argillicola (Myrtales)
Arundinaria fargesii (Poales)
Euonymus japonicus (Celastrales)
Machilus balansae (Laurales)
Cicer arietinum (Fabales)
Botryococcus braunii (incertae sedis)
Marchantia polymorpha (Marchantiales)
Podococcus barteri (Arecales)
Osyris alba (Santalales)
Francoa sonchifolia (Geraniales)
Lonicera japonica (Dipsacales)
Ettlia pseudoalveolaris (Chlorococcales)
Hevea brasiliensis (Malpighiales)
Illicium oligandrum (Austrobaileyales)
Drimys granadensis (Canellales)
Cycas revoluta (Cycadales)
Platanus occidentalis (Proteales)
Nerium oleander (Gentianales)
Rheum palmatum (Caryophyllales)
Acacia ligulata (Fabales)
Triticum monococcum (Poales)
Berberis bealei (Ranunculales)
Gossypium anomalum (Malvales)
Nephroselmis astigmatica (Pseudoscoufieldiaels)
Araucaria heterophylla (Araucariales)
Chaetosphaeridium globosum (Coleochaetales)
Piper cenocladum (Piperales)
Angiopteris angustifolia (Marattiales)
Liquidambar formosana (Saxifragales)
Cypripedium formosanum (Asparagales)
Larrea tridentata (Zygophyllales)
Lysimachia coreana (Ericales)
Liriodendron tulipifera (Magnoliales)
Buxus microphylla (Buxales)
Chara vulgaris (Charales)
Petrosavia stellaris (Petrosaviales)
Physcomitrella patens (Funariales)
Phaseolus vulgaris (Fabales)
Ceratophyllum demersum (Ceratophyllales)
Trillium cuneatum (Liliales)
Megaleranthis saniculifolia (Ranunculales)
Artemisia frigida (Asterales)
Campynema ineare (Liliales)
Boea hygrometrica (Lamiales)
Ananas comosus (Poales)
Viscum minimum (Santalales)
Erodium texanum (Geraniales)
Hirtella physophora (Malpighiales)
Pyramimonas parkeae (Pyramimonadales)
Pinellia ternata (Alismatales)
Carludovica palmata (Pandanales)
Vitis rotundifolia (Vitales)
Chloranthus japonicus (Chloranthales)
Allium cepa (Asparagales)
Ostrya rehderiana (Fagales)
Fragaria vesca (Rosales)
Musa textilis (Zingiberales)
Pteridium aquilinum (Polypodiales)
Silybum marianum (Asterales)
Nuphar advena (Nymphaeales)
Tetracentron sinense (Trochodendrales)
Klebsormidium flaccidum (Klebsormidiales)
Allosyncarpia ternata (Myrtales)
Carnegiea gigantea (Caryophyllales)
Kalopanax septemlobus (Apiales)
Acorus americanus (Acorales)
Amborella trichopoda (Amborellales)
Rhizanthella gardneri (Asparagales)
Corynocarpus laevigata (Cucubitales)
Sapindus mukorossi (Sapindales)
Cannabis sativa (Rosales)
Ginkgo biloba (Ginkgoales)
Hibiscus syriacus (Malvales)
Arabidopsis thaliana (Brassicales)
Isoetes flaccida (Isoetales)
Picea sitchensis (Pinales)
0.4
Mesostigma viride (Mesostigmales)
Chlorokybus atmophyticus (Klebsormidiales)
95 100 100 100 100 100 100 100 100 100 100 99 100 100 100 100 100 100 100 78 100 71 94 95 100 94 60 99 100 100100 100 100 99 98 100 100 100 100 100 100 100 100 98 87 100 100 100 100 77 100 87 100 100 100 99 96 99 100 71 69 100 100 100 100 71 100 100 91 70 100 100 100 100 100
F)
s
mr
e
ps
oi
g
n
A(
st
n
al
p
g
nir
e
w
ol
L)
s
et
y
h
p
oy
r
b
m
E(
st
n
al
p
d
n
a
Chlorophytes
Charophytes
Bryophytes
Pteridophytes
Gymnosperm
A1-type (45 orders)
A2-type (4 orders)
A3-type (3 orders)
A4-1 A4-2 A4-3 rRNA operon Conserved region Variable region
LSC IRa SSC IRb
in each type
in each type
too diverse
This heterogeneity of IR-containing plastid genomes and subsequent loss of the IR through homologous recombin-ation (heteroplasmy, when present in individuals and pop-ulations) [44–53] appears to have occurred in both the red and green lineages (see Figs. 1 and 3). The frequency of IR degeneration is, however, different between plastid ge-nomes of most florideophycean species and flowering plants: ~80 % (19 out of 24) red algal plastid genomes lost one rDNA operon, whereas 2.5 % (18 out of 703) angiosperm species lost (or inactivated) the rDNA operon located in one IR region (437 A1-type, 181 A2-type, 28 A3-type, and 57 Rest-type) (Additional file 1: Table S5 and Additional file 4: Figures S11–S14).
Similar patterns of conserved genome architecture were found in other land plants, including gymnosperms, pteri-dophytes, and bryophytes (Additional file 4: Figures S9 and S10). For example, among the 67 gymnosperm plastid genomes, 18 different structural types were found includ-ing A1-type (14 species from the Cycadales, Araucariales, and Ginkgoales; Additional file 1: Table S6 and Additional file 4: Figure S10), which was the dominant form among angiosperms. About 4.4 % of gymnosperms (3 out of 67) have lost one IR region or it was pseudogenized. Among bryophytes (12 spp.) and pteridophytes (18 spp.), plastid genomes retain two IRs, and the genome architecture is highly conserved within each group (Additional file 4: Figure S9). In contrast, structural variation among chloro-phytes (58 spp.) and charochloro-phytes (11 spp.) was too exten-sive to identify a single pattern (Additional file 4: Figures S7 and S8). A similar high level of variation was found among three sexually reproducing colonial volvocine spe-cies [Gonium pectoral(Goniaceae), andPleodorina starrii and Volvox carteri (Volvocaceae)] (Additional file 4: Figure S15).
It is noteworthy that vastly different frequencies of IR loss were found among the two sister red and green lineages (i.e., 80 % in Florideophyceae versus 2.5 % in seed plants). These taxa have vastly different divergence times: that is, 781 million years ago (mya) for the major Florideophyceae and 318 mya for seed plants [54–57]. They also show different evolutionary trajectories: that is, the red lineage underwent degeneration of the IR re-gion of cyanobacterial origin, resulting in the retention of only one rDNA operon with two tRNAs (i.e., trnA andtrnI), whereas the green lineage underwent gradual expansion of the IR region (e.g., 38,398 bp in Plantago
media) from the ancestral IR gene set found in charo-phytes, bryocharo-phytes, and pteridophytes (trnN,tnrR,rrn5, rrn4.5,rrn23,trnA,trnI,rrn16, andtrnV) to the angio-sperms with the additional gene set (rps12-3,rps7, ndhB, trnL,ycf2,trnH,rpl23, andrpl2) (see details in [53]). Inter-estingly, seed plants contain whirly protein and organelle-to-nucleus crosstalk genes, and suppress short IR-derived illegitimate recombination in plastid genomes [58]. Red algae lack these features [59].
Among the highly variable R-types (i.e., 40 atypical cases from 57 species, see Additional file 4: Figure S14), the plastid genome architectures of the Geraniaceae (Ger-aniales) have been extensively studied [60–62]. Within the Geraniales, there are about 11 different types without any single one being a typical structure (i.e., A1–A3), although the sister taxa of the Geraniales show the A1-type (e.g., Francoa sonchifolia and Melianthus villosus) (Additional file 5: Figure S16). To better understand this exceptionally high structural variation, we compared each genome with the ancestral A1-type and noted the breakpoint distance (BD). For instance, structural changes to accommodate the A1- to A2-type require four BDs, whereas the A1- to A3-type change needs three BDs (Additional file 5: Figure S16). Within the Geraniaceae, five Pelargonium species have two to five BDs with respect to the A1-type, whereas 10Erodiumspecies have three to eight BDs. Interestingly, E. texanum shows higher variation (13 BDs) than other Erodium species (e.g., six BDs in the strongly supported sister speciesE. crassifolium). Moreover, sixErodium spe-cies (E. foetidum,E. rupestre,E. carvifolium,E. manescavi, E. reichardii, andE. trifolium) show degeneration of one of the rDNA operons, suggesting structural fixation after the loss of repeat sequences. In contrast, four independent cases of extensive structural rearrangements (higher than 10 BDs) were found within the Geraniaceae (green blocks in Additional file 5: Figure S16). This high level of architectural variation could be impacted by the repeat sequences (i.e., recombination sites) as suggested in previous studies with co-occurring high nucleotide sub-stitution rates [60–62]. Although it is not clear why and how this exceptionally high level of structural variation originated in the Geraniales, repeat sequences (i.e., du-plicated rDNA operons and IR regions) within the plas-tid genome could be one of the factors that contributed to this phenomenon, as observed in the red and green lineages.
(See figure on previous page.)
Plastid genome variation in red algal-derived secondary plastids
To test plastid genome conservation in other photosyn-thetic groups, we studied all available plastid genome data from red algal-derived plastid groups, including seven brown algae (Phaeophyceae, stramenopiles), 20 diatoms (Bacillariophyceae, stramenopiles), seven Eustigmatophyceae (including six Nannochloropsis spe-cies, stramenopiles), four haptophytes, and four crypto-phytes (Additional file 6: Figures S17–S21). Most of these plastid groups are poorly represented in public data-bases (e.g., seven Eustigmatophyceae, four haptophytes and cryptophytes); hence, it is difficult to reach a robust conclusion about their genome evolution. Nonetheless, we found relatively high genome conservation in brown and cryptophyte algae (Additional file 6: Figures S17 and S18). The brown algae show a rapid radiation and are a sexually reproducing, multicellular group [63] (2045 species; http://www.algaebase.org) with generally highly conserved plastid genome architectures among three orders (Add-itional file 6: Figure S17) [64, 65]. In contrast, diatoms show a relatively high amount of rearrangement among 13 orders (Additional file 6: Figure S19). Diatoms are a unicellular, sexual/asexual reproducing group, and underwent an explosive radiation that resulted in more than 200 genera and 100,000 extant species. In summary, analysis of red algal-derived plastid-containing groups shows that sexually reproducing, tissue-forming, multicellular lineages have stable plas-tid genome architectures.
Comparison of Rhodophyta and Viridiplantae plastids
In both cases of red and green plastid genomes, basal unicellular and filamentous algal groups showed high structural variation, whereas a highly conserved architec-ture originated in parallel in the multicellular Florideo-phyceae (i.e., three structural types) and in seed plants (i.e., three structural types). This observation led us to test whether any common features are shared by flori-deophyte and seed plant plastid genomes. In seed plants, genome size varied from 19 to 217 kbp (median = 153 kbp) with 18–273 proteins (median = 84 proteins) and 28–51 % GC-content (median = 37 %), with some exceptional cases including highly reduced plastid genomes of
non-photosynthetic plants (19 kbp in Epipogium roseum
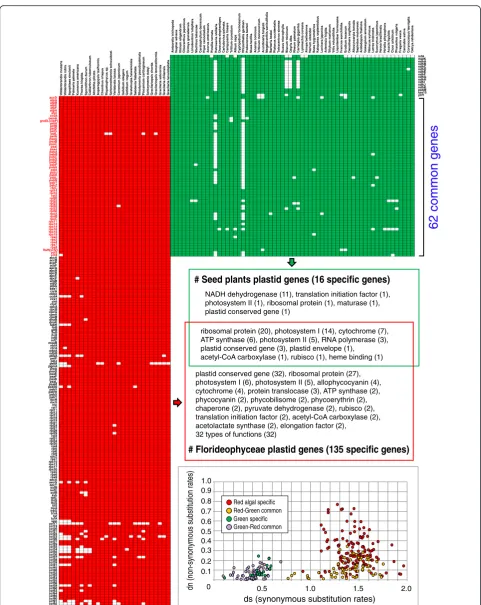
and 30 kbp inE. aphyllum), the biggest plastid genome size with a greatly expanded IR region (217 kbp in Pel-argonium x hortorum), and the largest gene number (273 genes including unclassified ORFs in Pinus kor-aiensis) (Additional file 7: Figure S22) [7, 66]. In contrast, Florideophyceae generally have larger genomes (91–194 kbp in size; median = 181 kbp) encoding 71–235 proteins (median = 202), and lower GC-contents (median = 29 %). These lineages share only 62 homologous genes,
including ribosomal proteins (20), photosystem-I (14), photosystem-II (5), cytochrome (7), and ATP synthase (6) (Fig. 4). However, 135 genes are present only in red algae, including conserved genes (32), ribosomal proteins (27), and several genes for pigments of allophycocyanin (4), phycocyanin (2), phycobilisomes (2), and phycoerythrin (2). Comparison of the rates of synonymous and non-synonymous substitution using the method of Nei and Gojobori [67] failed to show a correlation in values be-tween shared and non-shared genes, although seed plants had lower rates for both classes of change (Fig. 4). This result suggests that plastid genomes in the red and green lineages underwent differential gene loss after their split from a putative single common ancestor [68]. The puta-tive absence of organelle-to-nucleus crosstalk genes and whirly proteins [59] could in part explain the high gene content of red algal plastids (see also below). The shared and unique retained plastid genome sequences faced com-parable selective constraints. Differential plastid gene loss has been reported in another more recent example of primary plastid endosymbiosis in Paulinella species after acquisition of the organelle from a Synechococcus -Cyanobiumtype ofα-cyanobacterium [69].
Orthologous gene families in Archaeplastida
We did an orthologous gene family (OGF) analysis to determine how many plastid genes have been transferred to the nuclear genome via EGT. A total of 297 cyano-bacterial orthologous gene clusters were used to repre-sent the set of hypothetical ancestral OGFs. Using 3587 Archaeplastida plastid genes as the query, we found 329,972 cyanobacterial homologs (in 99 strains; Additional file 1: Tables S8 and S9). Using a parsimony approach (Additional file 1: Table S10), the history of gene retention and loss was reconstructed on the Archaeplastida plastid genome phylogeny (see “Methods” and Additional file 8: Figure S23). This analysis showed that 223 OGFs were retained in red algal plastid genomes, whereas 204 OGFs were putatively present in the ancestral plastid genome of the glaucophyte plus green lineage (Fig. 5a). Although similar numbers of OGFs (i.e., 223 versus 204) were retained in the red algal and glaucophyte– green ancestors, these two ancestral lineages shared only 130 OGFs. Glaucophytes (125) and green plants (150) shared 71 plastid OGFs (Fig. 5a). The primordial red algal plastid contained more OGFs [retained 223 (75 %), lost 74] than the glaucophyte [retained 125 (42 %), lost 172] or green ancestor [retained 150 (50 %), lost 147], suggesting extensive differential (and parallel) gene losses after the diversification of each lineage.
accD atpA atpB atpE atpF atpH atpI ccsA cemA groEL(clpP) petA petB petD petG petL petN psaA psaB psaC psaI psaJ psbA psbB psbC psbD psbE psbF psbH psbI psbJ psbK psbL psbN psbT psbZ rbcL rpl14 rpl16 rpl2 rpl20 rpl22 rpl23 rpl32 rpl33 rpl36 rpoA rpoB rpoC rps11 rps12 rps14 rps16 rps18 rps19 rps2 rps3 rps4 rps7 rps8 ftsH(ycf2) ycf3 ycf4 accA accB acpP acsF apcA apcB apcD apcE apcF argB atpD atpG bas1 carA cbbX ccdA ccs1 chlI clpC cpcA cpcB cpcG cpeA cpeB dnaB dnaK fabH ftrB gltB ilvB ilvH infB infC moeB nblA ntcA odpA odpB pbsA petF petJ petM pgmA preA psaD psaE psaF psaK psaL psaM psb30 psbV psbW psbX psbY rbcR rbcS rne rpl1 rpl11 rpl12 rpl13 rpl18 rpl19 rpl21 rpl24 rpl27 rpl28 rpl29 rpl3 rpl31 rpl34 rpl35 rpl4 rpl5 rpl6 rpl9 rpoZ rps1 rps10 rps13 rps17 rps20 rps5 rps6 rps9 secA secG secY sufB sufC syfB syh tatC thiG thiS tilS trpA trpG trxA tsf tufA upp ycf17 ycf19 ycf20 ycf21 ycf22 ycf23 ycf26 ycf27 ycf29 ycf33 ycf34 ycf35 ycf36 ycf37 ycf38 ycf39 ycf41 ycf45 ycf46 ycf52 ycf53 ycf54 ycf55 ycf56 ycf58 ycf60 ycf63 ycf64 ycf65 ycf80 ycf91 ycf92
# Florideophyceae plastid genes (135 specific genes) # Seed plants plastid genes (16 specific genes)
NADH dehydrogenase (11), translation initiation factor (1), photosystem II (1), ribosomal protein (1), maturase (1), plastid conserved gene (1)
ribosomal protein (20), photosystem I (14), cytochrome (7), ATP synthase (6), photosystem II (5), RNA polymerase (3), plastid conserved gene (3), plastid envelope (1), acetyl-CoA carboxylase (1), rubisco (1), heme binding (1)
plastid conserved gene (32), ribosomal protein (27), photosystem I (6), photosystem II (5), allophycocyanin (4), cytochrome (4), protein translocase (3), ATP synthase (2), phycocyanin (2), phycobilisome (2), phycoerythrin (2), chaperone (2), pyruvate dehydrogenase (2), rubisco (2), translation initiation factor (2), acetyl-CoA carboxylase (2), acetolactate synthase (2), elongation factor (2),
32 types of functions (32)
Hildenbrandia rivularis infA matK ndhA ndhB ndhC ndhD ndhE ndhF ndhG ndhH ndhI ndhJ ndhK psbM rps15 ycf1
62 common
g
enes
Hildenbrandia rubra Apophlaea sinclairiiPalmaria palmata Kumanoa americana Thorea hispida Sporolithon durum Calliarthron tuberculosum Ahnfeltia plicata Asparagopsis taxiformis Chondrus crispus Riquetophycus
sp.
Schimmelmannia schousboeiVertebrata lanosa Ceramium japonicum Gelidium elegans Gelidium vagum Grateloupia taiwanensis Sebdenia flabellata Rhodymenia pseudopalmata Plocamium cartilagineum Schizymenia dubyi Gracilariopsis chorda Gracilariopsis lemaneiformis Gracilaria salicornia Gracilaria chilensis Gracilaria tenuistipitata
Amborella trichopodaNuphar advena Illicium oligandrum Chloranthus japonicus Drimys granadensis Liriodendron tulipifera Machilus balansae Ceratophyllum demersum Piper cenocladum Acorus americanus Pinellia ternata Petrosavia stellarisDioscorea elephantipes Carludovica palmata Campynema lineare Trillium cuneatum Allium cepa Cypripedium formosanum Rhizanthella gardneriPodococcus barteri Musa textilis Ananas comosusTriticum monococcum Arundinaria fargesiiMegaleranthis saniculifoli
a
Berberis bealei Platanus occidentalis Tetracentron sinense Buxus microphylla Biscum minimum Osyris alba Rheum palmatumCarnegiea gigantea Lysimachia coreana Atropa belladonnaNerium oleander Boea hygrometricaKalopanax septemlobus Lonicera japonica Artemisia frigidaSilybum marianum Vitis rotundifolia Liquidambar formosana Francoa sonchifolia Erodium texanum Oenothera argillicola Allosyncarpia ternataSapindus mukorossi Arabidopsis thaliana Gossypium anomalum Hibiscus syriacus Larrea tridentata Euonymus japonicusHevea brasiliensis Hirtella physophora Acacia ligulata Cicer arietinum Phaseolus vulgaris Fragaria vesca Cannabis sativa Corynocarpus laevigata Ostrya rehderiana
0 0.5 1.0 1.5 2.0
0.1 0.2 0.3 0.4 0.5 0.6 0.7 0.8 0.9 1.0
dn (non-synonymous substitution rates)
ds (synonymous substitution rates) Red-Green common
Red algal specific
Green-Red common Green specific
A total of 956 plastid-derived genes were identified in the nuclear genomes of green plants (886 genes; 76 OGFs, and one plastid OGF-duplicated copy in the nucleus), glaucophytes (48 genes; 33 OGFs), and red algae (22 genes; five OGFs) (Additional file 1: Tables S11 and S12). Among 93 gene families that were lost in the ancestor of the greens and glaucophytes, 23 EGTs were found in both lineages, in addition to five Glaucophyte-specific and 20 Viridiplantae-specific EGTs (Fig. 5b). A total of 79 differ-ential gene family losses followed by five EGTs were iden-tified in the glaucophytes, whereas 54 gene family losses and 33 EGTs were found in Viridiplantae. Therefore, 25 % (76 OGFs) of Viridiplantae and 11 % (33 OGFs) of glauco-phyte gene families were transferred to the nuclear ge-nomes in these taxa, whereas only five EGTs (1 %) from 74 lost gene families in red algal plastids were identified as nuclear copies (Fig. 5b). Interestingly, the total number of plastid-associated genes, including those encoded on the plastid genome and those transferred to the nucleus in red algae (228 OGFs) and green plants (226 OGFs) are com-parable with 162 (127 + 35 in Fig. 5c) shared OGFs. The three primary plastid lineages share 127 OGFs (Fig. 5c), not only present in plastid genomes but also in nuclear DNA (number of EGT in each lineage = colored number in Fig. 5c; details in Additional file 1: Table S13). These results demonstrate different rates of EGT in Archae-plastida; that is, more frequent in green plants and glaucophytes and less frequent in red algae (Fig. 5 and Additional file 1: Table S11).
To explain the observed patterns of gene conservation and EGT, Barbrook et al. [70] proposed the“limited trans-fer window hypothesis” based on the finding of higher EGT frequencies in the multiple plastid-containing cells of land plants than in the single plastid-bearing Chlamydo-monas. These authors hypothesized that EGTs are limited when the host cell converges to a single endosymbiont (plastid). This happened after the integration of cell div-ision genes from lysed endosymbiont DNAs, which were initially multiple in number, because the host cell could not control their division. This reduction in plastid num-ber effectively closed the gene transfer window because lysis of a single plastid would be lethal to the host cell. It is noteworthy that there are significant gene losses (i.e., 93 in glaucophytes plus greens; 79 in the glaucophytes; 54 in green plants; 74 in red alga) and high numbers of EGTs (i.e., 28 out of 33 in the glaucophytes; 43 out of 76 in green plants) during the early evolution of these lineages
(Fig. 5a). It is therefore possible that the ancestor of the glaucophyte/green lineage contained multiple plastids, such as Cyanophora sudae (two to eight plastids, with generally four per cell [71]), so that frequent EGTs leading to the plastid genome would have been possible. In con-trast, most of the early-diverged red algae, including the Cyanidiophyceae, contain a single plastid [72]. This could have suppressed EGTs during their evolution, according to the Barbrook et al. [70] hypothesis.
In contrast, the “nuclear genome reduction hypoth-esis” [73] provides an alternative explanation for the observation of large red algal plastid genomes. Current data suggest that there was a phase of massive genome reduction in the ancestor of red algae that resulted in 5331–9606 nuclear-encoded proteins in extant taxa with very little EGT from the plastid. The pressure for gene loss in the nucleus could explain the lower success rate of EGT, resulting in a high number of plastid genes (average = 202 proteins) being maintained to support or-ganelle functions. The opposite evolutionary trajectory is observed in the green lineage, which shows expanded nuclear gene inventories (7367–37,109 genes) with high EGT rates (25 %), and, thereby, significant plastid gene loss (average = 84 proteins).
Conclusions
Analysis of plastid genomes spanning over 1 billion years of Archaeplastida evolution demonstrates that the flori-deophycean (non-Hildenbrandiophycidae) and seed plant (angiosperm and gymnosperm) lineages have highly con-served genome architectures that have arisen independ-ently in each lineage. This conservation is correlated with the emergence of novel, sexual reproductive structures: carpospore development in Florideophyceae, and seed de-velopment in angiosperms and gymnosperms. As a conse-quence of, or coincident with, these independent rapid radiations, plastid genome architecture was stabilized in the majority of Florideophyceae and seed plant species (Figs. 1 and 3). The carpospore is part of the unique tri-phasic life cycle (haploid gametophyte, diploid carpospor-ophyte, and diploid tetrasporophyte) that is present in non-hildenbrandiophycidan Florideophyceae. Evolution of the carposporophyte that develops on the female gameto-phyte led to the production of hundreds of carpospores via post-fertilization development of diploid gonimoblast filaments. This strategy is thought to compensate for inef-ficient fertilization due to the absence of motile gametes (See figure on previous page.)
in these attached seaweeds (as in all Rhodophyta) [74]. This innovation likely played a central role in the success and radiation of florideophytes, which account for 95 % of
red algal species (Nemaliophycidae 921 spp., Corallino-phycidae 772 spp., AhnfeltioCorallino-phycidae 11 spp., and Rhody-meniophycidae 5009 spp.; http://www.algaebase.org). Seed
Glaucophytes
Green algae Charophytes Bryophytes Pteridophytes Gymnosperms Angiosperms
Cyanidiophyceae
Porphyridiophyceae
Stylonematophyceae
Rhodellophyceae
Bangiophyceae
Hildenbrandiophycidae
Nemaliophycidae
Corallinophycidae
Ahnfeltiophycidae
Rhodymeniophycidae
Cyanobacterial genomes (329,972 genes)
125 OGF (143 / 149 genes)
115 OGF (4,477 / 4,823 genes) 111 OGF (1,006 / 1,084 genes)
85 OGF (879 / 901 genes) 84 OGF (1,458 / 1,511 genes) 92 OGF (5,033 / 5,471 genes) 86 OGF (56,520 / 57,798 genes)
186 OGF (729 / 801 genes) 163 OGF (366 / 415 genes) 170 OGF (389 / 397 genes) 153 OGF (398 / 416 genes)
188 OGF (1,828 / 1,886 genes) 174 OGF (554 / 563 genes) 186 OGF (580 / 595 genes) 184 OGF (390 / 403 genes) 185 OGF (202 / 205 genes) 195 OGF (3,575 / 3,666 genes)
150 137
111 109
104 -35
-26 -26
-25 -12 -18 -13
-26 -2
-5
203 -2
-15
201 200
199 195 -2
-1 -27
-14
-1 -4 -15
-10
Florideophyceae
(5,301 / 5,432 genes)
-54
Rhodophyta
Viridiplantae
Glaucophyta
-93 / +23
-54 / +33
-74 / +5 -79 / +5
297 OGF
+20
+5 PT: 125 (42%), Nu: 33 (11%)
PT: 150 (50%), Nu: 76 (25%), PT duplicated copy in Nu: 1
PT: 223 (75%), Nu: 5 (1%)
Hypothetical ancestral Orthologous Gene Families (OGF)
a
b
c
Glaucophyta
Rhodophyta
Viridiplantae
45 5
127 21 5
59
35 (5)
(0)
(27)
(0) (1)
(4)
(1)
(57)
(20)
: Gene family loss from plastid genome
+ : Gene family transfer to nucleus genome (EGT)
-Carpospore development
Seed development
Compsopogonophyceae 174 OGF (381 / 392 genes)
205
common 71 OGF
-37
205 -18 -79
297 OGF
(3,587 genes)
common 130 OGF
204 -93
223 -74
EGT
-42
178 -27
205 -35
-25 -4
plants also exploited novel reproductive strategies to survive in dry (and other stressful) terrestrial conditions. These innovations resulted in seed plants accounting for ~85 % (gymnosperms and angiosperms) of plant species (305,523 species: http://www.theplantlist.org).
Carpospores are estimated to have evolved ~781 mya [54], at the time of the split of Hildenbrandiophycidae from other Florideophyceae. During three periods of glo-bal glaciation in the Neoproterozoic era (850–635 mya), the ancestor of Florideophyceae diverged into four red algal subclasses (i.e., 6713 currently recognized species). In contrast, the split time of seed plants is calculated to be ~318 mya [55–57]. Despite the widely different time frames for these events, these complex multicellular and sexually reproducing macrophytes radiated rapidly with the aid of specialized propagation mechanisms (i.e., carpo-spores and seeds). The explosive diversification of these photosynthetic groups led to highly conserved plastid gen-ome structures in both the red and green plant lineages. Because the plastid is maternally inherited, rapid diversifi-cation would lead to conserved organelle genome architec-ture among closely related taxa. These conserved plastid genomes, however, underwent recombination, aided by duplicated rDNAs or IR regions that resulted in gen-omic rearrangements. These evolutionary developments could have been adaptive, as found in asexual lineages [75]. In this regard, it has been found that asexuality of scale insects is more common in species with a larger population density and geographic distribution [76]. It is also possible that the evolution of sophisticated retrograde signaling pathways (yet poorly understood in red seaweeds) between the organelle and the nucleus during development [77, 78] could have constrained these conserved plastid genome architectures.
Methods
Strain information
Thalli from nine red algal species [Apophlaea sinclairii Hooker fils & Harvey, Ahnfeltia plicata (Hudson) Fries, Riquetophycussp.,Schimmelmannia schousboei(J. Agardh)
J. Agardh, Ceramium japonicum Okamura, Sebdenia
flabellata(J. Agardh) P. G. Parkinson, Plocamium car-tilagineum (Linnaeus) P. S. Dixon, Schizymenia dubyi (Chauvin ex Duby) J. Agardh, andGracilariopsis chorda (Holmes) Ohmi] were collected from nature and dried with silica-gel. Tissue samples of 11 red algal species [Porphyridium sordidum Geitler CCAP 1380, Bangiopsis subsimplex(Montagne) F. Schmitz UTEX 2854,Rhodosorus marinusGeitler CCMP769,Rhodella violacea(Kornmann)
Wehrmeyer CCMP 3129, Rhodella maculata L. V. Evans
CCMP 736, Erythrotrichia carnea (Dillwyn) J. Agardh
CCMP 3225, Rhodochaete parvula Thuret ex Bornet
CCMP 3232, Hildenbrandia rivularis (Liebmann) J.
Agardh UTEX 2622,Hildenbrandia rubra(Sommerfelt)
Meneghini UTEX 2621, Asparagopsis taxiformis (Delile) Trevis. CCAP 1341/1, andRhodymenia pseudopalmata(J. V. Lamour) P. C. Silva UTEX LB1418] were derived from culture collections (Additional file 1: Table S14).
Genome sequencing, assembly, gene prediction, and annotation
Genomic DNA was extracted from the target species using the DNeasy Plant Mini Kit (Qiagen, Hilden, Germany). NGS was done using the Ion Torrent PGM platform (Life Technologies, San Francisco, CA, USA). The Ion Xpress Plus gDNA Fragment Library Kit (Life Technologies) was used for 200 bp or 400 bp-sized sequencing library prepar-ation. Genome sequencing was done with the Ion PGM Template OT2 200 or 400 Kit and Ion PGM Sequencing 200 or 400 Kit (Life Technologies). The raw sequence reads were assembled using the CLC Genomics Workbench 5.5.1 (CLC Bio, Aarhus, Denmark) and the MIRA assem-bler (from Ion Server). Plastid genome-related contigs were sorted by customized Python scripts with local BLAST programs compared with references, and the sorted contigs were re-assembled to construct consensus plastid genomes. Initial consensus plastid genomes were confirmed with the read-mapping method using CLC Genomics Workbench 5.5.1 and gaps were filled with PCR.
Putative ORFs in the plastid genome data were pre-dicted using ORF Finder in Geneious 8.1.2 [79], custom-ized Python scripts, and BLASTx tool (e-value≤1.0e−05) with codon table 11 (Bacterial, Archaeal, and Plant Plas-tid Code). Ribosomal DNAs and transfer RNAs were predicted using the RNAmmer 1.2 Server [80], and the ARAGORN program [81]. All introns were identified using the web-based program RNAweasel (http://www.theplan-tlist.org) [82–86].
Gene clustering of orthologous plastid gene families and phylogenetic analysis
combined rpoC gene. After several iterations, 191 red algal plastid gene families were chosen for analysis (Additional file 1: Table S4). This clustering method was adapted to the green lineage and 77 green plastid gene families were chosen (Additional file 1: Table S7).
The 60 conserved plastid genes from the three pri-mary plastid groups and cyanobacterial homologs were used to reconstruct a ML phylogeny (Additional file 1: Tables S15 and S16). This tree topology provided the framework for the analysis of primary plastid gene re-tention, loss, or transfer to the nucleus (Additional file 8: Figure S23). One difference between the primary plastid phylogeny and the green plant-specific ML tree (Figs. 1 and 3) was the position of the monophyletic charophyte algaeMesostigmaandChlorokybusthat was located basal to green plants. This incongruence has been previously discussed [87].
All intronic ORFs of thetrnMe tRNA in the Florideo-phyceae were grouped with their homologs (top match 30 genes), and searched by BLASTp (e-value≤e−05) using the nr database (NCBI) and our local database (red algal plastid genes). The collected plastid coding genes were used for multigene phylogenetic analysis. Each clustered gene set was aligned using MAFFT 7.110 under default settings [88]. All of the alignments were concatenated for the phylogenetic analysis. To construct the tree, phylogen-etic models were tested (-m TEST), and the ML tree search and their bootstrap analysis were done using the IQ tree program with 1000 replications (-bb 1000) [89–91].
To test the inferred tree topology, we conducted the tree topology test using CONSEL [41]. We first built a ML tree excluding R3-type species with 1000 bootstrap replicates with IQ tree. Based on this ML tree, we tested the hypothetical tree topology that R1- and R2-types form monophyletic groups, and excluded the R3-type. From CONSEL, the result was generated using 10,000 bootstrap replicates. Statistical support was calculated with the AU test [42].
Comparison of structural variation in plastid genomes
To compare plastid genome architectures from a taxo-nomically broadly sampled collection of taxa, all available plastid genomes in the red and green lineages were aligned and plotted using the MUMmerplot package [40]. Excluding a parasitic red algal plastid genome, the struc-tural variation of 45 red algal complete plastid genomes was analyzed. A total of 869 green plastid genomes were used for this analysis. In the 703 angiosperm plas-tid genomes, similar plasplas-tid genome architectures were categorized into three major three (A1–A3-type) and the remainder were put in Rest-type based on the plotting result (Additional file 4: Figures S11–S14). The A1-type was the most common type of angiosperm plastid gen-ome. Except highly diverse plastid genome architectures
contained green algae (58 spp.) and charophytes (11 spp.), four major representative types of plastid genomes in other groups [gymnosperms (67 spp.), pteridophytes (18 spp.), bryophytes (12 spp.), and charophytes (11 spp.)] were chosen for the futher structural and phylogenetic analyses (Additional file 4: Figures S7–S10). Structural comparison of plastid genomes was done using MAUVE 2.3.1 [92] under “default options.” Synteny of plastid genes was assessed manually based on the results of the MAUVE alignment. BDs were calculated based on MAUVE com-parison using the DCJ analysis tool in the Geneious 8.1.2 [79].
Orthologous gene family analysis
A total of 329,972 genes were sampled from 99 cyano-bacterial strains (NCBI genome database) (Additional file 1: Table S8). A total of 81,476 primary plastid genes (149 genes from one glaucophyte, 71,558 genes from 868 green plants, and 9739 genes from 48 red algae; Additional file 1: Tables S17 and S18) were searched using BLASTp (e-value≤1.0e−05) against the local cyano-bacterial database. An analysis using customized Python scripts with a BLASTp search (e-value 1.0e−10) (Additional file 1: Table S9) found that a total of 297 OGFs clustered from 3587 cyanobacterial homologs were shared between cyanobacteria and primary plastid genomes, but 2568 se-quences were of an unknown-origin. Based on the 297 OGFs including 78,908 sequences, a parsimonious evolu-tionary scheme for gene families was calculated (Fig. 5 and Additional file 1: Table S10). The OGF total of 80,849 primary plastid genes was predicted using BLASTp (e-value≤1.0e−05) based on the ancestral 297 OGFs and the classified plastid genes that were used to find second-ary (indirect) relationships from non-predicted primsecond-ary plastid genes using a BLASTp search (e-value≤e−10). From a total of 78,908 primary plastid genes including 2568 indirect relationships genes, OGF groups were pre-dicted. Parsimonious gene family evolution was analyzed and the result was included in the simplified tree (Fig. 5 and Additional file 1: Table S10). For instance,
149 plastid genes in the glaucophyte Cyanophora
paradoxa included 143 cyanobacterial homologs that clustered into 125 OGFs, and six of unknown or non-EGT origin (Fig. 5a).
results, the top five hits in each taxonomic group were combined and aligned using MAFFT 7.110 under default settings [88]. All of these alignments were analyzed using IQ tree (model test: -m TEST and replications: -bb 1000) [89–91] and used only the cyanobacterial-origin ML tree to plot EGT information (Fig. 5b, c).
Additional files
Additional file 1: Table S1.Gene compositions of red algal plastid genomes.Table S2.Representative homologous gene sets of red algal plastid genes.Table S3.Intron prediction of plastid intronic proteins in five basal red algal taxa.Tables S4, S7, and S15.List of concatenated proteins used in the ML tree searches.Tables S5 and S6.Types of angiosperm and gymnosperm plastid genomes.Tables S8 and S9.
Taxon sampling of cyanobacterial genomes and their gene groups.
Table S10.Predicted primary plastid orthologous gene families compared with cyanobacterial 297 OGF.Table S11.Predicted nuclear-encoded OGFs in the primary plastid groups.Table S12.EGT trees information.Table S13.Composition of OGFs in the primary plastid groups.Table S14.Sample and strain information.Table S16.Cyanobacterial proteins from four strains used in the primary plastid ML tree.Table S17.
Taxon sampling of primary plastid groups in orthologous family analysis.Table S18.Number of species and genes in OGF analysis.
Table S19.Taxon samples and their genes in the primary endosymbiosis groups. (XLSX 2166 kb)
Additional file 2: Figure S1.ML tree made using homologous genes based on intronic ORF oftrnMe tRNA in Florideophyceae. (PDF 131 kb)
Additional file 3: Figure S2.ML tree built using aligned 191 concatenated proteins from 48 red algal plastid genomes.Figure S3.
Structural comparison of red algal plastid genomes based on MUMmerplot result.Figure S4.Structural comparison of plastid genomes from four Cyanidiophyceae species based on MAUVE alignment result.Figure S5.
Structural comparison of plastid genomes in three basal red algal groups. (PDF 1955 kb)
Additional file 4: Figure S6.Structural comparison of green lineage plastid genomes based on MUMmerplot result.Figures S7–S15.Types of green lineage (angiosperm, gymnosperm, bryophytes, pteridophytes, green algae, charophytes and volvocine algae) plastid genomes from MUMmerplot. (PDF 1201 kb)
Additional file 5: Figure S16.Structural comparison of Geraniales plastid genomes based on MUMmerplot. (PDF 198 kb)
Additional file 6: Figure S17.Structural comparison of brown lineage plastid genomes based on MUMmerplot.Figure S18.Structural comparison of cryptophyte plastid genomes based on MUMmerplot.
Figure S19.Structural comparison of diatom lineage plastid genomes based on MUMmerplot.Figure S20.Structural comparison of Eustigmatophyceae plastid genomes based on MUMmerplot.Figure S21.
Structural comparison of haptophytes plastid genomes based on MUMmerplot. (PDF 503 kb)
Additional file 7: Figure S22.Box plots (standard deviation) of 770 seed plants and 24 red algal plastid genomes. (PDF 70 kb)
Additional file 8: Figure S23.ML tree based on concatenated 60 plastid genes from Archaeplastida and their cyanobacterial homologs. (PDF 106 kb)
Acknowledgements
The authors would like to thank Suzanne Fredericq and Wendy A. Nelson for providing algal tissues. We are grateful to Eun Chan Yang, Kyeong Mi Kim, and Hae Jung Song for technical assistance with genome sequencing.
Funding
This study was supported by the Global Ph.D. Fellowship (GPF) Program from the National Research Foundation of Korea (NRF), funded by the Ministry of Education (2013–034853) of Korea to JML, and NRF (MEST:
2014R1A2A2A01003588), the Marine Biotechnology Program (PJT200620) funded by Ministry of Oceans and Fisheries of Korea, and the Next-generation BioGreen21 program (PJ011121) of Rural Development Administration of Korea to HSY.
Availability of data and materials
All plastid genome sequences have been deposited as GenBank under accession numbers [GenBank: KX284709–KX284728] (shown in Additional file 1: Table S1).
Authors’contributions
JML and HSY collected samples from the field and JAW contributed algal culture samples. JML produced the genome sequencing. JML led the plastid genome assembly and genome prediction, and wrote the manuscript. CHC, SIP, JWC, and HSS supported the plastid genome analyses. HSY and DB contributed to designing the work, interpreting the results, and editing the manuscript. All authors discussed the results and commented on the manuscript. All authors read and approved the final manuscript.
Competing interests
The authors declare that they have no competing interests.
Author details
1Department of Biological Sciences, Sungkyunkwan University, Suwon 16419,
Republic of Korea.2School of Biosciences 2, University of Melbourne,
Parkville, VIC 3010, Australia.3Department of Ecology, Evolution and Natural
Resources, Rutgers University, New Brunswick, NJ 08901, USA.
Received: 6 June 2016 Accepted: 17 August 2016
References
1. Bhattacharya D, Yoon HS, Hackett JD. Photosynthetic eukaryotes unite: endosymbiosis connects the dots. BioEssays. 2004;26(1):50–60.
2. Cavalier-Smith T. Membrane heredity and early chloroplast evolution. Trends Plant Sci. 2000;5(4):174–82.
3. Rodríguez-Ezpeleta N, Brinkmann H, Burey SC, Roure B, Burger G, Löffelhardt W, et al. Monophyly of primary photosynthetic eukaryotes: green plants, red algae, and glaucophytes. Curr Biol. 2005;15(14):1325–30.
4. Larkum AW, Lockhart PJ, Howe CJ. Shopping for plastids. Trends Plant Sci. 2007;12(5):189–95.
5. Muller HJ. Some genetic aspects of sex. Am Nat. 1932;66(703):118–38. 6. Salomaki ED, Nickles KR, Lane CE. The ghost plastid ofChoreocolax
polysiphoniae. J Phycol. 2015;51(2):217–21.
7. Schelkunov MI, Shtratnikova VY, Nuraliev MS, Selosse MA, Penin AA, Logacheva MD. Exploring the limits for reduction of plastid genomes: a case study of the mycoheterotrophic orchidsEpipogium aphyllumand Epipogium roseum. Genome Biol Evol. 2015;7(4):1179–91.
8. Martin W, Rujan T, Richly E, Hansen A, Cornelsen S, Lins T, et al. Evolutionary analysis ofArabidopsis, cyanobacterial, and chloroplast genomes reveals plastid phylogeny and thousands of cyanobacterial genes in the nucleus. Proc Natl Acad Sci U S A. 2002;99(19):12246–51.
9. Timmis JN, Ayliffe MA, Huang CY, Martin W. Endosymbiotic gene transfer: organelle genomes forge eukaryotic chromosomes. Genetics. 2004;5(2):123–35. 10. Richardson AO, Palmer JD. Horizontal gene transfer in plants. J Exp Bot.
2007;58(1):1–9.
11. Keeling PJ, Palmer JD. Horizontal gene transfer in eukaryotic evolution. Nat Rev Genet. 2008;9(8):605–18.
12. Keeling PJ. Diversity and evolutionary history of plastids and their hosts. Am J Bot. 2004;91(10):1481–93.
13. Keeling PJ, Burget G, Durnford DG, Lang BF, Lee RW, Pearlman RE, et al. The tree of eukaryotes. Trends Ecol Evol. 2005;20(12):670–6.
14. Keeling PJ. The endosymbiotic origin, diversification and fate of plastids. Phil Trans R Soc B. 2010;265(1541):729–48.
15. Reith M, Munholland J. Complete nucleotide sequence of thePorphyra purpureachloroplast genome. Plant Mol Biol Rep. 1995;13(4):333–5. 16. Glöckner G, Rosenthal A, Valentin K. The structure and gene repertoire of an
ancient red algal plastid genome. J Mol Evol. 2000;51(4):382–90. 17. Ohta N, Matsuzaki M, Misumi O, Miyagishima S, Nozaki H, Tanaka K, et al.
18. Hagopian JC, Reis M, Kitajima JP, Bhattacharya D, de Oliveira MC. Comparative analysis of the complete plastid genome sequence of the red algaGracilaria tenuistipitatavar.liuiprovides insights into the evolution of rhodoplasts and their relationship to other plastid. J Mol Evol. 2004;59(4):464–77.
19. Collén J, Porcel B, Carré W, Ball SG, Chaparro C, Tonon T, et al. Genome structure and metabolic features in the red seaweedChondrus crispus shed light on evolution of the Archaeplastida. Proc Natl Acad Sci U S A. 2013;110(13):5247–52.
20. DePriest MS, Bhattacharya D, López-Bautista JM. The plastid genome of the red macroalgaGrateloupia taiwanensis(Halymeniaceae). PLoS One. 2013;8(7):e68246.
21. Janouškovec J, Liu SL, Martone PT, Carré W, Leblanc C, Collén J, et al. Evolution of red algal plastid genome: ancient architectures, introns, horizontal gene transfer, and taxonomic utility of plastid markers. PLoS One. 2013;8(3):e59001.
22. Wang L, Mao Y, Kong F, Li G, Ma F, Zhang B, et al. Complete sequence and analysis of plastid genomes of two economically important red algae: Pyropia haitanensisandPyropia yezoensis. PLoS One. 2013;8(5):e65902. 23. Campbell MA, Presting G, Bennett MS, Sherwood AR. Highly conserved
organellar genomes in the Gracilariales as inferred using new data from the Hawaiian invasive algaGracilaria salicornia(Rhodophyta). Phycologia. 2014;53(2):109–16.
24. Hughey JR, Gabrielson PW, Tohmer L, Tortolani J, Silva M, Miller KA, et al. Minimally destructive sampling of type specimens ofPyropia(Bangiales, Rhodophyta) recovers complete plastid and mitochondrial genomes. Sci Rep. 2014;4:5113.
25. Tajima N, Sato S, Maruyama F, Kurokawa K, Ohta H, Tabata S, et al. Analysis of the complete plastid genome of the unicellular red algaPorphyridium purpureum. J Plant Res. 2014;127(3):389–97.
26. Jain K, Krause K, Grewe F, Nelson GF, Weber APM, Chriatenaen AC, et al. Extreme features of theGaldieria sulphurariaorganellar genomes: a consequence of polyextremophily? Genome Biol Evol. 2015;7(1):367–80. 27. Lee JM, Kim KM, Yang EC, Miller KA, Boo SM, Bhattacharya D, et al.
Reconstructing the complex evolutionary history of mobile plasmids in red algal genomes. Sci Rep. 2016;6:23744.
28. Lemieux C, Otis C, Turmel M. Chloroplast phylogenomic analysis resolves deep-level relationships within the green algal class Trebouxiophyceae. BMC Evol Biol. 2014;14(1):211.
29. Ruhfel BR, Gitzendanner MA, Soltis PS, Solits DE, Burleigh JG. From algae to angiosperms-inferring the phylogeny of green plants (Viridiplantae) from 360 plastid genomes. BMC Evol Biol. 2014;14(1):23.
30. Leliaert F, Tronholm A, Lemieux C, Turmel M, DePriest MS, Bhattacharya D, et al. Chloroplast phylogenomic analyses reveal the deepest-branching lineage of the Chlorophyta, Palmophyllophyceae class. nov. Sci Rep. 2016;6:25367.
31. Palmer JD, Delwiche CF. The origin and evolution of plastids and their genomes. In: Soltis DE, Soltis PS, Doyle JJ, editors. Molecular systematic of plants II: DNA sequencing. New York: Springer; 1998. p. 375–409. 32. Bancroft I, Wolk CP, Oren EV. Physical and genetic maps of the genome
of the heterocyst-forming cyanobacteriumAnabaenasp. strain PCC7120. J Bacteriol. 1989;171(11):5940–8.
33. Chen X, Widger WR. Physical genome map of the unicellular cyanobacterium Synechococcussp. strain PCC7002. J Bacteriol. 1993;175(16):5106–16. 34. Kaneko T, Sato S, Kotani H, Tanaka A, Asamizu E, Nakamura Y, et al.
Sequence analysis of the genome of the unicellular cyanobacterium Synechocystissp. strain PCC6803. II. Sequence determination of the entire genome and assignment of potential protein-coding regions. DNA Res. 1996;3(3):109–36.
35. Yoon HS, Müller KM, Sheath RG, Ott FD, Bhattacharya D. Defining the major lineages of red algae (Rhodophyta). J Phycol. 2006;42(2):482–92.
36. Le Gall L, Saunders GW. A nuclear phylogeny of the Florideophyceae (Rhodophyta) inferred from combined EF2, small subunit and large subunit ribosomal DNA: establishing the new red algal subclass Corallinophycidae. Mol Phylogenet Evol. 2007;43(3):1118–30.
37. Verbruggen H, Maggs CA, Saunders GW, Le Gall L, Yoon HS. Data mining approach identifies research priorities and data requirements for resolving the red algal tree of life. BMC Evol Biol. 2010;10:16.
38. Yoon HS, Hackett JD, Bhattacharya D. A single origin of the peridinin- and fucoxanthin-containing plastids in dinoflagellates through tertiary endosymbiosis. Proc Natl Acad Sci U S A. 2002;99(18):11724–9.
39. Yoon HS, Hackett JD, Ciniglia C, Pinto G, Bhattacharya D. A molecular timeline for the origin of photosynthetic eukaryotes. Mol Biol Evol. 2004;21(5):809–18.
40. Kurtz S, Phillippy A, Delcher AL, Smoot M, Shumway M, Antonescu C, et al. Versatile and open software for comparing large genomes. Genome Biol. 2004;5:R12.
41. Shimodaira H, Hasegawa M. CONSEL: for assessing the confidence of phylogenetic tree selection. Bioinformatics. 2001;17(12):1246–7. 42. Shimodaira H. An approximately unbiased test of phylogenetic tree
selection. Syst Biol. 2002;51(3):492–508.
43. Muller HJ. The relation of recombination to mutational advance. Mut Red. 1964;1(1):2–9.
44. Palmer JD. Chloroplast DNA, exists in two orientations. Nature. 1983;301:92–3. 45. Palmer JD. Comparative organization of chloroplast genomes. Annu Rev
Genet. 1985;19(1):325–54.
46. Aldrich J, Cherney B, Merlin E, Williams C, Mets L. Recombination within the inverted repeat sequences of theChlamydomonas reinhardtiichloroplast genome produces 2 orientation isomers. Curr Genet. 1985;9(3):233–8. 47. Stein DB, Palmer JD, Thompson WF. Structural evolution and flip-flop
recombination of chloroplast DNA in the fern genusOsmunda. Curr Genet. 1986;10(11):835–41.
48. Palmer JD, Osorio B, Aldrich J, Thompson WF. Chloroplast DNA evolution among legumes: loss of a large inverted repeat occurred prior to other sequences rearrangements. Curr Genet. 1987;11(4):275–86.
49. Bourne CM, Palmer JD, Stoermer EF. Organization of the chloroplast genome of the freshwater centric diatomCyclotella meneghiniana. J Phycol. 1992;28(3):347–55.
50. Linne von Berg KH, Kowallik KV. Structural organization of the chloroplast genome of the chromophytic algaVaucheria bursata. Plant Mol Biol. 1992;18(1):83–95.
51. Cattolico RA, Jacobs MA, Zhou Y, Chang J, Duplessis M, Lybrand T, et al. Chloroplast genome sequencing analysis ofHeterosigma akashiwo CCMP452 (West Atlantic) and NIES293 (West Pacific) strains. BMC Genomics. 2008;9(1):211.
52. Walker JF, Jansen RK, Zanis MJ, Emery NC. Sources of inversion variation in the small single copy (SSC) region of chloroplast genomes. Am J Bot. 2015;102(11):1751–2.
53. Zhu A, Guo W, Gupta S, Fan W, Mower JP. Evolutionary dynamics of the plastid inverted repeat: the effects of expansion, contraction, and loss on substitution rates. New Phytol. 2015;209:1747–56.
54. Yang EC, Boo SM, Bhattacharya D, Saunders GW, Knoll AH, Fredericq S, et al. Divergence time estimates and the evolution of major lineages in the florideophyte red algae. Sci Rep. 2016;6:21361.
55. Rothwell GW, Scheckler SE, Gillespie WH.Elkinsiagen. nov., a late Devonian gymnosperm with cupulate ovules. Bot Gaz. 1989;150(2):170–89. 56. Smith SA, Beaulieu JM, Donoghue MJ. An uncorrelated relaxed-clock
analysis suggests an earlier origin for flowering plants. Proc Natl Acad Sci U S A. 2010;107(13):5897–902.
57. Magallón S, Hilu KW, Quandt D. Land plant evolutionary timeline: gene effects are secondary to fossil constraints in relaxed clock estimation of age and substitution rates. Am J Bot. 2013;100(3):556–73.
58. Maréchal A, Parent J, Véronneau-Lafortune F, Joyeux A, Lang BF, Brisson N. Whirly proteins maintain plastid genome stability inArabidopsis. Proc Natl Acad Sci U S A. 2009;106(34):14693–8.
59. Hu J, Wang D, Li J, Jing G, Ning K, Xu J. Genome-wide identification of transcription factors and transcription-factor binding sites in oleaginous microalgaeNannochloropsis. Sci Rep. 2014;4:5454.
60. Guisinger MM, Kuehl JV, Boore JL, Jansen RK. Extreme reconfiguration of plastid genomes in the angiosperm family Geraniaceae: rearrangements, repeats, and codon usage. Mol Biol Evol. 2011;28(1):583–600.
61. Weng ML, Blazier JC, Govindu M, Jansen RK. Reconstruction of the ancestral plastid genome in Geraniaceae reveals a correlation between genome rearrangements, repeats, and nucleotide substitution rates. Mol Biol Evol. 2013;31(3):645–59.
62. Zhang J, Ruhlman TA, Sabir JSM, Blazier JC, Weng M, Park S, et al. Coevolution between nuclear-encoded DNA replication, recombination, and repair genes and plastid genome complexity. Genome Biol Evol. 2016;8(3):622–34. 63. Silberfeld T, Leigh JW, Verbruggen H, Cruaud C, de Reviers B, Rousseau F.
A multi-locus time-calibrated phylogeny of the brown algae (Heterokonta, Ochrophyta, Phaeophyceae): Investigating the evolutionary nature of the