DEMOGRAPHIC RESEARCH
VOLUME 34, ARTICLE 8, PAGES 243
−
258
PUBLISHED 27 JANUARY 2016
http://www.demographic-research.org/Volumes/Vol34/8/ DOI: 10.4054/DemRes.2016.34.8
Descriptive Finding
Remittances and risk of major depressive
episode and sadness among new legal
immigrants to the United States
Eliva Atieno Ambugo
Jenjira Jennie Yahirun
©2016 Eliva Atieno Ambugo & Jenjira Jennie Yahirun.
This open-access work is published under the terms of the Creative Commons Attribution NonCommercial License 2.0 Germany, which permits use, reproduction & distribution in any medium for non-commercial purposes, provided the original author(s) and source are given credit.
1 Background 244
2 Methods 245
2.1 Data and sample 245
2.2 Measures 245
2.3 Analysis 246
3 Results 247
3.1 Characteristics of the analytic sample 247
3.2 Sociodemographic and health correlates of MDE and sadness 247
3.3 Main effects of remittances 248
3.4 Conditional effects of remittances 249
3.5 Supplementary findings 250
4 Discussion and conclusion 251
5 Acknowledgements 252
References 253
Remittances and risk of major depressive episode and sadness
among new legal immigrants to the United States
Eliva Atieno Ambugo1
Jenjira Jennie Yahirun2
Abstract
BACKGROUND
The impact of remittances on health problems like depression among immigrants is understudied. Yet immigrants may be particularly emotionally vulnerable to the strains and benefits of providing remittances.
OBJECTIVE
This study examines the association between sending remittances and major depressive episode (MDE) and sadness among legal immigrants in the United States.
METHODS
Cross-sectional data (N=8,236 adults) come from the New Immigrant Survey (2003−2004), a representative sample of new U.S. permanent residents.
RESULTS
In logistic regression models, immigrants who remitted had a higher risk of MDE and sadness compared to those who did not, net of sociodemographic and health factors. For remitters (N=1,470), the amount of money was not significantly linked to MDE but was associated with a higher risk of sadness among refugees/asylees compared to employment migrants.
CONCLUSIONS
Among socioeconomically vulnerable migrants such as refugees/asylees, sending remittances may threaten mental health by creating financial hardship. Initiatives that encourage economic stability for migrants may protect against depression.
1 Department of Health Management and Health Economics, Institute of Health and Society, University
of Oslo, Norway. E-Mail: [email protected].
1. Background
In 2012, international migrants sent over $529 billion abroad (Pew Research Center 2014), a significant portion of which is linked to improved health and well-being for family members who remain behind (Anton 2010; Frank et al. 2009; Lindstrom and Munoz-Franco 2006). However, less attention has been given to the health consequences of sending remittances on immigrants themselves. This paper fills that gap by addressing the link between sending remittances and the mental health of immigrants living in the United States. We focus on mental health because, unlike physical health where immigrants are thought to be advantaged over native-born peers, research suggests a more ambiguous link between migrant status and mental health. Although immigrants at arrival may have better mental health than the native-born, these advantages dissipate over time (Takeuchi et al. 2007). Examining how mental health outcomes are related to remittance sending may offer insights into larger health disparities between immigrants and natives.
Previous literature provides little conclusive evidence that remitting has positive or negative effects on immigrants’ mental health. On the one hand, remitting may be beneficial for immigrants’ mental health by allowing individuals to feel that they are instrumentally engaged in the lives of family members, and that they ‘matter’ (Global Commission on International Migration [GCIM] 2005). Both ‘mattering’ and social engagement are associated with a lower risk of mental illness/psychological distress (Taylor and Turner 2001). In China, a recent study found that internal migrants who remitted reported less psychological distress than those who did not (Akay et al. 2012).
On the other hand, the obligation and act of sending money to family and friends may expose immigrants to economic hardship (Abrego 2009; Schmalzbauer 2005). Weak control over monies that are remitted may also lead to feelings of frustration and exploitation among some immigrants (GCIM 2005). Additionally, remitting can generate stress by diverting time and resources away from other goals (Mossakowski 2011) such as completing school or starting a family (GCIM 2005). Previous research documents the link between economic hardship and psychological distress (Butterworth et al. 2009; Chiao et al. 2011; Kahn and Pearlin 2006) and has shown the ways in which stress leads to depression (Kessler 1997).
(Akresh and Frank 2008). For humanitarian migrants, stress emanating from providing remittances may exacerbate pre-existing health problems (GCIM 2005). The effect of remittances on health may also vary by gender. Men tend to remit larger sums than women, but women remit more frequently and consistently than men, a pattern aligned with norms about care and cultural obligations within which harmful stress may be embedded (Abrego 2009; Curran and Saguy 2001; Kessler and McLeod 1984).
In this study, we posit that sending remittances to family and friends will be associated with a higher risk of a major depressive episode (MDE) or sadness among immigrants. We argue that even if remittances provide immigrants with a positive sense of ‘mattering’, the stress that surrounds remittance sending will outweigh any positive psychological benefits. We also posit that this association will be more pronounced among women, low-income persons, and humanitarian migrants.
2. Methods
2.1 Data and sample
Cross-sectional data come from Wave 1 of the New Immigrant Survey, a study of individuals granted legal permanent residence (LPR) to the U.S. in 2003 (Jasso et al. 2006). Interviews were conducted in 2003 and 2004 on a sample of 8,573 adults. The analytic sample (N=8,236) excludes 337 cases with missing values on the outcome measures. Missing data on measures for 31% of respondents was handled via multiple imputation. Weights adjust for the sampling design, which was stratified by pre-LRP visa status and takes into account the geographic distribution of immigrants.
2.2 Measures
the seven additional questions were considered to have MDE. We also examine the stem question as a measure of sadness.
The primary independent variable, remittances, is defined here as money sent by the respondent’s household (respondent/spouse/partner) to family and friends living abroad, or in the U.S. but in separate households, over the past 12 months. Our definition includes monetary transfers to other households in the U.S. because previous research suggests that these transfers may be especially important to newly arrived immigrants (Menjívar 2000; Stewart et al. 2008). Remittances are measured in 2003 purchasing power parity (PPP), are presented in hundreds of U.S. dollars including zero (for non-remitters), and are logged to reduce skew. Remittances are operationalized as: 1) a continuous variable for the dollar amount and 2) a dichotomous variable indicating whether or not the respondent’s household remitted.
We included the following potential moderators of the remittance– MDE/sadness relationship: gender (1=female, 0=male); immigrant visa type e.g., family of U.S. citizen/LPR, employment principal, humanitarian migrant (refugee/asylee), others (entered the U.S. without inspection); and household income
(12 months, top-coded at $200,000, logged)—but we recognize that immigrants do not always pool household monies when remitting (Menjívar 2000).
We also include several control variables to reduce confounding: age, marital status, race/ethnicity, education, employment status, remittances received by the respondent’s household, English proficiency, length of stay in the U.S., region of birth, and religious membership. With respect to health, we also control for health insurance, self-rated health, and seven doctor-diagnosed chronic conditions (e.g., stroke, cancer).
Additionally, we control for immigrants’ experiences abroad before migrating to the U.S., including: harm suffered (e.g., threats), work experience, and religious attendance. A more detailed operationalization of these variables is provided in Appendix Table A-1.
2.3 Analysis
varies by respondent’s gender, income, and pre-LPR visa type, was also carried out on the full sample and the sample of remitters.
3. Results
3.1 Characteristics of the analytic sample
Table 1 presents our main outcome variables (Panel A), the explanatory variables of interest (Panel B), and demographic factors that may moderate the remittance— MDE/sadness relationship (Panel C). As shown in Panel A, MDE is less common (4.7% of respondents) than sadness (13.4%) in our sample. In Panel B, approximately 19% of respondents reported remitting in the previous year. The average amount of remittances across respondents’ households, including those that did not remit, is $1,028. This rises to $5,274 when restricted to households that remitted. As seen in Panel C, the sample is slightly more biased towards women, with an average income of $32,930. Most immigrants entered as family members of U.S. citizens/LPRs, about one-tenth had employment visas, and somewhat smaller proportions entered on diversity visas or as humanitarian migrants. Remaining characteristics of the sample that we control for in our models are presented in Appendix Table A-1.
3.2 Sociodemographic and health correlates of MDE and sadness
Table 1: Select weighted sample characteristics: New legal immigrants to the U.S. ages 18+ (N = 8,236)
Characteristic Percent/Mean SD
Panel A: Outcome variables
Major depressive episode (/no) 4.68
Sadness (/no) 13.40
Panel B: Main explanatory variables
Remittances given (/no) 19.40
Remittances given (hundreds $) 10.28 95.92
Panel C: Other demographic traits
Female (/men) 56.31
Household income (thousands of dollars) 32.93 39.78
Visa Type Immediate family Extended family Employment principal Diversity visa principal Humanitarian Legalization Other
40.77 17.11 9.84 7.98 6.77 8.26 9.26
Notes:Estimates obtained from the multiple imputation (MI) of 25 datasets; SD = standard deviation
Source: The New Immigrant Survey 2003-2004 (Wave 1)
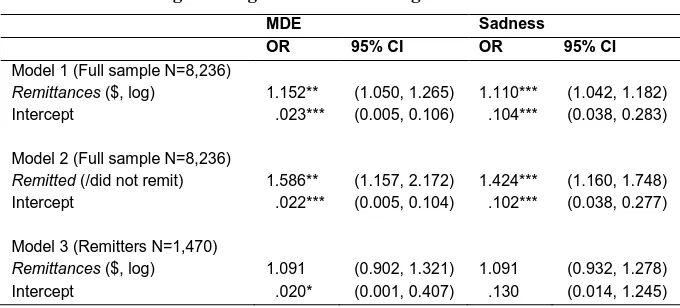
3.3 Main effects of remittances
Table 2: Weighted logistic regression of MDE and sadness on remittances: New legal immigrants to the U.S. ages 18+
MDE Sadness
OR 95% CI OR 95% CI
Model 1 (Full sample N=8,236)
Remittances ($, log) 1.152** (1.050, 1.265) 1.110*** (1.042, 1.182)
Intercept .023*** (0.005, 0.106) .104*** (0.038, 0.283)
Model 2 (Full sample N=8,236)
Remitted (/did not remit) 1.586** (1.157, 2.172) 1.424*** (1.160, 1.748)
Intercept .022*** (0.005, 0.104) .102*** (0.038, 0.277)
Model 3 (Remitters N=1,470)
Remittances ($, log) 1.091 (0.902, 1.321) 1.091 (0.932, 1.278)
Intercept .020* (0.001, 0.407) .130 (0.014, 1.245)
Notes:Estimates obtained from the multiple imputation of 25 datasets; OR = odds ratio; *p ≤ .05, **p ≤ .01, ***p ≤ .001;
CI = confidence interval; Each model controls for remittances received and all sociodemographic and health characteristics in Table 1 and Appendix Table A-1.
Source: The New Immigrant Survey 2003-2004 (Wave 1)
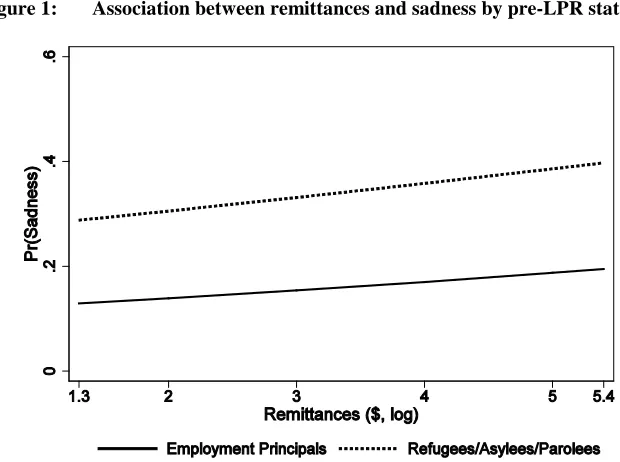
3.4 Conditional effects of remittances
Figure 1: Association between remittances and sadness by pre-LPR status
Predicted Probabilities (Pr) of Sadness as a Function of Remittances and Type of Immigrant (Refugees/Asylees/Parolees
versus Employment Principals): Immigrants who Remitted (N = 1,470).
3.5 Supplementary findings
p=.001), and also a higher risk of sadness among immigrants who entered the U.S. without inspection (OR=2.334, p=.012) but not among employment principals (OR=1.046, p>.05). Although these unweighted longitudinal findings should be viewed with caution, they too suggest that sending remittances has consequences for immigrants’ mental health.
4. Discussion and conclusion
We investigated the relationship between remittance sending and MDE and sadness among U.S. legal immigrants. Our findings for the full sample confirm that immigrants who remitted had a higher risk of MDE and sadness compared to those who did not. However, contrary to our expectations, the effect did not vary by gender, income, or pre-LPR visa type. Among immigrants whose households remitted, the amount sent was not significantly linked to MDE. Consistent with our expectations, however, the amount remitted was significantly associated with a higher risk of sadness among humanitarian migrants compared to employment principals. Financial strain is a known risk factor for depression and it likely underlies some of the deleterious effects of remittances on mental health suggested by this study, although we lack data to test its mediating effect. In the stratified systems of inequality that exist in U.S. society, women, humanitarian migrants, and low-income persons generally occupy disadvantaged positions that generate stress across multiple dimensions of life (McLeod 2013). Our findings suggest that, for humanitarian migrants, such stress can in turn heighten emotional reactivity to the obligation to remit.
This study is limited by the use of cross-sectional data and the lack of information from undocumented immigrants. Ideally, future studies should include the weighted second wave of the New Immigrant Survey (NIS) and much longer panel data to fully assess the effects of remittance-sending on migrants’ health. Our supplementary analysis of unweighted longitudinal NIS data, however, confirms our cross-sectional findings. Additionally, our conceptualization of remittances as encompassing monies sent to family members/friends irrespective of the beneficiary’s country of residence captures more realistically the breadth of immigrants’ remitting activities. Thus, our results provide an important basis for future research on the relationship between remittances and health.
important research gap by examining how the sending, rather than the receiving, of remittances impacts immigrants’ health. Our finding that remittances are linked to poor mental health among some immigrants calls for more research into the mechanisms (e.g., financial strain) that underlie the remittance–health relationship. Efforts aimed at reducing unemployment and promoting financial stability among immigrants may help lower their risk of depression.
5. Acknowledgements
References
Abrego, L. (2009). Economic well-being in Salvadoran transnational families: How gender affects remittance practices. Journal of Marriage and Family 71(4): 1070–1085. doi:10.1111/j.1741-3737.2009.00653.x.
Akay, A., Giulietti, C., Robalino, J.D., and Zimmermann, K.F. (2012). Remittances and well-being among rural-to-urban migrants in China. Review of Economics of the Household: 1–30.
Akresh, I.R. and Frank, R. (2008). Health selection among new immigrants.
American Journal of Public Health 98(11): 2058–2064.
doi:10.2105/AJPH.2006.100974.
Anton, J. (2010). The impact of remittances on nutritional status of children in Ecuador. International Migration Review 44(2): 269–299. doi:10.1111/j.17
47-7379.2010.00806.x.
Butterworth, P., Rodgers, B., and Windsor, T.D. (2009). Financial hardship, socio-economic position and depression: Results from the PATH Through Life Survey. Social Science & Medicine 69(2): 229–237. doi:10.1016/j.socs cimed.2009.05.008.
Carling, J. (2008). The determinants of migrant remittances. Oxford Review of Economic Policy 24(3): 582–599. doi:10.1093/oxrep/grn022.
Chiao, C., Weng, L.-J., and Botticello, A.L. (2011). Economic strain and well-being in late life: Findings from an 18-year population-based longitudinal study of older Taiwanese adults. Journal of Public Health: 1–11.
Curran, S. and Saguy, A. (2001). Migration and cultural change: A role for gender and social networks. Journal for International Women’s Studies 2(3): 54–77. Frank, R., Palma-Coca, O., Rauda-Esquivel, J., Olaiz-Fernandez, G.,
Diaz-Olavarrieta, C., and Acevedo-Garcia, D. (2009). The relationship between remittances and health care provision in Mexico. American Journal of Public Health 99(7): 1227–1231. doi:10.2105/AJPH.2008.144980.
Jasso, G., Massey, D.S., Rosenzweig, M.R., and Smith, J.P. (2006). The New Immigrant Survey 2003 round 1 (NIS-2003-1). Public release data 2006. Kahn, J.R. and Pearlin, L.I. (2006). Financial strain over the life course and health
among older adults. Journal of Health and Social Behavior 47(1): 17–31. doi:10.1177/002214650604700102.
Kessler, R.C. (1997). The effects of stressful life events on depression. In: Spence, J.T. (ed.). Annual Review of Psychology, Volume 8. Palo Alto, California: Annual Reviews Inc.: pp. 191–214. doi:10.1146/annurev.psych.48.1.191. Kessler, R.C., Andrews, G., Mroczek, D., Ustun, B., and Wittchen, H.U. (1998).
The World Health Organization Composite International Diagnostic Interview Short Form. International Journal of Methods in Psychiatric Research 7(4), 171–185. doi:10.1002/mpr.47.
Kessler, R.C. and McLeod, J.D. (1984). Sex differences in vulnerability to life events. American Sociological Review 49(5): 620–631. doi:10.2307/20954 20.
Lindstrom, D.P. and Munoz-Franco, E. (2006). Migration and maternal health services utilization in rural Guatemala. Social Science & Medicine 63(3): 706–721. doi:10.1016/j.socscimed.2006.02.007.
McLeod, J.D. (2013). Social stratification and inequality. In: Aneshensel, C.S., Phelan, J.C., and Bierman, A. (eds.). Handbook of the sociology of mental health, 2nd Edition. New York: Springer: pp. 229–254.
doi:10.1007/978-94-007-4276-5_12.
Menjívar, C. (2000). Fragmented ties: Salvadoran immigrant networks in America. Berkeley: University of California Press.
Mossakowski, K.N. (2011). Unfulfilled expectations and symptoms of depression among young adults. Social Science & Medicine 73(5): 729–736.
doi:10.1016/j.socscimed.2011.06.021.
Pew Research Center. (2014). Remittance Flows Worldwide in 2012 [electronic source]. Washington, DC: Pew Research Center. http://www.pewsocial trends.org/2014/02/20/remittance-map/
Stewart, M., Anderson, J., Beiser, M., Mwakarimba, E., Neufeld, A., Simich, L., and Spitzer, D.(2008). Multicultural meanings of social support among immigrants and refugees. International Migration 46(3): 123–159.
doi:10.1111/j.1468-2435.2008.00464.x.
Takeuchi, D.T., Alegria, M., Jackson, J.S., and Williams, D.R. (2007). Immigration and mental health: Diverse findings in Asian, Black, and Latino populations.
American Journal of Public Health 97(1), 11–12. doi:10.2105/AJPH.2006.
103911.
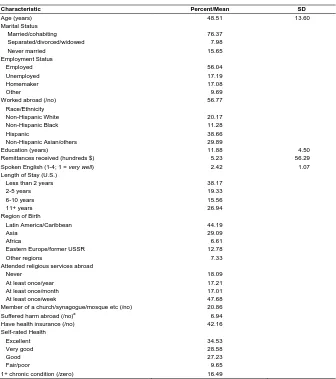
Appendix
Table A-1: Select weighted sample characteristics: New legal immigrants to the U.S. ages 18+ (N = 8,236)
Characteristic Percent/Mean SD
Age (years) 48.51 13.60
Marital Status Married/cohabiting Separated/divorced/widowed Never married 76.37 7.98 15.65 Employment Status Employed Unemployed Homemaker Other 56.04 17.19 17.08 9.69 Worked abroad (/no) 56.77 Race/Ethnicity Non-Hispanic White Non-Hispanic Black Hispanic Non-Hispanic Asian/others 20.17 11.28 38.66 29.89
Education (years) 11.88 4.50
Remittances received (hundreds $) 5.23 56.29 Spoken English (1-4; 1 = very well) 2.42 1.07 Length of Stay (U.S.)
Less than 2 years 2-5 years 6-10 years 11+ years 38.17 19.33 15.56 26.94 Region of Birth
Latin America/Caribbean Asia
Africa
Eastern Europe/former USSR Other regions 44.19 29.09 6.61 12.78 7.33 Attended religious services abroad
Never At least once/year At least once/month At least once/week
18.09 17.21 17.01 47.68 Member of a church/synagogue/mosque etc (/no) 20.86 Suffered harm abroad (/no)a
6.94 Have health insurance (/no) 42.16 Self-rated Health Excellent Very good Good Fair/poor 34.53 28.58 27.23 9.65 1+ chronic condition (/zero) 16.49
Notes:Estimates obtained from 25 multiplely imputed (MI) datasets; SD = standard deviation;
a
the respondent and/or the respondent’s family
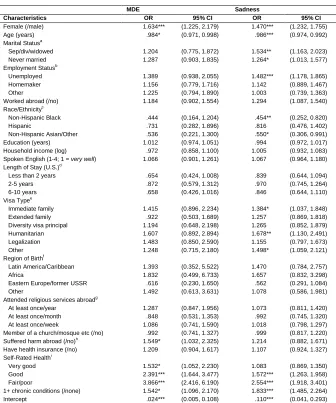
Table A-2: Weighted logistic regression of MDE and sadness on sociodemographic and health characteristics: New legal immigrants to the U.S. ages 18+ (N = 8,236)
MDE Sadness
Characteristics OR 95% CI OR 95% CI
Female (/male) 1.634*** (1.225, 2.179) 1.470*** (1.232, 1.755) Age (years) .984* (0.971, 0.998) .986*** (0.974, 0.992) Marital Statusa
Sep/div/widowed Never married 1.204 1.287 (0.775, 1.872) (0.903, 1.835) 1.534** 1.264* (1.163, 2.023) (1.013, 1.577) Employment Statusb
Unemployed Homemaker Other 1.389 1.156 1.225 (0.938, 2.055) (0.779, 1.716) (0.794, 1.890) 1.482*** 1.142 1.003 (1.178, 1.865) (0.889, 1.467) (0.739, 1.363) Worked abroad (/no) 1.184 (0.902, 1.554) 1.294 (1.087, 1.540) Race/Ethnicityc Non-Hispanic Black Hispanic Non-Hispanic Asian/Other .444 .731 .536 (0.164, 1.204) (0.282, 1.896) (0.221, 1.300) .454** .816 .550* (0.252, 0.820) (0.476, 1.402) (0.306, 0.991) Education (years) 1.012 (0.974, 1.051) .994 (0.972, 1.017) Household income (log) .972 (0.858, 1.100) 1.005 (0.932, 1.083) Spoken English (1-4; 1 = very well) 1.066 (0.901, 1.261) 1.067 (0.964, 1.180) Length of Stay (U.S.)d
Less than 2 years 2-5 years 6-10 years .654 .872 .658 (0.424, 1.008) (0.579, 1.312) (0.426, 1.016) .839 .970 .846 (0.644, 1.094) (0.745, 1.264) (0.644, 1.110) Visa Typee
Immediate family Extended family Diversity visa principal Humanitarian Legalization Other 1.415 .922 1.194 1.607 1.483 1.248 (0.896, 2.234) (0.503, 1.689) (0.648, 2.198) (0.892, 2.894) (0.850, 2.590) (0.715, 2.180) 1.384* 1.257 1.265 1.678** 1.155 1.498* (1.037, 1.848) (0.869, 1.818) (0.852, 1.879) (1.130, 2.491) (0.797, 1.673) (1.059, 2.121) Region of Birthf
Latin America/Caribbean Africa
Eastern Europe/former USSR Other 1.393 1.832 .616 1.492 (0.352, 5.522) (0.499, 6.733) (0.230, 1.650) (0.613, 3.631) 1.470 1.657 .562 1.078 (0.784, 2.757) (0.832, 3.298) (0.291, 1.084) (0.586, 1.981) Attended religious services abroadg
At least once/year At least once/month At least once/week
1.287 .848 1.086 (0.847, 1.956) (0.531, 1.353) (0.741, 1.590) 1.073 .992 1.018 (0.811, 1.420) (0.745, 1.320) (0.798, 1.297) Member of a church/mosque etc (/no) .992 (0.741, 1.327) .999 (0.817, 1.220) Suffered harm abroad (/no)h
1.549* (1.032, 2.325) 1.214 (0.882, 1.671) Have health insurance (/no) 1.209 (0.904, 1.617) 1.107 (0.924, 1.327) Self-Rated Healthi
Very good Good Fair/poor 1.532* 2.391*** 3.866*** (1.052, 2.230) (1.644, 3.477) (2.416, 6.190) 1.083 1.572*** 2.554*** (0.869, 1.350) (1.263, 1.958) (1.918, 3.401) 1+ chronic conditions (/none) 1.542* (1.096, 2.170) 1.833*** (1.485, 2.264) Intercept .024*** (0.005, 0.108) .110*** (0.041, 0.293)
Notes:Estimates obtained from 25 multiplely imputed datasets; OR = odds ratio; CI = confidence interval; *p ≤ .05, **p≤ .01, ***p ≤ .001; Reference groups: a Married, b Employed, c Non-Hispanic White, d 11+ years, e Employment principals, f Asia,
g
Never, h
the respondent and/or the respondent’s family, I
Excellent.