A b s t r a c t.In an experiment conducted in NE Spain, cereals and legumes were rotated for seven cycles using two different tillage techniques – conventional tillage and direct drilling (no-tillage: NT). Straw was removed after harvesting in both tillage systems. With NT, more than 30% of the soil surface was still covered by residues (stubble) at sowing. The soil was Calcic Cambisol and the climate aridity index was 0.76. The climatic water balance was negative, at -187 mm y-1from 1950 to 1980. The aims of the study were to determine the effect of tillage system on 2-D macroporosity by micromorphology, and bulk density (excavation method) of the upper layer of the ploughed horizon. To identify differences, either parametric or nonparametric statistical tests were performed depending on sample size. Direct drilling with residue removal affected bulk density, macroporosity and mean macropore area in the top 10 cm of the profile. The same effects were observed under conventional tillage. The upper layer of the studied horizon had higher total porosity than the layer beneath with both treatments. The upper layer of the horizon showed unfavourable physical conditions with direct drilling.
K e y w o r d s: leguminous-cereal rotation, row and inter-row macroporosity, 2-D macroporosity, mean macropore area, bulk density
INTRODUCTION
In the Mediterranean region, water available for crops is restricted by irrigation and/or rainfall patterns despite the technological advances and improvements in water distri-bution and availability for crops. Approximately 77.6% of
the arable surface in Spain is dryland (INE, 2007, data for 2003). Specifically in Catalonia (NE Spain), 72% of arable land is dryland (data for 1999). The main crops in this area are cereals (wheat, barley, rye) and, to a lesser extent, legu-mes (IEC, 2005).
Direct drilling or no-tillage (NT) is a very widespread practice used in several ways. Both stubble and straw may be left in place, and all crop residues burnt (Bescansaet al., 2006), or straw may be removed (either for weed control or for sale), and stubble left in place. When crop residues return to the soil they help maintain soil porosity and tilth (Larson, 1979). Conventional tillage (CT) is used to prepare the seedbed (improving seed-soil contact), facilitating regular, unvary-ing early plant emergence. However, in the long-term, CT (primary and secondary tillage operations for preparing seedbeds) causes intense alteration of the top centimetres of the soil directly affected by tillage and might contribute to negative physical fertility of soils. These effects may vary at different depths. CT decreases organic matter content in Ap horizons and reduces structural stability in the surface horizon. It also compacts the soil at some depth (plough pan) and increases resistance to root penetration (Micucci and Taboada, 2006). It alters the soil pore system (Sasalet al., 2006) and total porosity, especially in subsurface horizons, changing the infiltration rate and affecting the soil water storage capacity (Lipiecet al., 2006).
Infiltration is essential to ensure soil water recharge for dryland farming. Parameters such as sorptivity regulate the initial stages of infiltration and depend on management
Effects of two tillage techniques on soil macroporosity in sub-humid environment**
R. Josa
1, M. Ginovart
2*, and A. Solé
31Department of Agri-Food Engineering and Biotechnology, Universitat Politècnica de Catalunya, Edifici ESAB, Esteve Terrades 8, 08860-Castelldefels, Barcelona, Spain
2
Department of Applied Mathematics III,Universitat Politècnica de Catalunya, Edifici ESAB, Esteve Terrades 8, 08860-Castelldefels, Barcelona, Spain
3
Experimental Station of Arid Zones, CSIC, Carretera de Sacramento s/n, 04120-La Cañada de San Urbano, Almería, Spain
Received November 2, 2009; accepted February 25, 2010
© 2010 Institute of Agrophysics, Polish Academy of Sciences
*Corresponding author’s e-mail: [email protected] **This paper was presented at the Conference ‘Biohydrology 2009’, Bratislava, Slovakia.
A A
Agggrrroooppphhyhyysssiiicccsss
practices (Scott, 2000). An increase in residual biomass incorporated into the soil enhances micro-aggregation in the top 2.5 cm as well as effective porosity (Shaveret al., 2003). Conservation tillage has been shown to improve the physical properties of the soil, particularly by allowing higher soil water content (Ungeret al., 1991; Lampurlanés and Cantero-Martínez, 2006). Farkaset al. (2009) compared the range of total soil water in different tillage systems and found mouldboard ploughing < loosening + disking < NT < disk-ing. Furthermore, NT soil retained more water in the upper 0.20 m layer and less in the 0.80 m layer than with disking, which indicates that NT provided more balanced soil water distribution within the profile because root distribution was more uniform due to the absence of tillage-induced subsoil compaction. Tóthet al. (2009) have reported carbon dioxide emission with different soil management systems (NT, ploughing, loosening + disking) and different soil water content ranges. In general, the rate of emission increased with increasing soil water content, and CO2emissions were
the highest and lowest for the NT and CT treatments, respectively. This could be explained by organic carbon being more accessible for microbes in less disturbed soil.
The results of a study conducted on two experimental sites in Poland to determine the effect of two tillage systems (conventional and reduced) on changes in some soil microbiological activity parameters showed that the reduced tillage system created a more friendly environ-ment for the growth and activity of soil microorganisms than CT (Gajda, 2008), and also improved soil physical properties (Czy¿ and Dexter, 2008). The soil physical properties assessed at those sites indicated that bulk density and aggregate stability were higher for reduced tillage than for CT, whereas reduced tillage increased water content throughout the profile in silt loam soil (Site 1), and only at the top in heavy loamy sand (Site 2). There is presently a growing interest in developing con-servation tillage systems as an alternative to traditional tillage in some areas, but the success of reduced tillage and direct drilling depends on the crop, soil type and cli-matic conditions.
Micromorphological techniques have been widely used in the assessment of macroporosity and soil microstructure. Since the pioneering publications of Brewer (1964) and Jongerius (1957) with precise soil microstructure descrip-tions, and Lafeber (1965) with the first quantitative pore assessments (size and orientation) in polished sections of undisturbed soils, many researchers have actively contribu-ted to the present status of soil micromorphology (Bullock and Murphy, 1976) and soil micromorphometry (Pagliai, 1988; Ringrose-Voase, 1990) as reliable techniques for the morphological characterization of the physical, chemical and biological properties of soil. Pagliai (1988) and Ringrose-Voase (1990) have used this technique to assess many geometric soil pore parameters (size, area, Feret
diameter, orientation,etc.) in both steady-state and dynamic studies on the physical effects of different uses and types of management on soil.
In research conducted in NE Spain (Josa and Hereter, 2005), cereals and legumes were rotated using two different tillage techniques, conventional and direct drilling (or no-tillage, maximum tillage depth = 0.2 m). For five consecu-tive years (1995 to 1999), the straw was removed from the fields at the end of each cycle, and water content in the surface horizon (0 top 0.2 m) was monitored during the spring. Throughout this period, the water content was higher with NT than with CT. However, this did not lead to an improvement in yield with NT.
The aims of this paper are:
– to describe the effects of the tillage system on the macropores using soil micromorphological techniques, after seven consecutive years of NT or CT;
– to acquire information on bulk density to find out the effects of tillage at different depths in the soil profile.
The results found can be related to soils in any other semiarid Mediterranean area where direct drilling techni-ques are applied.
MATERIAL AND METHODS
The study area,located in Vallès Oriental, Barcelona (NE Spain), has a Mediterranean climate, with wet autumns and springs, dry summers, and wide inter-annual variability in precipitation. The annual water balance shows a deficit of 187 mm y-1(P = 605 mm y-1and ET0= 792 mm y-1series from 1950 to 1980), with a climate aridity index of 0.76 (UNESCO, 1977), which is quite common in wide areas around the Mediterranean. It is an area of marginal farming (15.5% of the area is occupied by extensive agriculture) amidst woodland and urban areas. There is a high risk of forest fires during the summer, and farmers are advised to remove crop residues. Hence, it is common practice to remove straw and leave stubble in place.
The experiment was carried out on two representative plots with soil developed on arkosics clays and sandstones. The main components are quartz, feldspar, biotite, in a kaoli-nitic matrix (ITGE, 1993).
The soil was classified as Calcic Cambisol (Commis-sion European Community, 1985) over the whole experimen-tal area, which shows a uniform gentle slope (8%). Soil cha-racteristics were very similar throughout (Josaet al., 1998): over 0.80 m deep; rich in CaCO3, and uniform clay loam tex-ture throughout the profile. Their pH in water ranged from 8.2 to 8.4, total organic carbon was 1.03% in the top 8 cm, decreasing with depth. Cation exchange capacity ranged from 15.2 to 12.1 cmolc+kg-1and the electrical conductivity at 25ºC (water extract 1:5) was 0.21dS m-1or lower.
The main features of the tillage experiment, which started in 1994, are described in detail in Josa and Hereter (2005). Soil samples were taken at the end of the experiment in September 2001, after seven complete crop cycles.
The experimental area comprised two plots on the back-slope of a generally sloping area, each one measuring 30x90 m. One plot was subjected to direct drilling in the following farming sequence:
– mineral fertilization,
– weed control (Imazethapyr in pea; chlorsulfuron and tribenuron applied as described by Mas and Verdú, 2003), – sowing (disk direct drill, with row spacing of 186.6 mm), – weed control (pendimethalin),
– harvest (Josa and Hereter, 2005).
Seeding and harvesting were carried out with the same agricultural machinery (row spacing: 0.187 m) on both plots at the same time.
The other plot was subjected to conventional tillage as commonly used in the area, in the following farming se-quence:
– cultivator plough, – harrow and roller; – mineral fertilization,
– weed control (similar to NT), – sowing,
– harvest.
Organic matter management was identical in the two plots: stalks and straw were removed and stubble was left in place. Crop residues were found to cover more than 30% of the surface area of the NT plot (measured after straw removal).
At the end of the seventh consecutive cycle, undisturbed samples were taken from each plot for micromorphological analysis of soil pore space and bulk density measurement. Samples were taken after the barley crop under dry soil conditions.
Two sampling areas were defined (middle backslope and lower backslope) in each plot, and in each area a trench (1 m long by 0.5 m deep) was dug, perpendicular to the di-rection of tillage-drilling. Samples were taken from each of two layers, upper (0 to 50 mm) and lower (below 50 mm), identified in the ploughed horizon. Undisturbed and orien-ted samples were taken in Kubiena boxes (50x70x40 mm). In the upper layer, samples were taken a) in the drilling furrow (Row), and b) in the drilling interrow (Interrow). In the lower layer, differences between the positions were not as obvious as in the first and consequently just one set of sam-ples was taken. Three replicates (K boxes) were sampled from each upper layer and two replicates (K boxes) from the lower layer.
Undisturbed samples were stored in dry atmospheric conditions (protected with filter paper) and then impregna-ted with an unsaturaimpregna-ted polyester resin (diffractive index = 1.52) with a fluorescent dye (Uvitex DB, from Ciba-Geigy) in it, under vacuum conditions. Once polymerized, the blocks were cut with a large diamond disk saw into slices ap-proximately 1 cm thick and up to 7 cm long.
From 3 to 5 slices were taken from each block. Polished slices were analyzed separately on both sides. Defective sli-ces (deficient impregnation) were rejected. Table 1 shows the sample distribution pattern and the area analyzed (in mm2). The polished faces (45 mm x 65 mm) of each slice were illuminated with both tungsten and UV light and scan-ned (without geometric distortion) at a resolution of nearly 2 megapixels per image. Binary images were processed and analyzed with OPTIMAS 5.2 (Optimas Corp.) software to measure the two-dimensional porosity parameters, follow-ing Torrentó and Solé (1992) and Raducuet al. (2002). The image pixel size was 35 µm and, therefore, the minimum pore size considered was 50 µm equivalent diameter.
Tillage Position Depth
(mm) (±5) Sample blocks Polished faces
Surface area analyzed (mm2)
Conventional tillage
upper layer row 0-60 3 13 22 400
upper layer interrow 0-60 3 12 16 450
undifferentiated lower layer 60-110 2 6 13 400
complete ploughed horizon 0-110 8 31
No tillage
upper layer row 0-60 3 14 21 850
interrow upper layer 0-60 3 13 22 525
undifferentiated lower layer 60-110 2 8 23 250
complete ploughed horizon 0-110 8 35
Total 66 322 975
Water flux in soil is usually conditioned by the macroporosity characteristics (total macroporosity, number, form and continuity of macropores). This is relevant for water infiltration, and during drying, because each macropore interacts with its immediate neighbour to allow water transmission and regulate the air-filled porosity (Weiler and Naef, 2003).
With a view to characterising the effects of the CT and NT tillage systems on macroporosity, three measurements were made on every slice analyzed: number of macropores, area of macropores (mm2), and total surface area analyzed (mm2), and the following variables were calculated: – 2-D macroporosity (area of macropores/total surface area
analyzed) which is well correlated with total porosity measured by other methods (Edwards, Shipitalo, and Norton, 1988),
– number of macropores per unit area (NMUA), which along with 2-D macroporosity is an indication of how good water transmission fluidity (Mallantset al.,1997), – mean macropore area (MPA), used as a simple way to
cha-racterize the effects of tillage system on soil macroporo-sityieusing CT/CT : NT/CT (noted as “CT/NT ratio”).
Bulk density was determined using the excavation method (Blake and Hartge, 1986). Sample volume was from 450 to 650 cm3of soil extracted at the same depth as the micromorphological samples. Three replicates were taken of each position (upper and lower layers in row and interrow in CT and NT plots) for a total of 24 samples.
Statistical analysis of bulk density data and porosity parameters from the polished sections were used, first, to compare the two tillage systems (CT and NT), and second, to find any significant differences between the upper and lower parts of the ploughed horizon in each tillage system. Diffe-rences between row and interrow were also analyzed for each system, although only for the samples from the upper layer, from field observations, and assuming that observed differences in the lower layer were minimal.
The right test for comparing measurements can present a problem, as a choice must be made between two families of tests, parametric and nonparametric. Whether or not the choice really matters depends on sample size. Large data sets present no problem. The central limit theorem ensures that parametric tests work well even if the population is non-Gaussian, and nonparametric tests are only slightly less powerful than para-metric tests. Small samples present a dilemma. In a parapara-metric test with data from non-Gaussian populations, the P-value may be inaccurate, but in a nonparametric test with data from a Gaussian population, the P-value tends to be too high. Although nonparametric tests lack statistical power with small samples, in view of this, they are safer.
For this work, we decided which type of statistical test to use on the basis of sample size. We considered a sample large if there were over 20 data in each group for compari-son. Otherwise, nonparametric tests were used for small samples. For the comparison of two means, the usual (para-metric) method is the t-test which can be employed either when variances within the two groups are the same (pooled t-test) or when they differ (Welch-Satterthwaite modifica-tion). An F-test is used to test whether the variances in two populations are equal. The counterpart nonparametric tests that compare two unpaired groups are the Wilcoxon rank sum test, or the equivalent Wilcoxon-Mann-Whitney test (WMW test) for location, and the Ansari-Badley test for dispersion. In this case, the empirical distribution functions and Kuiper statistic were also calculated to test whether the distributions of the response variables were the same across different groups (Montgomery and Runger, 2003).
Statistical analyzes compared the locations of two groups to determine whether one population was shifted with re-spect to another, using parametric or nonparametric tests ac-cording to the sample size, data distribution and dispersion. SAS/STAT software, which provides parametric and non-parametric tests, was used to perform these statistical ana-lyzes (SAS Institute, 1992). The probability level of significance was set at 0.05.
Set of samples
Conventional tillage No tillage Statistical test and P-value
N Mean SD Med Range N Mean SD Med Range t F WMW AB K
Ploughed 31 0.363 0.208 0.296 0.793 35 0.264 0.153 0.240 0.663 0.031 0.087
Upper layer 25 0.357 0.210 0.313 0.793 27 0.288 0.166 0.275 0.663 0.192 0.248
Lower layer 6 0.387 0.219 0.284 0.505 8 0.184 0.047 0.185 0.117 0.013 0.250 0.146
UL row 13 0.455 0.205 0.469 0.716 14 0.283 0.169 0.270 0.523 0.038 0.775 0.454
UL interrow 12 0.251 0.162 0.229 0.570 13 0.294 0.170 0.302 0.663 0.503 0.873 0.987
N – sample size (number of polished sections), SD – standard deviation, Med – median, t – t-test, WMW – Wilcoxon-Mann-Whitney test, AB – Ansari-Badley test, K – Kuiper test, UL – upper layer of ploughed horizon.
RESULTS AND DISCUSSION
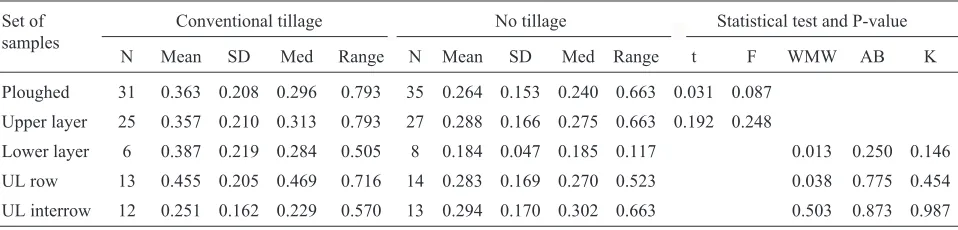
2-D macroporosity findings are shown in Table 2. Ave-rages of different positions and depths ranged from 0.184 to 0.455 mm2mm-2. This variable was affected by the tillage system, being significantly lower in NT than in CT in all po-sitions except in the upper layer of the interrow.
Larger porosity in the CT ploughed horizon can be at-tributed to increased porosity in the row (37.8 %) and lower layer. In this case the mean porosity of CT doubles that of NT. Macroporosity in the upper layer of the interrow, how-ever, is quite similar for both CT and NT.
Tillage (CT) induced a significant difference in the late-ral distribution of macroporosity observed in the row and interrow (Table 3). In contrast, no differences were noticed bet-ween the depths. NT showed the opposite response. A nearly significant difference was observed between the upper and the lower layers, but there were clearly no differences bet-ween the row and interrow.
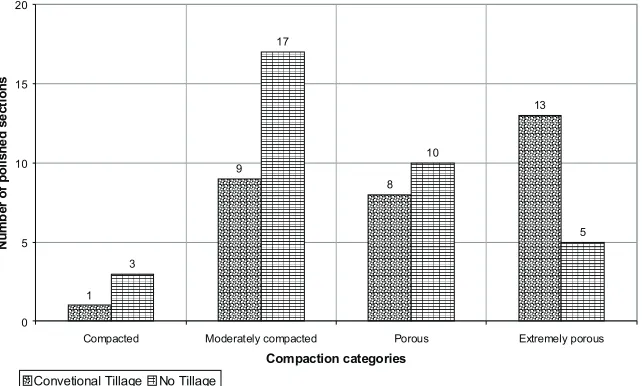
Following the criteria of Pagliai (1988) and Pagliaiet al. (2003), macroporosity of polished sections was classified by compaction level. This criterion allows soil macroporosity to be classified in four categories, from compacted soil to ex-tremely porous. The results of this classification are shown in Fig. 1. The most frequent category in NT is moderately compacted (48.5%), whereas for CT, it is extremely porous (41.9%). The frequency of the other two categories (com-pacted and porous) is quite similar for both tillage systems.
These results agree with those found by Hillet al. (1985), who attribute them to annual tillage mixing soil material (Kay and VandenBygaart, 2002).
Macroporosity in the tilled horizon of soil subjected to CT is significantly higher than in NT soil, which mainly con-tributes to increasing infiltration and water accumulation after extended rainfalls (Lipiecet al., 2006). The importance of macroporosity has been discussed by several authors, especially in connection with the development of soil hydrological models for ponded infiltration into soil with
Tillage Position
P- values 2-D macroporosity
P-values NMUA
P-values Bulk density
WMW AB K WMW AB K WMW AB K
Conventional tillage
Upper vs lower layer 0.715 0.846 0.749 0.826 0.056 0.263 <0.001 0.011 <0.001
Interrow vs row 0.019 0.873 0.375 0.152 0.710 0.440 0.549 0.692 0.521
No tillage
Upper vs lower layer 0.074 0.092 0.016 0.055 0.589 0.473 <0.001 0.185 0.008
Interrow vs row 0.793 0.999 0.806 0.933 0.363 0.806 0.243 0.999 0.417
NMUA: Number of macropores per unit area. Other explanations as on Table 2.
T a b l e 3.P-values for the inferential test comparing bulk density and porosity parameters in different positions for each tillage system
1
9
8
13
3
17
10
5
0 5 10 15 20
Compacted Moderately compacted Porous Extremely porous
Compaction categories
N
u
m
b
e
r
o
f
p
o
li
s
h
e
d
s
e
c
ti
o
n
s
Convetional Tillage No Tillage
preferential movement of water into macropores. According to Dohnalet al. (2009), the detailed knowledge of water flow through macropores is of major importance when predicting catchment rainfall-runoff responses. In fact, their water flow simulation, based on measured hydraulic characteristics without consideration of preferential flow effects, does not describe their infiltration experiment adequately. Linet al. (1996) state that porosity of an equivalent diameter over 0.06 mm contributes up to 89% of the total vertical flow of water under these conditions if soil structure is stable enough. The main function of this pore size in the soil is to transmit water and distribute it within the profile (Greenland, 1977; Paniniet al., 1997).
In the Mediterranean region this type of porosity is of special interest in periods of intense rainfall (spring and autumn), as it contributes to soil water recharge and reduces surface runoff, as well as diffusion and renewal of the soil gas phase.
NMUA results are shown in Table 4. The CT and NT extremes (only ranges are shown in Table 4), are 1.16 and 0.25 and 0.88 and 0.17 macropores per mm2, respectively. The highest CT mean (0.808) was found in the upper layer of the interrow. Differences were significant for the ploughed upper layer and upper layer interrow. No differences were observed between row or lower layers, but the level of signi-ficance depends on the statistical test applied. The NT lower layer had the lowest value recorded.
The highest NMUA was observed in the CT interrow upper layer and represents cumulative compaction (at the end of the agricultural cycle) by tillage operations, machinery traffic and meteorological conditions (dry-wet and freeze-thaw cycles). As shown in Table 3, there are no differences bet-ween the upper and lower layers for the two tillage systems.
Plotting 2-D macroporosity data vs. NMUA, CT and NT behaviour is observed to be different (Fig. 2). Conven-tional tillage shows a visible tendency to organize the sam-ples in two regions according to their position in the soil: – slices from the row upper layer have large 2-D
macro-porosity and a low number of macropores,
– slices from the interrow upper and lower layers are characterized by a large number of macropores but with smaller 2-D macroporosity. No differences are observed in NT slices, which show the most uniform pattern regardless of their position.
A higher NMUA suggests better distribution of the macropore space in the ploughed horizon, suggesting better conditions for air and water transmission within the horizon, although other parameters determine water infiltration or transmission of water (like continuity of pores, their aniso-tropy and orientation). In spite of that, and under the xeric climate conditions in the area, it also suggests better aeration of the ploughed horizon and, consequently, increased water loss in the upper layer. These results agree with those found by Josa and Hereter (2005), where NT water content in the near-surface soil was higher in late winter.
The mean macropore area (MPA) was calculated, and the CT/NT ratios were compared (Table 5). With NT, the MPA was very similar in all positions and ranged from 0.375 to 0.528 mm2, whereas with CT the range was wider, from 0.637 to 0.808 mm2(Table 4). On comparing the MPA ratio in CT and NT samples (Table 5), ploughed samples and upper layer samples both have a ratio very close to 1, that is, the two tillage systems have a very similar MPA (1:1.04), and the same may be said of the upper layer as a whole.
However, the two different positions in the upper layer show opposite behaviour. The ratio in the row was 1:0.74 (approximately 35% higher in CT than in NT), whereas in the interrow, the ratio was the reverse (1:1.82), and this mean was approximately 82% higher for NT. This result, to be consistent with those in the previous section, indicates that NT produces generally smaller 2D-macroporosity than CT, or CT produces larger macropores than NT, because it is important to note that this variable does not provide absolute macroporosity values. These results can also be explained by the plots in Fig. 2. The two approaches are consistent and coherent. Then the macropore area in the NT interrow (less affected by tillage operations) is larger than with CT. It could also indicate an increase of faunal activity in this position (upper NT layer).
Set of samples
Conventional tillage No tillage Statistical test and P-value
N Mean SD Med Range N Mean SD Med Range t F WMW AB K
Ploughed 31 0.708 0.271 0.628 0.904 35 0.493 0.176 0.501 0.773 <0.001 0.020
Upper layer 25 0.719 0.294 0.628 0.904 27 0.528 0.159 0.506 0.649 0.007 0.003
Lower layer 6 0.664 0.150 0.633 0.353 8 0.375 0.119 0.369 0.470 0.029 0.899 0.714
UL row 13 0.637 0.294 0.568 0.900 14 0.535 0.183 0.484 0.642 0.616 0.924 0.979
UL interrow 12 0.808 0.279 0.842 0.880 13 0.520 0.136 0.555 0.442 0.011 0.104 0.187
Explanations as in Table 2.
The means were 1.383 and 1.532 Mg m-3for CT and NT, respectively, and the absolute extremes were 1.132 and 1.714 Mg m-3for CT, and 1.219 and 1.816 Mg m-3for NT (total porosity range from 32 to 57%). In all positions and groups of samples, the NT values were higher than their CT counterparts (Table 6). Significant differences were obser-ved in tillage systems and upper layers. The lower bulk density found for CT compared to NT was significant (pooled t-test).
When the nonparametric tests were used, because there were few data, significance was higher in the row and inter-row positions (WMW).
The same was true for the upper layer and the interrow with the nonparametric test (WMW). Similar differences between CT and NT have been reported by several authors in connection with the cultivation of maize during the growing season (Katsvairoet al., 2002), soybean (Timlinet al., 2001) and other cereals (Casselet al., 1995; Hill, 1990). Some of these effects are considered to be transitory in view of the instability of the aggregates and larger pores which collapse from rain and machinery traffic (Hammel, 1998).
This lower bulk density with CT can be attributed to soil behaviour in the upper and lower layers of the interrow. The upper interrow layer behaved differently depending on the tillage system. The bulk density of the interrow position was significantly higher in NT than in CT (Table 6). The distur-bance caused by seed drill coulters during drilling was suffi-cient to attenuate or eliminate this difference within row (growing positions of plants). This effect disappeared when compared independently to the row and interrow positions in each treatment (Table 3).
Similar results were found by Vervoortet al. (2001) who report irregular response of soil properties affecting infiltration, runoff, erosion and solute movement between the compacted wheel track and plant growing positions.
With both systems, significant differences were obser-ved between the upper and the lower layer (Table 3). Both systems favour stratification in the top centimetres of the soil. The upper layer was significantly more porous than the lower layer, in which no significant differences were
No Tillage
0.00 0.50 1.00 1.50
0.00 0.20 0.40 0.60 0.80
2-D macroporosity (2-D macropores mm-2)
(m
a
c
ro
p
o
re
s
m
m
)
Fig. 2.Scatter plots of the number of macropores per total surface area analyzed (NMUA) vs. 2D-macroporosity (mm2macropores mm-2surface area analyzed) for: a – conventional tillage, b – no tillage systems.
Convetional Tillage
0 .00 0 .50 1 .00 1 .50
0.0 0 0.20 0.40 0.60 0.80
2 -D m ac ropo ros ity (2 -D m ac ro pore s m m-2
)
N
u
m
b
e
r
o
f
m
a
c
ro
p
o
re
s
p
e
r
u
n
it
a
re
a
(m
a
c
ro
p
o
re
s
m
m
-2)
a
Set of samples Mean macropore areaCT/CT : NT/CT
Ploughed horizon 1: 1.04
Upper layer of ploughed horizon 1:1.10
Upper layer of row 1:0.74
Upper layer of interrow 1:1.82
Lower layer of ploughed horizon 1:0.84 T a b l e 5.Mean macropore area ratio
2-D macroporosity
NMUA
NMUA
Set of samples
Conventional tillage No tillage Statistical test and P-value
N Mean SD Med Range N Mean SD Med Range t F WMW AB K
Ploughed 31 1.38 0.19 1.36 0.582 35 1.53 0.16 1.54 0.597 <0.001 0.395
Upper L 25 1.29 0.12 1.25 0.432 27 1.45 0.12 1.46 0.457 <0.001 0.939
Lower L 6 1.63 0.06 1.64 0.156 8 1.67 0.12 1.69 0.375 0.330 0.063 0.221
Row 13 1.28 0.13 1.23 0.411 14 1.4 0.12 1.37 0.105 0.077 0.434 0.567
Interrow 12 1.32 0.13 1.32 0.419 13 1.46 0.11 1.5 0.321 0.019 0.941 0.339
Explanations as in Table 2.
observed between the two systems (Table 6). The reduction in porosity was more noticeable with CT (reduction of 25% over the upper layer) than with NT (18% reduction).
Horn (2004) reports a significantly lower bulk density in tilled horizons than in horizons under conservation systems or annual chisel ploughing. These differences are maintained up to a depth of 60 cm. Similar results were found by Wiermannet al. (2000) in silty soils. In their case,
the increase in bulk density started at a depth of 10 cm, whereas in our case it started at approximately 5 to 7 cm, de-pending on the tillage system.
As undisturbed samples were collected after harvesting, when the soil had been exposed to several intense wetting-drying cycles, these results must be considered as a cumula-tive effect of tillage. In spite of this, water stress from top-soil, which is typical in this region, recurs annually in most drylands across the Mediterranean region.
CONCLUSIONS
1. Significant differences in the pore system were ob-served in the ploughed horizon after continuous application (over seven cycles) of two tillage systems in a legume-cereal rotation under dryland farming conditions in NE Spain.
2. Direct drilling with residue removal affects bulk density, macroporosity and mean macropore area in the top 10 cm of the soil. The upper layer has higher total porosity than the layer underneath, with both conventional tillage (CT) and no tillage (NT), though porosity is lower with no tillage (NT) than conventional tillage (CT), and conse-quently, physical conditions are less favourable (lower 2-D macroporosity, smaller mean macropore area (MPA) and higher bulk density).
3. Lack of tillage and limited residue incorporation are likely to be the main causes of larger 2-D porosity in the row than in the interrow.
4. Higher number of macropores per unit area (NMUA) observed with conventional tillage (CT) suggests better aeration of the ploughed horizon and, consequently, more favourable evaporation conditions in the ploughed horizon with this tillage system. Continual simultaneous application of no-tillage and residue removal may have caused a de-crease in the number of macropores per unit area (NMUA) in the ploughed horizon, even though stubble was left in place.
5. As conditionsfavourable to soil erosion can occur even though stubble is present on the soil surface, it is suggested that detailed studies relating no tillage (NT) to residue removal, crop production and soil erosion over long periods in Mediterranean areas be carried out in order to better understand the effects of this tillage system.
REFERENCES
Bescansa P., Imaz J.M., Virto I. Enrique A., and Hoogmoed W.B., 2006.Soil water retention as affected by tillage and residue management in semiarid Spain. Soil Till. Res., 87, 19-27.
Blake G.R. and Hartge K.H., 1986.Bulk density. In: Methods of Soil Analysis (Ed. A. Klute). ASA SSSA Press, Madison, WI, USA.
Brewer R., 1964.Fabric and Mineral Analysis of Soils. Wiley Press, New York, USA.
Bullock P. and Murphy C.P., 1976.The microscopic examina-tion of the structure of sub-surface horizons of soils. Outlook Agr., 8, 348-354.
Cassel D.K., Raczkowski C.W., and Denton H.P., 1995.Tillage effects on corn production and soil physical properties. Soil Sci. Soc. Am. J., 59, 1436-1443.
Commission European Community, 1985. Directorate-general Information on Market and Innovation. Soil Map of the European Communities 1:1000000. UE, Luxembourg. Czy¿ E.A. and Dexter A.R., 2008.Soil physical properties under
winter wheat grown with different tillages systems at selec-ted locations. Int. Agrophysics, 22, 191-200.
Dohnal M., Dusek J., Vogel T., Císlerová M., Lichner L., and Stekauerová V., 2009.Ponded infiltration into soil with biopores – field experiment and modelling. Biologia, 64, 580-584.
Edwards W.M., Shipitalo M.J. and Norton L.D., 1988. Contri-bution of macroporosity to infiltration into a continuous corn no-tilled watershed: implications for contaminant move-ment. J. Contaminant Hydrol., 3, 205- 193
Farkas C., Birkás M., and Várallyay G., 2009. Soil tillage systems to reduce the harmful effect of extreme weather and hydrological situations. Biologia, 64, 624-628.
Gajda A.M., 2008.Effect of different tillage systems on some microbiological properties of soils under winter wheat. Int. Agrophysics, 22, 201-208.
Greenland D.J., 1977.Soil damage by intensive arable cultivation: temporary or permanent? Philos. Trans. R. Soc. London, 281, 193-208.
Hammel J.E., 1998.Long-term tillage and crop rotation effects on bulk density and soil impedance in Northern Idaho. Soil Sci. Soc. Am. J., 53, 1515-1519.
Hill R.L., 1990. Long-term conventional and no tillage effects on selected soil physical properties. Soil Sci. Soc. Am. J., 54, 161-166.
Hill R.L., Horton R., and Cruse R.M., 1985. Tillage effects on soil water retention and pore size distribution of two Molli-sols. Soil Sci. Soc. Am., J. 49, 1264-1270.
Horn R., 2004.Time dependence of soil mechanical properties and pore functions for arable soils. Soil Sci. Soc. Am. J., 68, 1131-1137.
IEC,2005.Statistical Yearbook of Catalonia 2005 (in Catalan). Institute of Statistics of Catalonia, Barcelona, Spain. INE,2007.http://www.ine.es/inebase/cgi/axi (04/01/2007) ITGE, 1993. Geological Map of Spain (1:50000) (in Spanish).
Jongerius A., 1957.Morphological investigations on the soil structu-re (in Dutch). Meded. Found. Land Surv., Bodenk. Studies, 2, Wageningen, the Netherlands.
Josa R. and Hereter A., 2005.Effects of tillage systems in dryland farming on near-surface water content during the late winter period. Soil Till. Res., 82, 173-183.
Josa R., Valero J., and Alborná S., 1998.Influence of cultivation system and the relief on the water content of the Ap horizon of land subject to different use. Nutr. Cycl. Agroecosyst., 50, 183-285.
KatsvairoT., Cox W.J., and Van Es H., 2002.Tillage and rotation effects on soil physical characteristics. Agron. J., 94, 299-304. Kay B.D. and VandenBygaart A.J., 2002.Conservation tillage and depth stratification of porosity and soil organic matter. Soil Till. Res., 66, 107-118.
Lafeber D., 1965.The graphical representation of planar pore pat-terns in soils. Australian J. Soil Res., 3, 143-164.
Lampurlanés J. and Cantero-Martínez C., 2006.Hydraulic con-ductivity, residue cover and soil surface roughness under different tillage systems in semiarid conditions. Soil Till. Res., 85, 13-26.
Larson W.E., 1979.Crop residues: energy production or erosion control? J. Soil Water Cons., 34, 74-76.
Lin H.S., McInnes K.J., Wilding L.P., and Hallmarck C.T., 1996. Effective porosity and flow rate with infiltration at low ten-sions into well-structured subsoil. Trans. ASAE, 39, 131-133. Lipiec J., Kuœ J., S³owiñska-Jurkiewicz A., and Nosalewicz A., 2006.Soil porosity and water infiltration as influenced by tillage methods. Soil Till. Res., 89, 210-220.
Mallants D., Mohanty B.P., Vervoort A., and Feyen J., 1997. Spatial analysis of saturated hydraulic conductivity in a soil with macropores. Soil Technol., 10, 115-131.
Mas M.T. and Verdú A.M.C., 2003.Tillage system effects on weed communities in a 4-year crop rotation under Mediter-ranean dryland conditions. Soil Till. Res., 74, 15-24. Micucci F.G. and Taboada M.A., 2006.Soil physical properties
and soybean (Glicine max, Merrill) root abundance in con-ventionally- and zero-tilled soil in the humid Pampas of Argentina. Soil Till. Res., 86, 152-162.
Montgomery D.C. and Runger G.C., 2003.Applied Statistics and Probability for Engineers. Wiley Press, New York, USA. Pagliai M., 1988. Soil porosity aspects. Int. Agrophysics, 4,
215-232.
Pagliai M., Marsili A., Servadio P., Vignozzi N., and Pellegrini S., 2003.Changes in some physical properties of a clay soil in Central Italy following the passage of rubber tracked and wheel-ed tractors of mwheel-edium power. Soil Till. Res., 73, 119-129.
Panini T., Torri D., Pellegrini S., Pagliai M., and Salvador San-chos M.P., 1997.A theoretical approach to soil porosity and sealing development using simulated rainstorms. Catena, 31, 199-218.
Raducu D., Vigonzzi N., Pagliai M., and Petcu G., 2002.Soil stru-cture of tilled horizons influenced by management practices and implement geometry. Basic Appl. Ecol., 35, 149-162. Rawls W.J., Brakenseik D.L., and Saxton K.E., 1982.
Estima-tion of soil water properties. Trans. ASAE, 25, 1316-1320. Ringrose-Voase A., 1990.One-dimensional image analysis of soil
structure. I. Principles. Eur. J. Soil Sci., 41, 499-512. SAS Institute, Inc.,1992.SAS/STAT User’s Guide Versión 6.08.
SAS Institute Inc., Cary, NC.
Sasal M.C., Andriulo A.E., and Taboada M.A., 2006.Soil poro-sity characteristics and water movement under zero tillage in silty soils in Argentinean Pampas. Soil Till. Res., 87, 9-18. Scott H.D., 2000.Soil Physics: Agricultural and Environmental Applications. Iowa State University Press, Ames, IO, USA. Shaver T.M., Peterson G.A., and Sherrod L.A., 2003.Cropping
intensification in dryland systems improves soil physical properties: regression relations. Geoderma, 116, 149-164. Timlin D., Pachepsky Y., and Reddy V.R., 2001.Soil water
dy-namics in row and interrow positions in soybean (Glycine maxL.). Plant Soil, 237, 25-35.
Torrentó J.R. and Solé A., 1992.Soil microporosity evaluated by a fast image-analysis technique in differently managed soils. Comun. Soil Sci. Plant Anal., 23, 1224-1229.
Tóth E., Koó S., and Farkas C., 2009.Soil carbon dioxide efflux determined from large undisturbed soil cores collected in different soil management systems. Biologia, 64, 643-647. UNESCO,1977.World Map of Desertification. United Nations
Conf. Desertification, August 29 - September 9, Nairobi, Kenya.
Unger P.W., Stewart B.A., Parr J.F., and Singh R.P., 1991.Crop management and tillage methods for conserving soil and wa-ter in semi-arid regions. Soil Till. Res., 20, 219-240. Vervoort R.W., Dabney S.M., and Römkens J.M., 2001.
Til-lage and row position effects on water and solute infiltration characteristics. Soil Sci. Soc. Am. J., 65, 1227-1234. Weiler M. and Naef F., 2003.An experimental tracer study of the
role of macropores in infiltration in grassland soils. Hydrol. Proc., 17, 477-493.