Please cite this article as: M. Kabiri Naeini, N. Bayati, Pattern Recognition in Control Chart Using Neural Network based on a New Statistical Feature, International Journal of Engineering (IJE), TRANSACTIONS C: Aspects Vol. 30, No. 9, (September 2017) 1372-1380
International Journal of Engineering
J o u r n a l H o m e p a g e : w w w . i j e . i rPattern Recognition in Control Chart Using Neural Network based on a New
Statistical Feature
M. Kabiri Naeini*a, N. Bayatib
a Department of Industrial Engineering, Faculty of Engineering University of Payam Noor, Yazd center, Iran b Department of Industrial Engineering, Payam Noor University, North Tehran branch, Iran
P A P E R I N F O
Paper history: Received 21 January 2017
Received in revised form 23 May 2017 Accepted 07 July 2017
Keywords: Control Chart Pattern Recognition Neural Network Statistical Feature
A B S T R A C T
Today for the expedition of the identification and timely correction of process deviations, it is necessary to use advanced techniques to minimize the costs of production of defective products. In this way control charts as one of the important tools for the statistical process control in combination with modern tools such as artificial neural networks have been used. The artificial neural networks were used to recognize the pattern in control charts in several research. Two procedures were used based on the raw data and feature for training and application of neural network. This paper presented new statistical features besides the investigation of their efficiency by application of a neural network. The simulation results demonstrated the positive effect of the presented statistical feature on neural network performance.
doi: 10.5829/idosi.ije.2017.30.09c.10
1. INTRODUCTION1
Statistical process control (SPC) technology, which was invented by Shewhart in 1994, has been used in the control widely as a monitor methodology of process quality. The objective of statistical process control (SPC) charts is to detect out-of-control signals indicating the existence of special causes that affect the process stability by providing a visual indication of the behavior of critical quality variables. In fact, Shewhart chart scheme tests the hypothesis that the process is still in control [1].
In general, six based CCPs are used to analyzed the abnormal patterns, including normal (NOR), cyclic (CC), increasing trend (IT), decreasing trend (DT), upward shift (US) and downward shift (DS) [2].
The increase in demand for faster delivery and highly precise products has led manufacturing systems to move towards becoming more flexible, integrated and intelligent. Traditional statistical process control (SPC) monitoring and diagnosis approaches are in sufficient to cope with these new developments.
*Corresponding Author’s Email: [email protected] (M.
Kabiri Naeini)
With the development of computer technology, artificial neural networks (ANN) are frequently used in control chart patterns recognition [3-18]. However, ANN needs “good” and “large” training samples and hence significant computation time is inevitable.
Feature extraction plays an important role in CCPs recognition. A smaller data size can lead to faster training and more efficiency [19]. Regarding this, features-based control chart recognition method was proposed. Ranaee and Ebrahimzade used both shape features and statistical features as the data input. Their results show that this method is good for control chart recognition [20].
Gauri and Chakraborty [21, 22], performed a strong study on different kinds of useful potential shape features to recognize pattern in control chart.
Other artificial intelligence techniques like support vector machine and fuzzy logic used in some researches [23-26].
will be investigated. This probability update and calculate based on the received observations from process. In the next step, the belief variable will be used as new statistical feature for neural network.
2. THE BELIEF VARIABLE AND IT’S CALCULATION METHOD
As we have presented in [28], in the proposed method the CCP recognition is looked as a decision making problem to select one member of the alternatives set. Assume the control chart pattern,(Patternx). The pattern is unknown, but we know it belongs to a candidate set S {P ii; 1, 2,3, 4} where the values of i represent normal, trend, shift and cycle respectively. The objective is to identify (Patternx) from the set of four candidate patterns. The presented method selects a member of S which its probability of presence is both greater than other members’ probability and a lower bound.
For an observation window of size n, we estimate the pattern parameters using the Maximum Likelihood Estimation. Then, using estimated pattern parameters, we eliminate the effect of considered pattern assignable cause to reach normal distributed data. Now, we can calculate the beliefs on patterns by using the Bayes theorem to calculate the posterior beliefs from the prior ones. Now by identifying the maximum belief, we select maximum belief’s regarding pattern for (Patternx). The neural network is trained by this feature and recognizes the pattern.
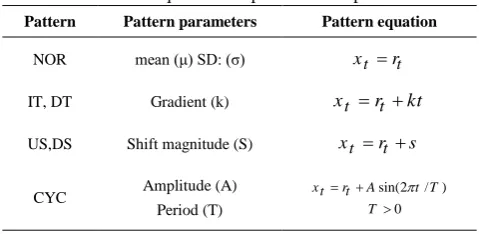
The patterns equations are mentioned in Table 1 where xt represents the tth process observation. Since for the in-control process xt follows a normal distribution with mean and variance 2, in case of each pattern, by subtracting the pattern part from the observation data, the remainder value (xt) is a normal random variable with known parameters and 2, as presented in Equations (1-4):
At each iteration of data gathering process, beliefs are calculated and updated using a recursive equation based on Bayes’ Rule.
TABLE 1. Equation and parameters of patterns
Pattern equation Pattern parameters
Pattern
t t
x r mean (μ) SD: (σ)
NOR
t t
x r kt
Gradient (k) IT, DT
t t
x r s Shift magnitude (S)
US,DS
sin(2 / ) 0 xt rt A t T
T Amplitude (A) Period (T) CYC
Now, using tth observations vector, MLE of pattern parameters could be obtained using Equations (5-8) [27].
2
ˆ ( )
( 1) k x t (5) ˆ
s x (6)
1
2 1
2
sin( )( )
ˆ
2
sin ( )
t i i t i i x T A i T
(7) 1 1 2 1 2sin( )( )
ˆ
cos(2 / )[(x )
2
sin ( )
ˆ
sin(2 / )] 0
t i i t i i t i i x T i T i T i T
(8)Assume we have the tth observations vector Ot. The belief on Pi to be the desired pattern, on the basis of the information obtained from the observations up to this point, is defined as follows:
( ) : { | }
i t r x i t
B o P Pattern P O
After (t1) observations, assume the decision is to
continue. After taking a new observation,
1 1 2
, ( , ) ( , ,..., )
t t t t t
x O O x x x x is the observations
vector on the quality characteristic of the current and the previous t 1 iterations. Thus, using Bayes formula, the beliefs Bi(x Ot, t1) can be determined by the following recursive equation. 1 1 4 1 1 1 1 4 1 1 1
{ | O } { | }
( , )
{ } }P { | }
( ) { | }
( }P { | }
r i t r t i i t t
r j t r t j j
i t t r t j
j t t r t j j
P P P x P
B x O
P P O x P
B x O P x P
B x O x P
(9)In Equation (9), we need to calculate the probability 1
{ | , } { | }
r t i t r t i
P x P O P x P . We have:
2
2/2
{ | } (1 2 ) ( )
r it i e it
P r P r (10)
1t t
r x (1)
2t t
r x kt (2)
3t t
r x s (3)
4
2
sin( )
t t
t
r x A
T
TABLE 2. parameters for simulating SPC chart
Pattern type Parameters (in terms of σ)
NOR mean:
SD:
0 1
UT gradient: 0.075-0.1
DT gradient: -0.1 to -0.075
US shift magnitude: 0.7-1.5
DS shift magnitude: -1.5 to -0.7
CYC Amplitude:
Period:
0.5-1.5
8
Hence, the detection and classification of control chart patterns at iteration t can be achieved by employing the following algorithm.
Step 1: Estimate the patterns parameters using Equations (5-8).
Step 2: Determine the residuals, rit , using Equations (1-4).
Step 3: Calculate and update the beliefs recursively using
2/2
2/2
( )
, 1
( )
4 , 1 1
(1 / 2 )
(1 / 2 )
it
it r i t
it
r j t
j
B e
B
B e
0.25 1,0 2,0 3,0 4,0
B B B B
Step 4: Find the greatest belief, Bg t, where
, ( ) { ( );i 1, 2, 3, 4}
g t g t i t
B B O Max B O .
Step 5: Check for stopping condition: if Bg t, is greater
than , then conclude that pattern Pg exists and finish the process. If g is 2 or 3, then look at the sign of the current regarded pattern parameters and decide whether the pattern is increasing (upward) or decreasing (downward). For example if g 2 and ˆk 0.085 , conclude that decreasing trend exists in the process. If
,
g t
B is not greater than , without having any selection at this iteration, take a new observation (xt1) and return to Step 1. The suitable value of could be determined based on type I and type II errors using simulation experiments.
3. SAMPLE PATTERNS
To supply sample patterns as the consequence of other research, simulation data are used by the application of Swift [5] methodology. Each sample pattern consists of 20 subgroup averages of time sequence data with a sample size of five. The applied parameters in simulation are demonstrated in Table 2. The values of
these parameters were varied randomly in a uniform manner between the limits shown. It is assumed that only one fundamental period exists for cyclic patterns, and a sudden shift only appears in the middle of an observation window. A total of 2160 and 3600 sample patterns are used in the training and recall phases, respectively.
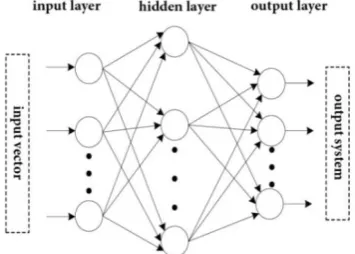
4. DESIGNING OF SYSTEM
The system is developed based on the multilayer perceptrons (MLP) architecture (Figure 1). The number of nodes in input layer while using raw data equal the size of observations window (20), while using feature equals the number of features (6). The number of output nodes is determined based on the pattern classes (6). The number of nodes in hidden layer is determined by trial and error. Therefore, ANN structures are selected for raw input and feature input as 6×6×6 and 20×6×6, respectively. Since this study used the supervised training approach, each pattern presentation is tagged with its respective label. The labels, shown in Table 3, are the targeted values for the recognizers output nodes. The selected algorithm for network is the descending gradient algorithm with momentum and comparative learning rate. The network performance is measured using the mean squared error (MSE).
The activation function for hidden layer is hyperbolic tangent and for output layer is linear. The
hyperbolic tangent function is given by
( ) x x/ x x
f x e e e e with output range from -1 to +1.
4. 1. Training Phase The procedure is started with the generation and presentation of process data to the observations window. The performed preprocessing for raw data does as normalization of them, that their values put in [-1, 1] range. In contrast, the probable features that extracted from data gain the value of [0, 1].
TABLE 3. targeted recognizer outputs
Pattern
class Description
Targeted recognizer outputs
Node
1 2 3 4 5 6
1 NOR 0.9 0.1 0.1 0.1 0.1 0.1
2 UT 0.1 0.9 0.1 0.1 0.1 0.1
3 DT 0.1 0.1 0.9 0.1 0.1 0.1
4 US 0.1 0.1 0.1 0.9 0.1 0.1
5 DS 0.1 0.1 0.1 0.1 0.9 0.1
6 CYC 0.1 0.1 0.1 0.1 0.1 0.9
The remainder of the process is same for two procedures. Before the sample data are presented to the ANN for the learning process, it is divided into training (60%), validation (20%) and preliminary testing (20%) sets.
These sample sets are the randomized to avoid possible bias in the presentation order of the sample patterns of the ANN. The training procedure is conducted iteratively covering ANN learning, validation of in-training ANN and preliminary testing. During learning, a training data set (2160 patterns) is used for updating the network weights and biases. The ANN is then subjected to in-training validation using the validation data set (720 patterns) for early stopping to avoid overfitting.
The error on the validation set will typically begin to rise when the network begins to over-fit the data, the training process is stopped when the validation error increases for a specified number of iterations. In this study, the maximum number of validation failures in set to five iterations. The ANN is then subjected to preliminary performance tests using the testing data set (720 patterns). The testing set errors are not used for updating the network weights and biases. However, the results from the preliminary tests in terms of percentage of correct classification and the test set errors are used as acceptance criteria of the trained recognizers. In other words, the decision on either to accept the trained recognizers or to allow for retraining is made based on these preliminary performance tests. The training stops whenever one of the following stopping criteria is satisfied: the performance error goal is achieved, the maximum allowable number of training epochs is met or the maximum number of validation failures is exceeded (validation test). Once the training has stopped, the trained recognizer is evaluated for acceptance.
The acceptance criteria as given in Table 4 are compared with the recognizer’s preliminary performance results. The recognizer would be retrained using a totally new data set if its performance remained poor. This procedure is intended to minimize the effect
of poor training sets. Each type of recognizer (statistical features input and raw data input) is replicated by exposing them to 10 different training cycles, giving rise to 10 different trained recognizers for each type. These recognizers are labelled 1.1-1.10 in Table 5 and 2.1-2.10 in Table 6 for the raw data and statistical features input, respectively. All 10 recognizers in each type have the same architecture and differ only in the training data sets used. The Recognizer 1.j and Recognizer 2.j for j = 1, 2… 10, are trained using the same training data set.
4. 2. Recall or Recognition Phase Once accepted, the trained recognizer is tested (recall phase) using 10 different sets of fresh totally unseen data sets.
5. THE SUGGESTED MODEL PERFORMANCE
The belief indicator can be used as an extracted feature from raw data in teaching of systems based on learning such as CCPR based on ANN. In a form that for example neural network is trained by this feature instead of using raw data. This feature is called the probability feature. The assumption test is used in order to investigate the efficiency of the probable feature in significant improvement in operation and neural network generalization. The research hypothesis is defined as follows:
The neural network based on the probable feature has the better operation and generalizability than the network based on the raw data in spite of its smaller size. ”Generalization” means the system strength in correct recognition of the pattern that does not include the training examples. In this investigation, “equal” means assumption test is used when the observations are paired. In fact, we want the effective factors on operation be fix except g\for one of the two networks based on the probable feature and raw data. Because, if the experience does not design carefully, it probably presents wrong results in a way that the obvious difference of networks operation is affected by other factors.
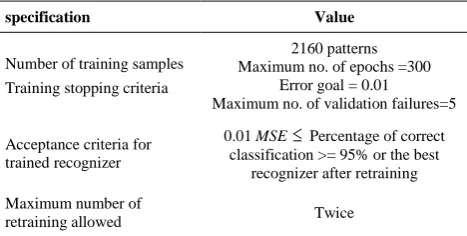
TABLE 4. training specifications
Value specification
2160 patterns Maximum no. of epochs =300
Error goal = 0.01
Maximum no. of validation failures=5 Number of training samples
Training stopping criteria
0.01 MSE Percentage of correct
classification >= 95% or the best recognizer after retraining Acceptance criteria for
trained recognizer
Twice Maximum number of
In order to avoid such a bias, we use two solutions of control and randomization of the experience. In other that observations are produced in pair form, and each pair in same empirical condition is related to main factors, and conditions changing from one pair to another. In non-major factors a randomization occurs and these factors randomly are related to sampling. Therefore, two networks, with the same random data are trained and tested with same random data.
6. DISCUSSION AND RESULT
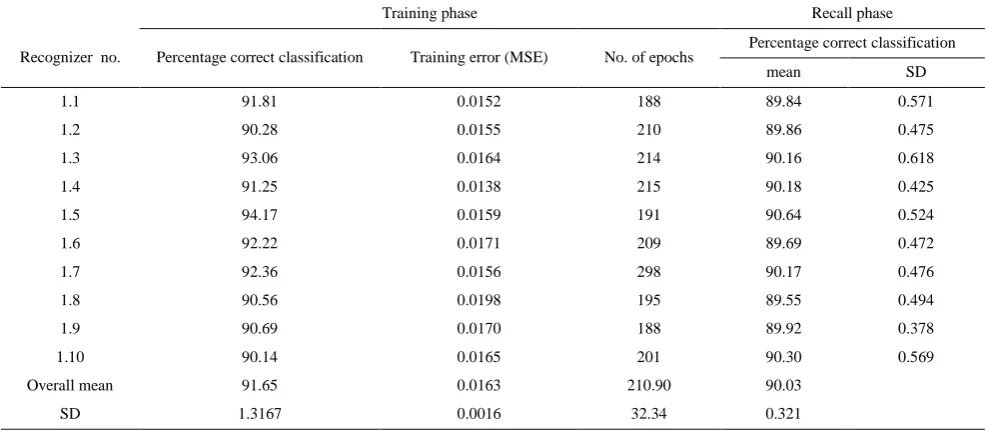
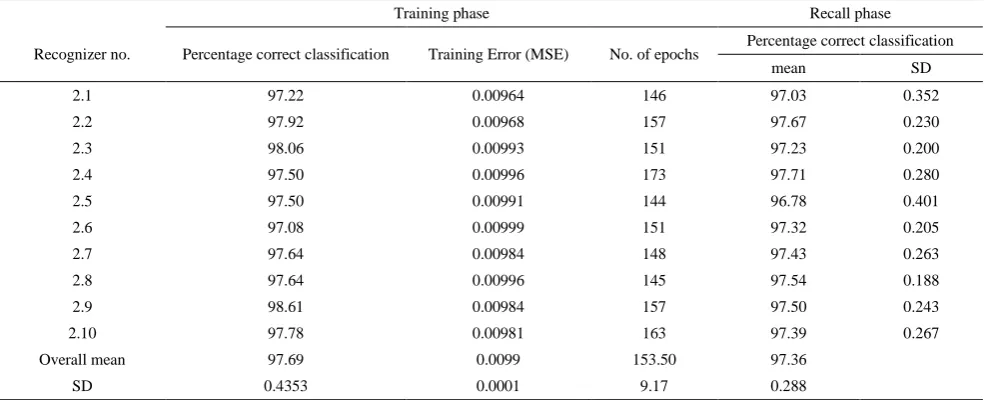
In this study the belief indicator is used as the extracted feature from raw data in training of artificial neural network. In this section, the operation results of two systems based on the raw data and based on the probable feature is compared. Tables 5 and 6 show the training and recall performance of the 10 raw data-based recognizers and the 10 feature recognizers, respectively. It is noted during training that feature-based recognizers are more easily trained. None of the feature-based recognizers required retraining, whilst all of the raw data- based recognizers required such retraining before they could be accepted. The overall mean percentages of correct recognition of raw- and feature- based recognizers are 90.03% and 97.36%, respectively.
The percentages ranged from 89.55% to 90.64% and from 96.87% to 97.67% for the raw data- and feature- based recognizers, respectively. The results for statistical significance tests are summarized in Table 7. Paired t-tests (α=0.01) are used for 10 pairs of raw data- and feature- based recognizers for their performance in terms of percent of correct classification and training error
(MSE). The result in Table 7 suggest that the difference in recognition accuracy between the types of recognizers is significant. This confirms that features as input data representation give better recognition performance compared with raw data. Also, the results shows that the difference between training errors is significant. This results indicates that more training efforts would be required if the raw data-based recognizer are to achieve the required error margin.
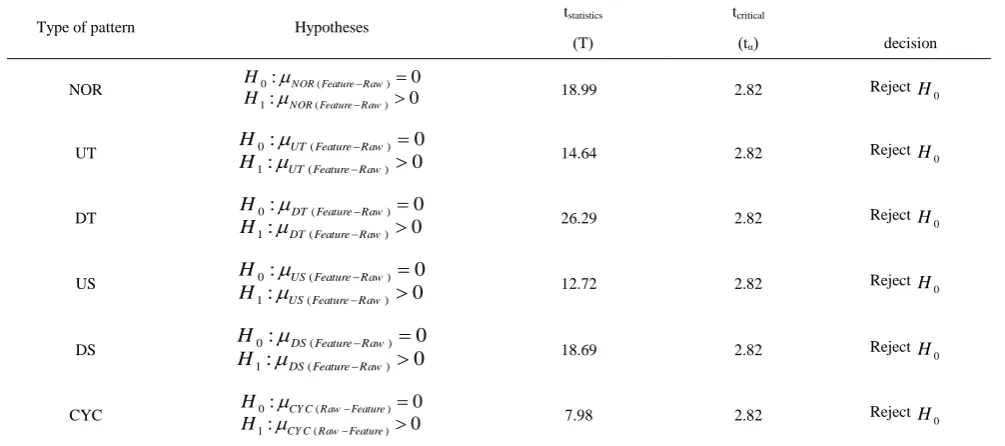
Confusion matrices, as given in Tables 8 and 9, provide the overall mean percentages for confusions among pattern classes for 10 raw data-based and 10 feature based recognizer, respectively. In confusion matrix, the main diagonal matrixes demonstrate the accurate recognition percentage and other matrices show the inaccurate recognition percentage. Both tables demonstrate the average of recognition percentage of 10 related systems. The comparative recognition performance of the respective 10 raw-based and 10 feature-based recognizers to correctly recognize different types of patterns are given in Table 10. The recognition performance for each type of pattern is compared statistically using paired t-tests (α=0.01) and the results are summarized in Table 11. These results clearly suggest that the feature-based recognizers are statistically less confused for 3 types of patterns (random, trend, shift) compared with the raw data-based recognizers. It means that it has more recognition accuracy. In cycle pattern we find that the system based on the raw data has better operation.
Therefore, the performed survey confirms that this probable feature improves the training and recalling process of network and increases the system recognition accuracy.
TABLE 5. training and recall performance for raw data –based recognizers
Recall phase Training phase
Percentage correct classification No. of epochs
Training error (MSE) Percentage correct classification
Recognizer no.
SD mean
0.571 89.84
188 0.0152
91.81 1.1
0.475 89.86
210 0.0155
90.28 1.2
0.618 90.16
214 0.0164
93.06 1.3
0.425 90.18
215 0.0138
91.25 1.4
0.524 90.64
191 0.0159
94.17 1.5
0.472 89.69
209 0.0171
92.22 1.6
0.476 90.17
298 0.0156
92.36 1.7
0.494 89.55
195 0.0198
90.56 1.8
0.378 89.92
188 0.0170
90.69 1.9
0.569 90.30
201 0.0165
90.14 1.10
90.03 210.90
0.0163 91.65
Overall mean
0.321 32.34
0.0016 1.3167
TABLE 6. training and recall performance for feature data-based recognizers
Recall phase Training phase
Percentage correct classification No. of epochs
Training Error (MSE) Percentage correct classification
Recognizer no. SD mean 0.352 97.03 146 0.00964 97.22 2.1 0.230 97.67 157 0.00968 97.92 2.2 0.200 97.23 151 0.00993 98.06 2.3 0.280 97.71 173 0.00996 97.50 2.4 0.401 96.78 144 0.00991 97.50 2.5 0.205 97.32 151 0.00999 97.08 2.6 0.263 97.43 148 0.00984 97.64 2.7 0.188 97.54 145 0.00996 97.64 2.8 0.243 97.50 157 0.00984 98.61 2.9 0.267 97.39 163 0.00981 97.78 2.10 97.36 153.50 0.0099 97.69 Overall mean 0.288 9.17 0.0001 0.4353 SD
TABLE 7. statistical significance tests for difference in performance
tcritical tstatistics Hypotheses Performance measure Decision ( tα ) ( T ) Reject 0 H 2.821 44.66
0 ( )
1 ( )
: 0
: 0
recall Feature Raw recall Feature Raw
H H Recall performance
Reject H0
2.821 13.25
0 ( )
1 ( )
: 0
: 0
MSE Raw Feature MSE Raw Feature
H H MSE
TABLE 8. mean percentage for confusion using raw data as the input vector
Pattern class identified by raw data-based recognizer
CYC DS US DT UT NOR 2.07 2.24 2.61 2.58 2.67 87.83 NOR
true pattern class
0.04 0.00 10.06 0.00 88.93 0.98 UT 0.01 9.51 0.00 89.61 0.00 0.87 DT 0.02 0.00 88.29 0.00 10.17 1.52 US 0.06 87.88 0.00 10.53 0.00 1.54 DS 97.65 0.10 0.02 0.06 0.08 2.10 CYC
TABLE 9. mean percentage for confusion using feature data as the input vector
Pattern class identified by feature data-based recognizer
CYC DS US DT UT NOR 0.05 0.03 0.04 0.00 0.00 99.88 NOR
true pattern class
TABLE 10.recognition performance of raw data-based and feature-based recognizers CYC DS US DT UT NOR feature raw feature raw feature raw feature raw feature raw feature raw Data set 91.78 97.17 96.93 85.48 97.37 85.75 98.33 91.92 97.78 90.70 99.95 88.02 1 95.68 97.20 97.55 86.62 97.60 88.63 97.88 90.22 97.48 89.67 99.83 86.85 2 93.35 98.17 97.25 87.90 96.92 89.12 97.88 89.85 98.00 87.83 99.98 88.10 3 95.78 97.83 97.67 86.00 97.98 87.37 97.57 90.13 97.60 88.08 99.67 91.67 4 92.50 97.63 97.05 90.32 97.25 90.47 96.83 88.20 97.07 88.18 99.97 89.02 5 91.90 97.73 98.47 88.77 98.02 90.48 98.03 88.02 97.63 87.45 99.88 85.68 6 93.25 98.17 97.87 88.98 97.62 87.45 97.48 89.88 98.42 91.07 99.95 85.48 7 94.13 97.42 97.63 87.68 97.98 90.40 97.97 89.28 97.67 85.28 99.83 87.22 8 94.85 97.18 97.55 87.38 97.32 83.35 97.65 89.60 97.73 91.98 99.92 90.02 9 94.37 97.98 96.97 89.63 97.33 89.83 97.92 89.03 97.90 89.02 99.83 86.28 10
TABLE 11. statistical significance test for recognition performance of raw data-based and feature-based recognizers
tcritical
tstatistics
Hypotheses Type of pattern
decision ( tα ) ( T ) Reject 0 H 2.82 18.99
0 ( )
1 ( )
: 0
: 0
NOR Feature Raw NOR Feature Raw
H H NOR
Reject H0
2.82 14.64
0 ( )
1 ( )
: 0
: 0
UT Feature Raw UT Feature Raw
H H
UT
Reject H0
2.82 26.29
0 ( )
1 ( )
: 0
: 0
DT Feature Raw DT Feature Raw
H H DT
Reject H0
2.82 12.72
0 ( )
1 ( )
: 0
: 0
US Feature Raw US Feature Raw
H H
USReject H0
2.82 18.69
0 ( )
1 ( )
: 0
: 0
DS Feature Raw DS Feature Raw
H H
DS Reject 0 H 2.82 7.980 ( )
1 ( )
: 0
: CY C RawCY C Raw FeatureFeature 0
H H CYC
7. SUGGESTIONS FOR FURTHER RESEARCH
1. In this study, the capability of procedure was investigated in 6 patterns recognition, next studies can investigate the other types of patterns such as systematic and classified treatment.
2. In this study, the efficiency of probable feature in neural network operation improvement in stable window state was confirmed. In subsequent research, the efficiency of probable feature in operation improvement of ANN in moving observation window state can be investigated.
8. REFERENCES
1. Hachicha, W. and Ghorbel, A., "A survey of control-chart
pattern-recognition literature (1991–2010) based on a new
conceptual classification scheme", Computers & Industrial
Engineering, Vol. 63, No. 1, (2012), 204-222.
2. Montgomery, D.C., "Introduction to statistical quality control,
John Wiley & Sons (New York), (2009).
3. Hwarng, H.B. and Hubele, N.F., "Back-propagation pattern
recognizers for x control charts: Methodology and
performance", Computers & Industrial Engineering, Vol. 24,
No. 2, (1993), 219-235.
4. Hwarng, H.B. and Hubele, N.F., "X control chart pattern
identification through efficient off-line neural network training",
5. Pham, D. and Oztemel, E., "Control chart pattern recognition
using learning vector quantization networks", The International
Journal of Production Research, Vol. 32, No. 3, (1994), 721-729.
6. Hwarng, H. and Chong, C., "Detecting process non-randomness
through a fast and cumulative learning art-based pattern
recognizer", International Journal of Production Research,
Vol. 33, No. 7, (1995), 1817-1833.
7. Pham, D.T. and Chan, A., "Unsupervised adaptive resonance
theory neural networks for control chart pattern recognition",
Proceedings of the Institution of Mechanical Engineers, Part B: Journal of Engineering Manufacture, Vol. 215, No. 1, (2001), 59-67.
8. Perry, M.B., Spoerre, J.K. and Velasco, T., "Control chart
pattern recognition using back propagation artificial neural
networks", International Journal of Production Research,
Vol. 39, No. 15, (2001), 3399-3418.
9. Pacella*, M., Semeraro, Q. and Anglani, A., "Adaptive
resonance theory-based neural algorithms for manufacturing
process quality control", International Journal of Production
Research, Vol. 42, No. 21, (2004), 4581-4607.
10. Al-Assaf, Y., "Recognition of control chart patterns using
multi-resolution wavelets analysis and neural networks☆", Computers
& Industrial Engineering, Vol. 47, No. 1, (2004), 17-29.
11. Guh, R.-S., "Optimizing feedforward neural networks for control chart pattern recognition through genetic algorithms",
International Journal of Pattern Recognition and Artificial Intelligence, Vol. 18, No. 02, (2004), 75-99.
12. Guh*, R.-S. and Shiue, Y.-R., "On-line identification of control
chart patterns using self-organizing approaches", International
Journal of Production Research, Vol. 43, No. 6, (2005), 1225-1254.
13. Wong, M., Jack, L. and Nandi, A., "Modified self-organising map for automated novelty detection applied to vibration signal
monitoring", Mechanical systems and signal processing, Vol.
20, No. 3, (2006), 593-610.
14. Cheng, H.-P. and Cheng, C.-S., "Control chart pattern
recognition using wavelet analysis and neural networks" Journal
of Quality, Vol. 16, No. 5, (2009), 311-321.
15. Jiang, P., Liu, D. and Zeng, Z., "Recognizing control chart
patterns with neural network and numerical fitting", Journal of
Intelligent Manufacturing, Vol. 20, No. 6, (2009), 625-635. 16. Ebrahimzadeh, A., Addeh, J. and Rahmani, Z., "Control chart
pattern recognition using k-mica clustering and neural
networks", ISA Transactions, Vol. 51, No. 1, (2012), 111-119.
17. Xanthopoulos, P. and Razzaghi, T., "A weighted support vector machine method for control chart pattern recognition",
Computers & Industrial Engineering, Vol. 70, (2014), 134-149.
18. Zhang, M., Cheng, W. and Guo, P., "Intelligent recognition of mixture control chart pattern based on quadratic feature
extraction and svm with ampso", Journal of Coastal Research,
Vol. 73, No. sp1, (2015), 304-309.
19. Ranaee, V. and Ebrahimzadeh, A., "Control chart pattern
recognition using a novel hybrid intelligent method", Applied
Soft Computing, Vol. 11, No. 2, (2011), 2676-2686.
20. Gauri, S.K. and Chakraborty, S., "A study on the various
features for effective control chart pattern recognition", The
International Journal of Advanced Manufacturing Technology, Vol. 34, No. 3, (2007), 385-398.
21. Gauri, S.K., "Control chart pattern recognition using
feature-based learning vector quantization", The International Journal
of Advanced Manufacturing Technology, Vol. 48, No. 9, (2010), 1061-1073.
22. Zhao, C., Wang, C., Hua, L., Liu, X., Zhang, Y. and Hu, H., "Recognition of control chart pattern using improved supervised
locally linear embedding and support vector machine", Procedia
Engineering, Vol. 174, No., (2017), 281-288.
23. Khormali, A. and Addeh, J., "A novel approach for recognition of control chart patterns: Type-2 fuzzy clustering optimized
support vector machine", ISA transactions, Vol. 63, No.,
(2016), 256-264.
24. De la Torre Gutierrez, H. and Pham, D., "Estimation and generation of training patterns for control chart pattern
recognition", Computers & Industrial Engineering, Vol. 95,
No., (2016), 72-82.
25. Shao, Y.E. and Chiu, C.-C., "Applying emerging soft computing approaches to control chart pattern recognition for an spc–epc
process", Neurocomputing, Vol. 201, (2016), 19-28.
26. Pelegrina, G.D., Duarte, L.T. and Jutten, C., "Blind source separation and feature extraction in concurrent control charts pattern recognition: Novel analyses and a comparison of
different methods", Computers & Industrial Engineering, Vol.
92, No., (2016), 105-114.
27. Kabiri naeini, M., Owlia, M.S. and Fallahnejad, M.S., "A new statistical approach for recognizing and classifying patterns of
x-bar control charts", International Journal of Engineering, Vol.
Pattern Recognition in Control Chart Using Neural Network based on a New
Statistical Feature
M. Kabiri Naeinia, N. Bayatib
a Department of Industrial Engineering, Faculty of Engineering University of Payam Noor, Yazd center, Iran b Department of Industrial Engineering, Payam Noor University, North Tehran branch, Iran
P A P E R I N F O
Paper history: Received 21 January 2017
Received in revised form 23 May 2017 Accepted 07 July 2017
Keywords: Control Chart Pattern Recognition Neural Network Statistical Feature
ديكچ ه
هب حلاصا و دنیارف تافارحنا ییاسانش رد عیرست یارب هزورما تسا مزلا نآ عقوم
نونف زا هتفرشیپ هنیزه ات دوش هدافتسا یا
-ریسم نیا رد .دسرب لقادح هب بویعم تلاوصحم دیلوت زا یشان یاه ،
لرتنک مهم یاهرازبا زا یکی ناونع هب لرتنکرادومن
هکبش نوچمه نردم یاهرازبا اب بیکرت رد دنیارف یرامآ سا هتفرگ رارق هدافتسا دروم یعونصم یبصع یاه
هکبش .ت یاه
شهوژپ رد لرتنک یاهرادومن رد وگلا صیخشت یارب یعونصم یبصع هتفرگ رارق هدافتسا دروم فلتخم یاه
یارب .دنا
،وگلا صیخشت رد یعونصم یبصع هکبش دربراک و شزومآ زا
هدافتسا یگژیو رب ینتبم و ماخ هداد رب ینتبم درکیور ود هدش
یگژیو یفرعم نمض هلاقم نیا رد .تسا یاه
هعلاطم یبصع هکبش زا هدافتسا اب وگلا صیخشت رد نآ ییاراک ،دیدج یرامآ
وتسا هدش هیبش جیاتن رب ار هدش هئارا یرامآ یگژیو تبثم ریثات یزاس یم ناشن یبصع هکبش درکلمع
.دهد