Computing research in South Africa: A
scientometric investigation
Douglas A. Parrya
aDepartment of Information Science, Stellenbosch University, South Africa
ABSTRACT
Limited attention has been afforded to mapping the ‘landscape’ of South African computing research. Prior studies have considered singular sub-disciplines, publications, or publication types. Given the growing prominence of computing disciplines, it is necessary to identify the patterns of research production, publication, collaboration, and impact of South African computing research. This study presents a scientometric investigation in this regard. Through the analysis of data accessed from the Scopus citation enhanced bibliographic database, the investigation presents findings in relation to annual research production, institutional differences in outputs, topics, collaboration, and citation impact. While characterised by institutional differences, over the period considered, South African computing research output has increased at a greater rate than that of South African research at large. Additionally, despite accounting for a greater proportion of all outputs, conference papers account for a smaller proportion of citations relative to journal articles or book chapters. Corresponding to previous investigations, there exists a tendency towards applied computing topics in contrast to more theoretical topics. Finally, the collaboration network was shown to be particularly de-centralised with many researchers clustered around institutions. The findings are of interest to all researchers conducting computing or related research in South Africa.
Keywords:South Africa, Computing Research, Scientometrics, Information Systems, Computer Science
Categories: •Applied computing∼ Digital libraries and archives•General and reference∼ Surveys and overviews
Email:
Douglas A. [email protected](CORRESPONDING)
Article history:
Received:8 Jan 2019
Accepted:14 Mar 2019
Available online:24 Jul 2019
1
INTRODUCTION
Over a decade ago Glass, Ramesh and Vessey (2004, p. 89) proclaimed the widespread notion of the “era of computing”, remarking that the primary means of advancing computing as an academic discipline is through research. In South Africa, while a proud tradition of computing research stretches back to the 1970s (Kourie, 2010), computing and related fields, as academic communities, are small in comparison to developed countries (Brown & Tanner, 2008). Computing is broadly recognised in accordance with the proposed constitution of the South African Institute of Computer Scientists and Information Technologists (SAICSIT) to include: Computer Engineering, Computer Science,
Parry, D. A. (2019). Computing research in South Africa: A scientometric investigation. South African Computer
Journal 31(1), 51–79.https://doi.org/10.18489/sacj.v31i1.674
Copyright © the author(s); published under aCreative Commons NonCommercial 4.0 License (CC BY-NC 4.0).
Information Systems, Information Technology and Software Engineering. While scientometric1
investigations of specific aspects of South African computing research have been conducted (e.g., Brown & Tanner, 2008; Kotzé & Van Der Merwe, 2009; Sanders & Alexander, 2015; Turpin, 2018), no comprehensive investigation broadly considering the landscape of South African computing research has been conducted. Supporting the value of such investigations, specifically referring toInformation
Systems(IS) as an academic discipline, Lowry, Romans and Curtis (2004, p. 1) affirm that “where and
how we publish are fundamental aspects of the identity of the IS field—reflecting our value systems, paradigms, cultural practices, reward systems, political hierarchy, and aspirations”. The same can be said for computing research in South Africa on the whole. At present, while different interpretations of computing abound, such research is dispersed across numerous diverse institutions, departments, associations, academic backgrounds, and traditions. While studies have investigated the nature of computing research in other countries (e.g., Galliers & Whitley, 2007; Pouloudi, Poulymenakou & Pramatari, 2012; Sellitto, 2007), at present, only limited or anecdotal indications of the current shape of computing research in South Africa exist.
1.1
Objectives, Scope, and Outline
The objective of this study is toidentify and describe the publication patterns in South African computing
research. A scientometric approach involving the analysis of research output was adopted to approach
the objective, with specific research questions presented in Section3.1. Perron et al. (2017, p. 802) argue that “scientometrics is essential to helping academic disciplines understand various aspects of their research efforts”. This includes considering the quality of research outputs, the productivity of researchers, the nature of research outputs, and the existence of collaboration networks, amongst other factors. Typically, scientometric investigations consider publication patterns within a specific domain, publication outlet, country, or institution. In this study, the analysis concerned the research outputs produced by researchers affiliated with South African universities for the period 2008 to 2017. In accordance with the Department of Higher Education and Training (DHET), a research output is understood as a report on an “original, systematic investigation undertaken in order to gain new knowledge and understanding” (Department of Higher Education and Training (DHET), 2015, p. 4). Four categories of output are recognised: journal articles, whole books, chapters in books, and published conference proceedings.
Given the broad and often divergent notions of what constitutes computing (Gruner, 2007), it is necessary to provide a brief definition to delineate the scope of this study. This task is hindered by the multifarious terms used to describe computing fields (e.g., Informatics,Computer Science,
Information Systemsetc.), the different domains in which computing is applied, and the sometimes
arbitrary distinctions between computing sub-disciplines. Indeed, theAssociation for Computing
Machinery(ACM) defines computing as “any goal-oriented activity requiring, benefiting from, or
creating computers” (Shackelford et al., 2006, p.9). The inclusivity of this definition prevents it
1Scientometrics, as a sub-discipline of Information Science, is broadly the quantitative study of scientific research
from providing a useful boundary for this study. A widely cited definition offered by theUniversity
of Edinburgh School of Informatics provides a more useful conceptualisation: “the central focus
of Informatics is the transformation of information—whether by computation or communication, whether by organisms or artefacts” (University of Edinburgh School of Informatics, 2016). This definition, while still broad, emphasizes both the technical and the cognitive aspects of computing or informatics. Consequently, while the artefact of computation should, of course, be a focus of computing, a broader frame is necessary. Accepting that there is no one perfect conceptualisation for computing and, by extension, computing research, the widely adopted (and de facto standard)
ACMComputing Classification System20122 was adopted in this study. This classification system
outlines 13 high-level categories broadly reflective of the gamut of the computing discipline, with each category containing at least four sub-levels.3
To follow, background to this study is provided by briefly reviewing five previous investigations of South African computing research. Thereafter, the specific research questions and data collection, processing, and analysis methodologies are outlined. Next, the findings of this investigation are presented in Section4, followed by a discussion thereof in Section5.
2
RELATED WORK
Five previous studies in this regard have been conducted. All five, however, focus on specific domains, publication sources, or types of publications. To provide background for the present investigation the contributions of each of these studies are briefly outlined.
Brown and Tanner (2008) investigated the international visibility of South African IS research. Considering journal publications in 50 top IS-centric journals for the period 2003 to 2007, these authors found that only 39 articles in 19 of the top-50 journals were authored by researchers affiliated with South African institutions. Noting the diminutive nature of this total, the authors considered South African-affiliated research published in a broader range of IS-centric journals. While no indication of totals was provided, Brown and Tanner (2008, p. 16) contend that “just as many, if not more articles were published outside of the top 50 ranked IS-centric journals”. Three further trends during this period were noted. First, publications in higher ranked journals were typically conducted in collaboration with international researchers not affiliated with South African institutions. Second, seven key research themes were identified: (i) IS Management and Knowledge Management, (ii) IS and National Development, (iii) Education and Research, (iv) IS Projects and Systems Development, (v) Web and e-Commerce, (vi) Decision Making, and (vii) Mobile Applications. The third trend concerned institutional differences. A majority of publications considered were found to be attributable to researchers affiliated with just two institutions —The University of Cape Town
(UCT) andWitwatersrand University(Wits).
2https://www.acm.org/publications/class-2012.
3General and reference, Hardware, Computer systems organization, Networks, Software and its engineering, Theory
In the following year Kotzé and Van Der Merwe (2009) considered the research foci of articles published in theSouth African Computer Journal(SACJ) from 1990 to 2008. Using the 1998 version of the ACMComputing Classification System4 Kotzé and Van Der Merwe (2009) classified all 344 articles into 11 categories, finding that research within only four categories —Computing Milieux (21.22%), Software (19.48%), Information Systems (16.57%), and Computing Methodologies (15.9%)— accounted for more than 73% of SACJ publications during this period. The researchers note that there had been a shift towards applied computing fields in contrast to research with a more theoretical direction. Supporting this, the most prominent sub-categories included: Management of Computing and Information Systems, Computers and Society, Computers and Education, and Software Engineering. Kotzé and Van Der Merwe (2009) also considered institutional differences in publication patterns, finding that researchers affiliated with three institutions —UCT, Wits and the
University of Pretoria(UP)— accounted for a majority of publications.
More recently Sanders and Alexander (2015) considered computing-related doctorates produced at South African universities between 1978 and 2014. The researchers found that, over this period, 391 doctorates in computing fields have been awarded, increasing from 59 in 2000-2004 to 161 in 2010-2014. Sanders and Alexander (2015) note that this increase (173%) is greater than that observed for all doctorates in South Africa (125%) (Cloete, Sheppard & Bailey, 2015). As with previous investigations institutional differences in output were considered. In contrast to previous studies, however, the researchers did not identify any institutions in this analysis. Despite this, it was shown that six universities accounted for over 60% of computing doctorates in this period. To analyse research themes, Sanders and Alexander (2015) separated all doctorates into three categories —IS (104), CS (208), and ‘other’ (79)— only considering those in either IS or CS. For both domains, in the same manner as Kotzé and Van Der Merwe (2009), Sanders and Alexander (2015) used the ACMComputing Classification System5 to assign topics to each doctorate. For IS doctorates, professional topics (computing industry, management of computing and IS, history of computing, computing education, computing profession) were the most prominent category, followed by ICT for Development (ICT4D), education, enterprise computing, and adoption related topics. Corresponding to earlier findings indicating that research published by SACJ is shifting towards applied topics (Kotzé & Van Der Merwe, 2009), these prominent themes are all resemblant of applied aspects of computing research. For CS doctorates, model development and analysis topics were the most prominent category, followed by machine learning, artificial intelligence (AI), software creation and management, professional, human computer interaction (HCI), and algorithm design and analysis topics. Interestingly, Sanders and Alexander (2015) found there to be a considerable overlap in themes across IS and CS doctorates. For instance, computing education, software creation and management were evident across disciplines.
Extending from the prominence of research in ICT4D Turpin (2018) investigated the state of South African research outputs within this sub-discipline. Publications in three leading ICT4D
4ACM:https://www.acm.org/publications/computing-classification-system/1998/ccs98
5While Kotzé and Van Der Merwe (2009) used the 1998 edition of this classification system, Sanders and Alexander
journals6 were reviewed for the period 2006 to 2015 to identify articles authored by researchers
affiliated with South African institutions. In the period considered 58 articles met this requirement. As with previous reviews of South African computing research, institutional differences were found, with UCT accounting for the largest proportion of ICT4D output in these three journals, followed by UP,Cape Peninsula University of Technology(CPUT), andRhodes University(RU). To categorise publications Turpin (2018) developed her own classification system, identifying three research themes accounting for 73% of articles —method (impact assessment and monitoring & evaluation), access (connectivity and telecentres), and general business and SMEs. Additionally, the researcher investigated collaboration patterns, finding that of the 58 articles considered, only five (8.62%) were single-author papers, 28 (48.28%) were authored by researchers from the same institution, seven (12.07%) were authored by researchers from different South African institutions, and 18 (31.03%) were authored by researchers with at least one international affiliation among them. This indicates that, firstly, intra-institution collaboration was more prevalent then inter-institution collaboration and, secondly, when researchers collaborated between institutions, international partnerships were preferred to local partnerships.
In a more recent study, also considering ICT4D research, van Biljon and Naude (2018) investigated the collaboration patterns among researchers in this domain in South Africa. In the same manner as Turpin (2018), these researchers analysed collaboration patterns as indicated by publications in a basket of top ICT4D journals. While the same journals as the former study were used, a different time period for this analysis was adopted (2003 to 2016). As would be expected given Turpin (2018)’s results, the analysis indicated that collaboration in this domain was primarily intra-institutional, with limited inter-institutional collaboration between South African researchers. Following this, to investigate the drivers and barriers for research collaboration, van Biljon and Naude (2018) conducted a series of semi-structured interviews with 10 South African researchers shown to frequently collaborate within and between institutions. Drivers for collaboration were found to include: access to funding and resources, knowledge gains and building an international profile, while barriers were found to include: funding, time, absence of administrative support in managing grants, a lack of a collaborative history, and the incentives introduced by the funding model in South Africa.
From these five studies it is evident that, firstly, no comprehensive investigation of South African computing research has been conducted and secondly, that much of the research that has been conducted requires updating. At present, it appears that there are significant institutional differences in the pattern and extent of computing research in South Africa. Whether these differences extend beyond the scope of the studies considered requires further investigation. For both IS and CS research, while differences certainly exist, a shift towards more applied research topics was found. Whether this shift holds ten years later, and whether it extends beyond research published in a single journal or set of journals is unknown. Additionally, determining whether the growth in computing doctorates is reflected more generally in the growth of computing research requires further investigation. Only Turpin (2018) considered growth over time. This was, however, restricted
6Information Technology for Development(ITD),Information Technologies and International Development(ITID), and
to outputs in only three journals in a single sub-domain. There has been little consideration of collaboration networks. For IS, it was shown that publications in top-ranking journals typically involved collaboration with international researchers. Similarly, in ICT4D research, when researchers collaborated externally, international partnerships were preferred to local partnerships. More targeted analysis of collaboration networks among South African computing researchers is required to elucidate the pattern of collaboration within this field.
3
METHODOLOGY
To address the study objective an exploratory, descriptive, scientometric investigation of South African computing research was conducted. The population of research considered is characterised by the affiliation of the researchers involved. Specifically, to be eligible for inclusion a research report must have been published between 2008 and 2017, have at least one author affiliated with a South African university, fall in one of the four categories of research output recognised by the DHET—journal articles (J), whole books (B), chapters in books (BC), and published conference proceedings (P) and, importantly, concern a relevant field of computing. To follow, four primary research questions are specified to guide the investigation. Following this, the procedures for data collection, processing, and analysis are outlined.
3.1
Research Questions
Building on previous research and to address the objective for the study, the following research questions were posed:
• RQ1: What is the pattern of production of South African computing research over the period considered?
– RQ1a: Do institutional differences exist in terms of computing research output?
– RQ1b: How does the rate of growth in South African computing research compare to the rate of growth of all research in South Africa?
• RQ1: Where do South African computing researchers publish their findings?
• RQ2: What topics do South African computing researchers investigate?
• RQ3: What is the pattern of collaboration amongst South African computing researchers?
3.2
Data Collection
Relevant data for the period 2008 to 2017 were collected from the SCOPUS citation enhanced bibliographic database. This is a comprehensive database covering over 23700 titles from over 5000 publishers across a wide variety of academic domains (Elsevier, 2018). In addition to indexing academic output, the database contains related data on authors, affiliations, references, and citations, all of which are necessary for addressing the research questions. Referencing two prominent large-scale reviews, Boshoff and Akanmu (2018, p. 14) note that SCOPUS is often considered to be the most suitable source of data for bibliometric or scientometric analyses of African research. Moreover, at present, research outputs indexed in SCOPUS are accredited by the DHET.
Data were collected from the SCOPUS citation enhanced bibliographic database on the 3rd of September 2018. Consequently, all citation counts are valid up to this date and subsequent citations are not included in the analysis. The primary means of data collection involved the issuing of a search-string as a query to this database. This query contained three clauses. The first concerned institutional affiliations of the authors involved in producing a report. Through an ‘OR’ operator sub-clauses were specified for 23 universities in South Africa.7 The second clause concerned subject area. Of the 27 subject area categories represented in SCOPUS, the search was restricted to two categories,
Computer Science(all) which includes 12 subcategories8 andDecision sciences(all) which includes
four subcategories.9 The third clause concerned the time-period of the study, with publication years restricted to those between 2008 and 2017 (inclusive).
Additionally, two further queries were developed to address RQ1a and RQ1b. To determine the proportion of total South African research output attributable to computing domains, the ‘subject-area’ qualifier was removed from the original search string. All other components (institutions and years) remained the same. This query returned the number of research outputs, as indexed by SCOPUS, for each year in consideration. To determine the proportion of computing research attributable to researchers affiliated with different institutions the query was modified to only include one affiliation and then run for each university in South Africa.
7University of the Witwatersrand, University of Johannesburg, Sol Plaatje University, University of Mpumalanga,
Mangosuthu University of Technology, Central University of Technology, University of Venda, University of Fort Hare, University of Limpopo, Durban University of Technology, Rhodes University, Tshwane University of Technology, University of South Africa, University of the Free State, University of Pretoria, North West University, Cape Peninsula University of Technology, University of the Western Cape, Nelson Mandela Metropolitan University, Nelson Mandela University, University of KwaZulu Natal, University of Zululand, University of Cape Town, Stellenbosch University.
8Computer Science - Miscellaneous, Artificial Intelligence, Computational Theory and Mathematics, Computer
Graphics and Computer-aided Design, Computer Networks and Communications, Computer Science Applications, Computer Vision and Pattern Recognition, Hardware and Architecture, Human-computer Interaction, Information Systems, Signal Processing, and Software.
9Decision Sciences - Miscellaneous, information systems and Management, Management Science and Operations
3.3
Data Processing and Analysis
For each record returned the following fields were retrieved: author names (AU), title (TI), publication name (SO), ISO source abbreviation (JI), document type (DT), author-supplied Keywords (DE), keywords-plus10(ID), abstract (AB), author address (C1), re-print address (RP), cited-references (CR), times cited (TC), publication year (PY), DOI (DI), and unique article identifier (UT). To decrease the size of the dataset the JI, RP, DOI, and UT fields were removed. To identify and associate authors with their affiliations a new field, author-affiliations (AU_AF), was computed from the C1 field. Duplicate records were identified through the application of therestricted edit Damerau-Levenshtein
distanceto the titles with a similarity cut-off of 0.95. The main dataset was maintained separately
from the individual datasets for each university.
The data were analysed from two perspectives. First, through considering the annual productivity of computing research, the publication types and sources, and the topics researched, the quantitative analysis of publication patterns were investigated. To investigate research topics keywords were analysed using a co-occurrence strategic mapping approach. As a means of understanding the impact of South African computing research, citation patterns were analysed from a quantitative perspective. The second analysis approach involved the application of network-analysis techniques. First, to further consider prominent research themes co-occurrence network graphs were produced. Second, to consider collaboration patterns, in addition to the quantification of authorship patterns, collaboration networks were analysed by examining the affiliation patterns of co-authors.
4
ANALYSIS AND RESULTS
The aforementioned query produced 11633 records. After removing duplicates (n = 296) the sample consisted of 11337 unique records across 12 document types—‘conference paper’ (n=7000), ‘article’ (n=4012), ‘book chapter’ (n=277), ‘editorial’ (n =114), ‘erratum’ (n =11), ‘review’ (n=124), ‘conference review’ (n=1), ‘book’ (n=26), ‘note’ (n=21), ‘letter’ (n=6), ‘short survey’ (n=3), and ‘article in press’ (n=38). To more closely approximate the DHET research output categories, only records from the ‘article’ (JA), ‘book’ (B), ‘book chapter’ (BC), ‘conference paper’ (CP), ‘conference review’ (CR), and ‘review’ (R) document types were considered. This resulted in 157 records being discarded from the dataset, leaving a sample of 11180 records. Additionally, records in the review category were considered as articles, while conference reviews were considered as conference proceedings. In the following sub-sections the analysis of the data and the results thereof are presented. First, in Section4.1an overview of South African computing research outputs is provided. Following this, publication patterns are considered in Section4.2. In Section4.3the analysis concerns the research areas considered by South African computing researchers. In Section
4.4the collaboration patterns within this domain are addressed and, finally, in Section4.5the impact of South African computing research is considered.
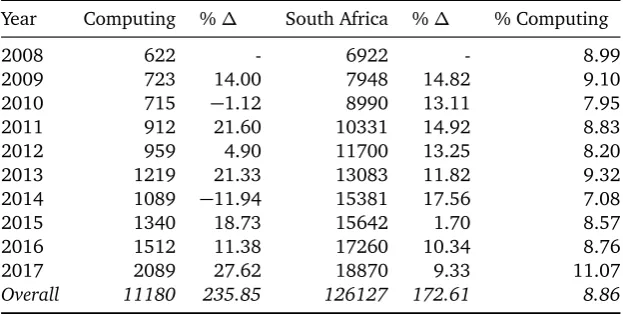
Table 1: Yearly South African overall and computing research output.
Year Computing %∆ South Africa %∆ % Computing
2008 622 - 6922 - 8.99
2009 723 14.00 7948 14.82 9.10
2010 715 −1.12 8990 13.11 7.95
2011 912 21.60 10331 14.92 8.83
2012 959 4.90 11700 13.25 8.20
2013 1219 21.33 13083 11.82 9.32
2014 1089 −11.94 15381 17.56 7.08
2015 1340 18.73 15642 1.70 8.57
2016 1512 11.38 17260 10.34 8.76
2017 2089 27.62 18870 9.33 11.07
Overall 11180 235.85 126127 172.61 8.86
4.1
Overview of Annual Research Outputs
Table1 provides a summary of the output for all South African research and, specifically, South African computing research. Additionally, the annual percentage change for each category of research is presented as %∆. Over the ten year period, annual computing research output has increased by 235.85%, while overall South African research output has increased by 172.61%. It is interesting to note that, while computing research output increased in most years, in 2014 research output decreased by 11.94% from the previous year. Despite this, computing research still accounted for over 6% of the total South African research output for 2014. A compound annual growth rate (CAGR) was computed to describe the average rate of growth in South African computing research and South African research overall, for the period 2008 to 2017. As with computing doctorates, with a CAGR of 12.88% South African computing research output has increased at a rate greater than that of total South African research output (a CAGR of 11.78%). Consequently, over the period in consideration, the proportion of South African research attributable to the computing field has grown from 8.99% in 2008 to 11.07% in 2017. Over the ten year period, 8.86% of all South African research could be categorised as computing research.
4.1.1 Institutional Differences in Annual Research Outputs
University of Pretoria University of Cape Town University of Johannesburg Univesity of KwaZulu Natal University of South Africa University of the Witwatersrand Tshwane University of Technology Stellenbosch University North West University Nelson Mandela University Rhodes University Cape Peninsula University of Technology University of the Western Cape Durban University of Technology University of the Free State University of Fort Hare Central University of Technology University of Zululand University of Limpopo University of Venda Mangosuthu University of Technology Sol Plaatje University University of Mpumalanga
0 500 1000 1500 2000
Total Output
Institution
Year
2017 2016 2015 2014 2013 2012 2011 2010 2009 2008
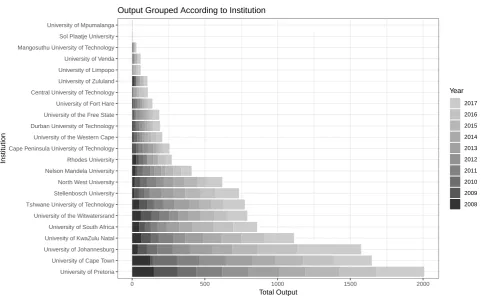
Output Grouped According to Institution
Figure 1: The yearly computing research output per institution considered.
productivity (as represented by yearly output) differs dramatically by institution. Considering the distribution, four institutions (UP, UCT, UJ, and UKZN) account for 52.43% of all affiliation-linked-outputs, with researchers affiliated with UP producing the largest proportion in the period considered (16.52% of all affiliation-linked-outputs).
4.2
Publication Sources For Computing Research
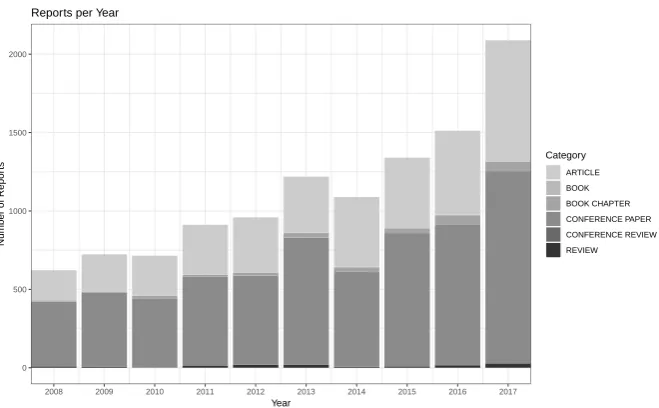
Figure2summarises yearly research output. In addition to the overall growth trend, the dominance of conference papers as a publishing medium is clearly evident. Overall, conference papers (including conference reviews) account for 61.40% of all South African computing research in the period considered. With 36.10% of outputs, journal articles (including reviews) account for the second largest proportion, followed by book chapters with 2.33% and books with 0.23%.
0 500 1000 1500 2000
2008 2009 2010 2011 2012 2013 2014 2015 2016 2017
Year
Number of Repor
ts
Category
ARTICLE BOOK BOOK CHAPTER CONFERENCE PAPER CONFERENCE REVIEW REVIEW
Reports per Year
Figure 2: The number and category of records for each year considered.
Therefore, through pattern-matching, differential entries were identified and amalgamated. This resulted in the 2179 unique sources being reduced to 1770 unique sources. Again, the distribution of publication sources followed a power law (α=1.83), with the top 20% of sources accounting for 78.33% of outputs. Indicating a considerable degree of concentration, 60 publication sources (3.39%) account for 50.00% of all research outputs in this domain. While not mathematically conforming to the conventionalBradford’s Law of Scattering 11 seen in other domains, this distribution does approximate a degree ofBradford Distributionaround a small primary zone of publication sources (n=20) accounting for a third of outputs, with a second, larger zone (n=145), accounting for another third, and then a considerably larger zone (n=1606) of rarely used sources accounting for the final third.
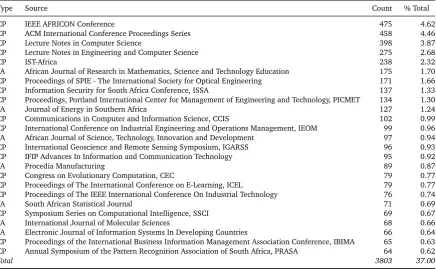
Table2 summarises the 25 most prominent sources. Collectively, these accounted for 37.00% of all outputs. Reiterating the dominance of conference proceedings in this domain, only seven of the top-25 publication sources represent journals, while the remaining 18 are conference proceedings. When considering the table there are a few factors to note. First, the source—‘ACM International Conference Proceedings Series’ represents the proceedings of the ‘Annual Conference of the South African Institute of Computer Scientists and Information Technologists, SAICSIT’. Second, as of 2016, the proceedings of the ‘Annual Conference of the Southern African Computer Lecturers’ Association, SACLA’ are published throughSpringer Verlag as part of the ‘Communications in Computer and Information Science, CCIS’ Series. Third, the absence of SACJ in this list is due to the journal only being indexed in SCOPUS since the 25th of March 2016. Consequently only volumes published
11Bradford’s Law states that: “If scientific journals are arranged in order of decreasing productivity of articles on a given
Table 2: Twenty-five most prominent publication sources amongst South African computing research.
Type Source Count % Total
CP IEEE AFRICON Conference 475 4.62
CP ACM International Conference Proceedings Series 458 4.46
CP Lecture Notes in Computer Science 398 3.87
CP Lecture Notes in Engineering and Computer Science 275 2.68
CP IST-Africa 238 2.32
JA African Journal of Research in Mathematics, Science and Technology Education 175 1.70 CP Proceedings of SPIE - The International Society for Optical Engineering 171 1.66 CP Information Security for South Africa Conference, ISSA 137 1.33 CP Proceedings, Portland International Center for Management of Engineering and Technology, PICMET 134 1.30
JA Journal of Energy in Southern Africa 127 1.24
CP Communications in Computer and Information Science, CCIS 102 0.99 CP International Conference on Industrial Engineering and Operations Management, IEOM 99 0.96 JA African Journal of Science, Technology, Innovation and Development 97 0.94 CP International Geoscience and Remote Sensing Symposium, IGARSS 96 0.93 CP IFIP Advances In Information and Communication Technology 95 0.92
JA Procedia Manufacturing 89 0.87
CP Congress on Evolutionary Computation, CEC 79 0.77
CP Proceedings of The International Conference on E-Learning, ICEL 79 0.77 CP Proceedings of The IEEE International Conference On Industrial Technology 76 0.74
JA South African Statistical Journal 71 0.69
CP Symposium Series on Computational Intelligence, SSCI 69 0.67
JA International Journal of Molecular Sciences 68 0.66
JA Electronic Journal of Information Systems In Developing Countries 66 0.64 CP Proceedings of the International Business Information Management Association Conference, IBIMA 65 0.63 CP Annual Symposium of the Pattern Recognition Association of South Africa, PRASA 64 0.62
Total 3803 37.00
subsequent to this date (vol 28 onwards) were considered in this analysis. Finally, of the top-25 sources, 11 (44%) are African in origin, while 14 (56%) are International.
4.3
Topics Researched By South African Computing Researchers
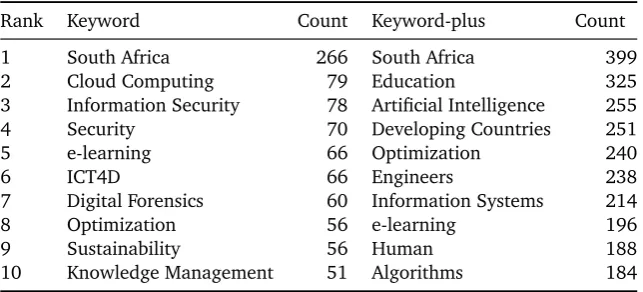
To understand the conceptual structure of South African computing research the author-supplied and keywords-plus (those supplied by SCOPUS) were considered. Across the dataset 23857 keywords and 52092 keywords-plus were present.
Table 3: Summary of top-10 author-supplied keywords and keywords-plus
Rank Keyword Count Keyword-plus Count
1 South Africa 266 South Africa 399
2 Cloud Computing 79 Education 325
3 Information Security 78 Artificial Intelligence 255
4 Security 70 Developing Countries 251
5 e-learning 66 Optimization 240
6 ICT4D 66 Engineers 238
7 Digital Forensics 60 Information Systems 214
8 Optimization 56 e-learning 196
9 Sustainability 56 Human 188
10 Knowledge Management 51 Algorithms 184
4.3.1 Analysis of Keywords: Co-occurrence Strategic Mapping
To further understand the conceptual structure of South African computing research co-word analysis of author-supplied keywords was conducted for both journal articles and conference proceedings (separately). Through clustering of keywords into thematic-networks and mapping their intercon-nections prominent themes were identified. Two metrics are used to describe each theme –Callon’s
density(referred to as density) andCallon’s centrality(referred to as centrality) (Cahlik, 2000; Callon,
Courtial & Laville, 1991). Density measures the internal strength of a network of keywords charac-terising a theme (the strength of internal ties within themes). In the context of research outputs density represents the ongoing development of a research theme. Centrality measures the degree of interactions between networks (the strength of external ties between themes). c=10×Σekh, where
kis a keyword from the particular theme andh is a keyword in another theme (Callon et al., 1991). In the context of research outputs centrality represents the importance of a research theme to the domain in question. Median values, for each theme and metric, can be mapped in a two-dimensional space to form aStrategic Diagram. This enables the identification of four classes of themes. Figure3
depicts the thematic map for South African computing research published in conference proceedings and Figure4 depicts the thematic map for journal articles. In such diagrams each thematic-network is labeled by the keyword most central to the theme and the size of the theme is proportional to the number of records associated with it (Cobo, López-Herrera, Herrera-Viedma & Herrera, 2011).
Themes in the upper-right quadrant, termedmotor-themesare characterised by high density and high centrality and, therefore, are well developed and important to the domain. For conference proceedings, as is evident in Figure3, such themes include: Information Security,Machine Learning,
Classification, andCyber Security, amongst others. For journal articles, such themes include: ICT4D,
South Africa,Blended Learningand, again,Information Security. Themes in the upper-left quadrant
are characterised by high density, indicating strong internal ties, but low centrality. For conferences only one theme falls in this quadrant,WiMax. For journal articles, such themes include: L-Filter12,
Artificial Neural Networks, andScheduling.
Themes in the lower-right quadrant have high centrality and are, therefore, important to the domain but, given their low density are underdeveloped. For conference proceedings, such themes include: Remote Sensing, Particle Swarm Optimisation, andSouth Africa. It is worth commenting on the presence of ‘South Africa’ as a theme in this quadrant. The high-centrality of this theme is indicative of widespread association between the keyword and other themes, as is to be expected with publications produced by South African researchers. And, in the same manner, because it comes to be used so widely, its density or internal strength is less secure. It is, however, close to falling in the upper-right quadrant(as it does for journal articles). For journal articles, themes in this quadrant include: Climate Change,Uncertaintyand, again,Particle Swarm Optimisation. Themes in the lower-left quadrant exhibit low density and centrality and are, therefore, marginal to other themes and under-developed. This low density implies that such themes are either still emerging and broad or waning in prominence. For conference proceedings, such themes include: Mobile
Learning, Information Systems, and OFDM13. For journal articles, such themes include: Wireless
Sensor Networks,Teaching/Learning Strategies, andDecision Support.
Across the two publishing domains a number of patterns are evident. First, for conference proceedings, on average the ‘size’ of the themes is larger than for journal articles, which indicates a greater number of records associated with each theme. Second, in a related manner, more key themes were identified for journal articles than for conference papers. Third, for both domains a majority of themes fall in either the upper-right or lower-left quadrants, indicating a strong core of well-developed and central research themes existing in parallel with a body of more peripheral themes either gaining traction or declining in prominence.
4.3.2 Analysis of Keywords: Co-occurrence Network Graphs
Extending from this conceptual mapping, further analysis of the co-word networks for author-supplied keywords was conducted. For conference proceedings and journal articles separate network graphs were generated to understand the relations between prominent research themes. For the sake of brevity and legibility, these graphs are not reproduced in this report.14 Rather, as is typical, to
understand the nature of these networks, summary statistics are provided. Specifically, for three key measures of network-centrality (degree, eigenvector, and betweenness), the most prominent themes were identified.15 Centrality measures enable the identification of the most important vertices (nodes
representing research themes in this case) in the structure of the network (David & Jon, 2010). While values are computed for each vertex and measure, what is of interest is, rather, the ranking of all vertices (Nomikos, Pantazopoulos, Karaliopoulos & Stavrakakis, 2014; Okamoto, Chen & Li, 2008). The actual value is, for the purposes of this investigation, irrelevant (Georg & Rose, 2016).
13Orthogonal Frequency Division Multiplexing.
14Given the size of the graphs and the resolution of the article, it would not be possible to detect any meaningful
content from the complete graphs at such a size.
15It is noted that a fourth measure of centrality is frequently considered in network analysis—closeness centrality. This
● ● ● ● ● ● ● ● ● ● ● ● ● ● ● ● ● ● ● ● SOUTH AFRICA AUTHENTICATION FPGA MACHINE LEARNING INFORMATION SECURITY CLASSIFICATION SUSTAINABILITY MAPPING MXIT OPTIMIZATION COGNITIVE RADIO
POWER QUALITY INFORMATION SYSTEMS
EYE TRACKING
SIMULATION
QOS PARTICLE SWARM OPTIMIZATION
MIDDLEWARE WIMAX REMOTE SENSING SILICON BIOMASS CYBER SECURITY NEURAL NETWORK SILICON PHOTONICS VULNERABILITIES ALGORITHMS CLOUD COMPUTER VISION SYMBOLIC EXECUTION RADIO ASTRONOMY MICROSTRUCTURE OFDM MOBILE LEARNING ARTIFICIAL NEURAL NETWORK
Centrality
Density
Figure 3: Thematic map of author-supplied keywords for conference proceedings.
● ● ● ● ● ● ● ● ● ●
●
● ● ● ● ● ● ● ● ● ● ● ● ● ● ● ● ● ● ●●
● ● ● ● ● ●ARTIFICIAL NEURAL NETWORKS
INFORMATION SECURITY SOUTH AFRICA
UNCERTAINTY CONSERVATION LAWS
PARTICLE SWARM OPTIMIZATION SIMULATION CLOUD COMPUTING DFT ENERGY EFFICIENCY INFORMATION MANAGEMENT OPTIMISATION
WIRELESS SENSOR NETWORKS
ONTOLOGY
MOBILE DEVICES
EMPIRICAL CHARACTERISTIC FUNCTION
LUMINESCENCE STABILITY CLIMATE CHANGE MULTI−AGENT SYSTEMS INTERNET SCHEDULING PHOTOLUMINESCENCE COMPETITIVE STRATEGY MISSING DATA WEAR SOCIAL MEDIA EVALUATION ICT4D BLENDED LEARNING DIGITAL FORENSICS MOBILE SUB−SAHARAN AFRICA GRAPH DECISION SUPPORT MARKOV CHAIN MONTE CARLO BROWNIAN MOTION L−FILTER TEACHING/LEARNING STRATEGIES CONVERGENCE GRAPHENE ENTERPRISE ARCHITECTURE FRAME COGNITIVE RADIO Centrality Density
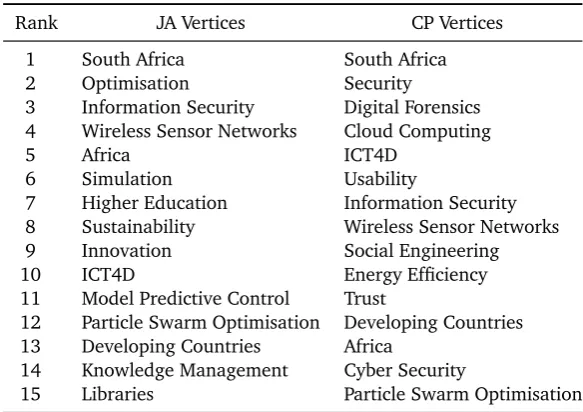
Table 4: Summary of top-15 vertices by degree centrality.
Rank JA Vertices CP Vertices
1 South Africa South Africa
2 Optimisation Security
3 Information Security Digital Forensics
4 Wireless Sensor Networks Cloud Computing
5 Africa ICT4D
6 Simulation Usability
7 Higher Education Information Security
8 Sustainability Wireless Sensor Networks
9 Innovation Social Engineering
10 ICT4D Energy Efficiency
11 Model Predictive Control Trust
12 Particle Swarm Optimisation Developing Countries
13 Developing Countries Africa
14 Knowledge Management Cyber Security
15 Libraries Particle Swarm Optimisation
The relative indexing of each vertex enables the identification of key vertices in the network. Such themes are, consequently, important to the overall conceptual structure of research in this domain. The simplest measure of network structure isDegree Centrality, a metric accounting for the number of ties a vertex has to other vertices (Freeman, 1978). Vertices with a higher degree centrality have more connections to other vertices and are more central to the conceptual structure of the domain. Table4summarises the top-15 vertices by degree centrality. Given the frequency of ‘South Africa’ as a keyword, it is not surprising that it is the vertex with the highest degree centrality for both conference proceedings and journal articles. Notable are high-ranking keywords appearing in both domains —‘ICT4D’, ‘Africa’, ‘Wireless Sensor Networks’, ‘Information Security’, and ‘Particle Swarm Optimisation’. Indicating a difference in overall graph structure, no other vertices appear in the top-15 for both publishing domains. Overall, the 15 themes represented in Table4are, for each publishing domain, the themes which link most to other research themes. These themes, consequently, play a hub role in the network connecting many other themes.
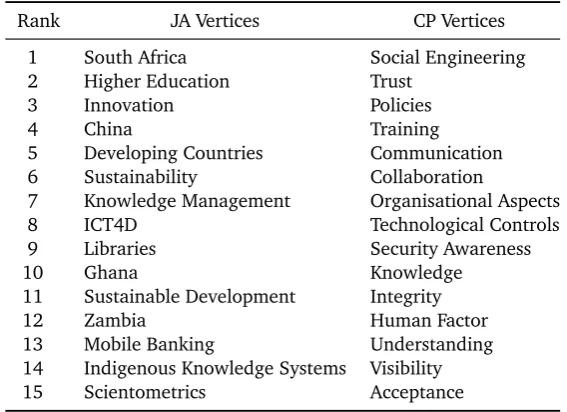
Table 5: Summary of top-15 vertices by eigenvector centrality.
Rank JA Vertices CP Vertices
1 South Africa Social Engineering
2 Higher Education Trust
3 Innovation Policies
4 China Training
5 Developing Countries Communication
6 Sustainability Collaboration
7 Knowledge Management Organisational Aspects
8 ICT4D Technological Controls
9 Libraries Security Awareness
10 Ghana Knowledge
11 Sustainable Development Integrity
12 Zambia Human Factor
13 Mobile Banking Understanding
14 Indigenous Knowledge Systems Visibility
15 Scientometrics Acceptance
The final measure of network structure,betweenness centrality, measures the number of times a vertex is located on the shortest path between other vertices (Freeman, 1978). Vertices with a high betweenness centrality connect different vertices in the network, linking thematic areas (Yan & Ding, 2009). While betweenness centrality is conventionally understood to indicate that a vertex links between or bridges other vertices, it can also indicate that a vertex or theme is on the periphery of both related thematic-clusters. For South African computing research, for both journal articles and conference proceedings, ‘South Africa’ is the vertice with the highest betweenness centrality. Corroborating the two other centrality measures, the themes making up the remaining 14 vertices differ substantially between the two publication domains. While there are overlaps (e.g., ‘wireless sensor networks’) this indicates differences in the conceptual structure of research published in journals and conference proceedings. Overall, the themes summarised in Table6are considered to be key to the flow of concepts through the network.
Table 6: Summary of top-15 vertices by betweenness centrality.
Rank JA Vertices CP Vertices
1 South Africa South Africa
2 Optimisation Security
3 Simulation Energy Efficiency
4 Energy Africa
5 Uncertainty Wireless Sensor Networks
6 Wireless Sensor Networks Cognitive Radio
7 Finite Element Method ICT4D
8 Genetic Algorithm Usability
9 Model Predictive Control Cloud Computing
10 Artificial Neural Networks Digital Forensics
11 modellinga Developing Countries
12 Mobile Phones Authentication
13 Modelinga Particle Swarm Optimisation
14 Graphene Smart Grid
15 Particle Swarm Optimiation Information Security
aThe theme ‘modelling’ appears with two ‘l’s and one ‘l’. This is likely due to the different
spelling conventions adopted in the United States compared to elsewhere.
4.4
Collaboration Patterns Among South African Computing Researchers
To address RQ3 collaboration patterns, as represented by co-authorship, were considered. For the 11180 articles identified, 14506 unique authors were found. In total the dataset contained 32871 author instances. This indicates that, on average, a record was produced by 2.94 authors. Of the 11180 records, 1495, representing 13.37% of all outputs, were authored by a single individual. On
average, each author considered has produced 0.77 records.
4.4.1 Initial Analysis of Authorship Patterns
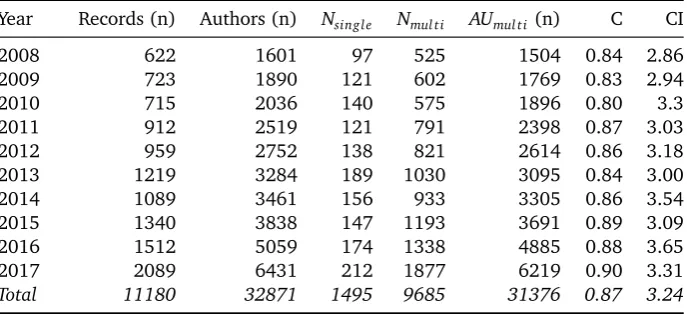
To provide an initial summary of collaboration among South African computing researchers two metrics are considered. First,degree of collaboration(C) was calculated to determine the ratio of collaborative research outputs (as indicated by co-authorship) to total research outputs. Following this, thecollaboration index(CI) was calculated to determine the average number of authors per report for multi-authored reports. Table7summarises the key authorship statistics for the period under consideration. Overall, for South African computing research, on average, the degree of collaboration is 0.87. This indicates that computing research in South Africa is predominantly conducted collaboratively (less than 15% of papers are single-authored). Moreover, as indicated by the CI, on average multi-author papers are produced by 3.24 collaborators.
Table 7: Degree of collaboration and collaboration index among authors
Year Records (n) Authors (n) Nsing l e Nmul t i AUmul t i (n) C CI
2008 622 1601 97 525 1504 0.84 2.86
2009 723 1890 121 602 1769 0.83 2.94
2010 715 2036 140 575 1896 0.80 3.3
2011 912 2519 121 791 2398 0.87 3.03
2012 959 2752 138 821 2614 0.86 3.18
2013 1219 3284 189 1030 3095 0.84 3.00
2014 1089 3461 156 933 3305 0.86 3.54
2015 1340 3838 147 1193 3691 0.89 3.09
2016 1512 5059 174 1338 4885 0.88 3.65
2017 2089 6431 212 1877 6219 0.90 3.31
Total 11180 32871 1495 9685 31376 0.87 3.24
Note. Nsing l erefers to single author reports,Nmul t i refers to multi-author reports andAUmul t irefers to the authors of multi-author reports. For C and CI the total
row represents the mean across the years considered.
the productivity of authors in a given domain (Lotka, 1926) and accounts for the distribution of publication productivity (Pao, 1986, p. 305). In accordance with Lotka’s law 68.50% of authors have only a single publication, 14.50% have two publications, 5.45% have three publications, and 3.02% have four publications. At the other end of the distribution, collectively, the three most productive authors account for 429 (3.84%) publications between them, while the ten most productive account for 1011 publications (9.04%).16
4.4.2 Analysis of Collaboration Networks
After accounting for duplicates, 1435 unique international institutions from 110 countries were present. Overall, 5473 instances of international affiliations were identified. Two caveats necessary to acknowledge at this stage are, firstly, that many authors maintain and list multiple affiliations and, secondly, many authors hold both local and international affiliations. Table8provides a summary of the affiliation-totals for the countries and institutions for seven key regions. It is evident that a majority (63.42%) of international collaboration instances involve authors with affiliations in either Europe or North America. Only 12.42% of international collaboration instances are with institutions in other African countries. The ten most frequently collaborated with countries, outside of South Africa, are: the USA (899), the UK (566), China (407), Germany (373), Canada (253), The Netherlands (216), Nigeria (209), India (195), France (193), and Australia (180).
Of the top 200 international institutions (representing 56.20%) South African computing research-ers collaborate with, 15.02% are African, 20.94% are North American, 12.45% are Asian and, the largest proportion, 44.28% are European. Table9provides a summary of the 20 most-collaborated
16The top ten authors represented in the dataset at the time of data collection were: AP Engelbrecht (173); T Marwala
Table 8: Summary of collaboration patterns by region.
Region Countries Institutions Affiliation-appearances
n n n(%) M(S D)
Africa 27 145 680 (12.42) 4.69 (8.02)
Asia 16 274 816 (14.91) 2.98 (4.52)
Australasia 3 44 229 (4.18) 5.20 (5.75)
Europe 36 559 2296 (41.95) 4.11 (6.18)
Middle East 14 75 173 (3.16) 2.31 (2.57)
North America 9 299 1175 (21.47) 3.93 (5.71)
South America 5 39 104 (1.90) 2.67 (3.19)
Total 110 1435 5473 (100) 3.81 (5.84)
with institutions. Six are in Africa, seven are in Europe, four in North America, two in Asia, and one in Australasia. Overall, considering the properties of the network graph for institutional collaboration (both local and international), the density of the network is low at 0.005. This indicates that the inter-institutional collaboration network is characterised by decentralised, isolated components with many collaboration networks existing in isolation from others. This is supported by values of the three centralisation measures considered for the network (degree centralisation = 0.25; betweenness centralisation=0.25; eigenvector centralisation=0.95). For all of degree, closeness, and betweenness centrality the top five nodes are: UCT, UP, UKZN, WITS, and UJ, respectively. For Eigenvector centrality the top five is made up of international institutions. North-West University is the highest ranked local institution at eighth in the network.
For individual authors, the collaboration network was considered by examining patterns of co-authorship. As with institutional collaboration, the density of the network was low at 0.002. This is supported by values for the centralisation measures considered (degree centralisation=0.03; betweenness centralisation=0.03; eigenvector centralisation =0.97). The computing research network (including both local and international collaborators) is characterised by isolated clusters of nodes containing small numbers of authors as well as individual, isolated authors.
4.5
Impact of South African Computing Research
Table 9: Top-20 international institutions collaborated with by South African computing researchers.
Rank Institution Country Region
1 Paris EST University France Europe
2 University of California United States North America
3 Namibia University of Science and Technology Namibia Africa
4 University of London United Kingdom Europe
5= Academy of Mathematics and Systems Science China Asia
5= Covenant University Nigeria Africa
6 Botswana International University of Science and Technology Botswana Africa
7= University of Botswana Botswana Africa
7= University of Manitoba Canada North America
8= University of Oxford United Kingdom Europe
8= University of Southampton United Kingdom Europe
9= University of Glasgow United Kingdom Europe
9= University of Zimbabwe Zimbabwe Africa
10= University of Duisburg-Essen Germany Europe
10= University of Washington United States North America
11= University of Tasmania Australia Australasia
11= Delft University of Technology The Netherlands Europe
12= University of Toronto Canada North America
12= Indian Institute of Technology India Asia
12= Federal University of Technology Nigeria Africa
is evident that, despite accounting for a larger proportion of reports published (61.40%), conference papers account for a much smaller proportion of total citations for each year considered. Overall, across the ten years considered, journal articles account for 38211 citations (73.18%), books account for 405 citations (0.78%), and conference papers account for 13599 citations (26.04%). For reports with at least one citation, again, there are differences in the yearly citation rate. For journal articles, on average, a report is cited a mean of 2.42 (S D=6.68) per year since publication, whereas for conference papers, a report is cited a mean of 0.93 (S D=1.50) times per year since publication.
5
DISCUSSION
Through the scientometric analysis of relevant publication data for South African computing research this study endeavoured to provide an overview of the publication patterns for the field and identify key shortcomings and areas of strength.
Figure 5: Citations per year for South African computing research.
the nature of the database search, it may also be indicative of a move towards more interdisciplinary work with computing playing a key bridging role to many other related disciplines. As was the case with Brown and Tanner (2008), Kotzé and Van Der Merwe (2009), and Turpin (2018), the output of South African computing research is characterised by marked institutional differences. Specifically, for the outputs considered in this investigation, UP, UCT, UJ, and UKZN account for a majority of South African computing research. In part this corresponds to previous investigations which have shown that, for prominent IS research between 2003 and 2007 UCT and Wits prevail while, for publications in SACJ between 1990 and 2008 UCT, Wits and UP account for a majority of publications and, for prominent ICT4D research, researchers from UCT, UP, CPUT, and RU are more productive. The broader scope of analysis, years considered, and data collection method may account for the slight differences with these previous studies. Nonetheless, it is evident that across computing sub-disciplines there exist at least three highly productive institutions in South Africa, followed by a larger group of moderately productive institutions and, behind that, a trailing group of relatively unproductive institutions. Of course, when considering these patterns it is necessary to acknowledge structural factors in the South African higher education landscape which, certainly, affect the nature and productivity of research in South Africa. Moreover, such outputs are also affected by staff size, teaching loads, available time for research, supervision capacity, funding, and differences in policies for the appointment of external research fellows and associates.
African computing research is certainly published in sub-discipline specific journals or conference proceedings, it is evident from this analysis that, on the whole, a large proportion of research is published through general conferences and journals which are, by contrast, targeted to a broader cross-section of the field or, in some cases, multiple distinct fields.
To investigate the prominent topics and research themes considered by South African computing researchers keyword analyses were conducted. Before discussion of these results, it is necessary to acknowledge that authors use keywords for a variety of reasons and that such terms may hold different meanings in different contexts. Moreover, keywords can also be particularly ambiguous. For instance, terms such as ‘algorithms’, ‘artificial intelligence’, or ‘South Africa’ are broad and not necessarily indicative of the specific subject-matter. While previous studies have endeavoured to distinguish between IS and CS research themes, the analysis conducted in this study did not. Nonetheless, corresponding to Brown and Tanner (2008), Kotzé and Van Der Merwe (2009), and Sanders and Alexander (2015) the analysis indicated a tendency towards applied computing topics. This is perhaps also indicative of the widespread applicability of computing to other disciplines and research areas. It may, however, also reflect preferences or capabilities to address particular questions or problems. Additionally, while many overlaps existed in the conceptual structure, differences were shown between reports published as journal articles and those published as conference papers. This outcome may reflect different publishing norms across sub-domains. Moreover, the analysis indicated that, while thematic clusters do exist, computing research in South Africa is particularly diverse and decentralised. Many thematic areas or research sub-domains exist in isolation of each other with little overlaps or linkages with other sub-domains. While this outcome reflects the large variety in research themes addressed by South African researchers, it may also be reflective of the broad nature of the subject area categories covered by the database targeted. Additionally, further research is required to determine if this pattern is characteristic of computing research at large or if particular qualities of the South African computing field account for this finding.
For authorship, it is evident that a majority of researchers choose to work collaboratively, with a small minority of outputs produced individually. As is normal, authorship followed a power-law distribution, with a majority of authors involved in only a small number of papers. This outcome is suggestive of, firstly, once-off collaborations and, secondly, projects involving students who, upon completion, leave academia. Considering collaboration networks, it was shown that, outside of South Africa, a majority of collaboration involves researchers in either North America or Europe, with little collaboration with researchers in other African countries. Despite these trends, it is evident that the collaboration network is particularly diverse and de-centralised with many researchers or teams of researchers working isolated from the network at large. Such isolated clusters are centralised around institutions and subject areas. Given the broad nature of computing research and the many sub-domains considered in this analysis (e.g., IS, CS, Computer Engineering etc), such a pattern is not unexpected.
published reports, conference papers account for a much smaller proportion of citations relative to journal articles. This difference may be as a result of publication differences, with preliminary or early work published as conference papers and more complete, comprehensive reports published as journal articles. It may also reflect differences in availability between these two publishing media, with access to journal articles through publication databases being more widespread.
5.1
Recommendations for Computing Research in South Africa
Despite the undoubted progress and quality of South African computing research there remains a number of key areas in which improvements can be achieved. In particular, while growth in output is outpacing total research output in South Africa which is, itself, outpacing global averages (NRF, 2018), arrangements need to be put in place to ensure the sustainability of this growth. Additionally, while there are a number of highly productive institutions, actions necessary to improve the output of less productive institutions need to be identified. Moreover, while there are a number of highly cited works produced by South African computing researchers, more emphasis needs to be placed on improving the overall quality of research produced. Unfortunately, the current subsidy model applied by the DHET does, to some extent, work against efforts to ensure greater quality in emphasising quantity of research output units. Moreover, the DHET subsidy system does not encourage or support international collaboration (Woodiwiss, 2012). Given the central role of funding in the production and publication of research, it is necessary to acknowledge the changing funding landscape in South Africa. Increasingly, in the face of changes in how the DHET and NRF fund researchers and research projects, researchers need to seek funding from alternative local and international sources.
It is acknowledged that teaching and research are intimately linked. It is recommended, therefore, that researchers seek to achieve a greater alignment between their teaching and their research, especially in the case of postgraduate teaching. As Kroeze, Pretorius and Roode (2010, p. 2) notes, “in academia the future is research, both for academic staff and students”. Consequently, a key area of focus for improving both the quantity and quality of computing research in South Africa should be the targeting of increased student throughput from undergraduate programs through to higher levels of postgraduate study where, typically, research skills and output are emphasised. It is also recommended that, for doctoral programmes, institutions consider adopting the article model for theses to promote processes of external feedback and continued research productivity. Further research is of course necessary to determine the effects of these recommendations on the quality and quantity of research outputs.
re-search subsidy model presents a substantial roadblock in this regard. In addition to inter-institutional collaboration, a greater emphasis on intra-institutional collaboration is recommended. Specifically, the establishment of research groups involving both established and junior academics as well as students will facilitate communities of practice which can lead to higher quality research outputs (Kroeze et al., 2010). Considering regional collaboration, it is recommended that in regions with a number of institutions (e.g., Gauteng or the Western Cape), regular regional colloquia be established to provide increased opportunities for communication, collaboration and feedback.
Finally, as is the case in, for instance, Economics it is recommended that the local conferences SAICSIT and SACLA place a greater emphasis on implementing working paper series. Through increased feedback and discussion, it is argued, the quality of final research outputs will be improved. In the absence of such opportunities, as has been the case in recent years with SAICSIT, where appropriate, the conversion of conference papers to journal articles should be encouraged. As the findings indicate such articles typically have a greater impact in terms of citations.
6
CONCLUSION
The scientometric investigation of South African computing research presented in this study provides, firstly, an overview of the landscape of South African computing research, secondly, an understanding of where strengths lie and, thirdly, an identification of areas for which work is required to grow the quality and quantity of research outputs.
Despite the value of the the findings presented in this report, it is necessary to briefly acknowledge a number of limitations to the present investigation. First, as a consequence of collecting data from only a single bibliographic database, the data do not necessary present a complete representation of all South African computing research. Despite the breadth in coverage of the SCOPUS citation enhanced bibliographic database, gaps in coverage do exist, especially with regards to citation data. In a related manner, given the nature of the search query employed, the coverage of subject areas was particularly broad and, unfortunately, did not necessarily conform to the definition of computing adopted in this study or include all possible sub-fields. A third limitation relates to the years under consideration. Only data from reports published between 2008 and 2017 (inclusive) were considered. Consequently, the findings do not provide any insight into publication patterns before or after the period considered. Finally, as the study merely considered data relating to publication, collaboration, and citation patterns, identification of factors either driving or hindering publication quality or growth was not possible.
alternative metrics (e.g., Altmetric, social media sharing, traditional media attention, patents, or industry consulting or collaboration) when studying the broader societal impact of South African computing research.
Additionally, it is noted that in many cases the teaching loads facing researchers present significant barriers to research progress in terms of both quantity and quality. Consequently, it is argued that reductions in teaching loads through the re-balancing of teaching responsibilities, the use of online resources, assistants and, if need be, external consultants can positively contribute to research output. To determine if this is the case, longitudinal studies assessing the effects of re-balancing teaching responsibilities on research output should be conducted.
In addition to these recommendations, to provide further insight into institutional differences in research output, it is recommended that an inter-institutional qualitative study be conducted. It may be useful to select a sample of highly productive, moderately productive, and relatively unproductive institutions and interview associated researchers to identify possible drivers and barriers for their productivity. In addition to providing insights into possible drivers of research output, such an investigation will enable the assessment of the proposition that achieving a greater alignment between teaching activities and research activities will facilitate improvements in the quality and quantity of research outputs, as well as the proposition that changes in postgraduate supervision and thesis structures will lead to increased research output.
References
Belter, C. W. (2015). Bibliometric indicators: Opportunities and limits.Journal of the Medical Library
Association : JMLA,103(4), 219–221.http://dx.doi.org/10.3163/1536-5050.103.4.014
Bonacich, P. (1987). Power and centrality: A family of measures.American Journal of Sociology,92(5), 1170–1182.
Boshoff, N. & Akanmu, M. A. (2018). Scopus or Web of Science for a bibliometric profile of pharmacy research at a Nigerian university?South African Journal of Libraries and Information Science,
83(2), 12–22.http://dx.doi.org/10.7553/83-2-1682
Bradford, S. (1934). Sources of information on specific subjects.Engineering: An Illustrated Weekly
Journal,137, 85–86.
Brown, I. & Tanner, M. (2008). The international visibility of South African IS research: An author-affiliation analysis in the top IS-Ranked IS-Centric journals.South African Computer Journal,
42, 14–20.
Cahlik, T. (2000). Comparison of the maps of science.Scientometrics,49(3), 373–387.http://dx.doi. org/10.1023/A:1010581421990
Callon, M., Courtial, J. P. & Laville, F. (1991). Co-word analysis as a tool for describing the network of interactions between basic and technological research: The case of polymer chemsitry.
Scientometrics,22(1), 155–205.http://dx.doi.org/10.1007/BF02019280
Cloete, N., Sheppard, C. & Bailey, T. (2015). South Africa as a PhD Hub? In N. Cloete, P. Maassen & T. Bailey (Eds.),Knowledge production and contradictory functions in African higher education.
Cobo, M., López-Herrera, A., Herrera-Viedma, E. & Herrera, F. (2011). An approach for detecting, quantifying, and visualizing the evolution of a research field: A practical application to the fuzzy sets theory field.Journal of Informetrics,5(1), 146–166.http://dx.doi.org/10.1016/j. joi.2010.10.002
Costas, R. & Bordons, M. (2007). The h-index: Advantages, limitations and its relation with other bibliometric indicators at the micro level.Journal of Informetrics,1(3), 193–203.http://dx. doi.org/10.1016/j.joi.2007.02.001
David, E. & Jon, K. (2010).Networks, crowds, and markets: Reasoning about a highly connected world. New York, NY, USA: Cambridge University Press.
Department of Higher Education and Training (DHET). (2015). Research outputs policy, 2015.
Government Gazette,597(38552), 1–24.
Elsevier. (2018).Scopus: Content coverage guide 2018. Elsevier Publishing.
Freeman, L. C. (1978). Centrality in social networks conceptual clarification.Social Networks,1(3), 215–239.http://dx.doi.org/10.1016/0378-8733(78)90021-7
Galliers, R. D. & Whitley, E. A. (2007).Vive les differences? Developing a profile of European informa-tion systems research as a basis for internainforma-tional comparisons.European Journal of Information
Systems,16(1), 20–35.http://dx.doi.org/10.1057/palgrave.ejis.3000662
Georg, C.-P. & Rose, M. E. (2016). Mirror, mirror on the wall, who is the most central of them all? (Working Papers No. 571). Economic Research Southern Africa. Retrieved fromhttps: //EconPapers.repec.org/RePEc:rza:wpaper:571
Glass, R. L., Ramesh, V. & Vessey, I. (2004). An analysis of research in computing disciplines.
Commu-nications of the ACM,47(6), 89–94.http://dx.doi.org/10.1145/990680.990686
Gruner, S. (2007). Letter to the Editor: What is Informatics ?South African Computer Journal,39, 54–55.
Kotzé, P. & Van Der Merwe, A. (2009). The research foci of computing research in South Africa as reflected by publications in the South African Computer Journal.South African Computer
Journal, (44).http://dx.doi.org/10.18489/sacj.v44i0.24
Kourie, D. G. (2010). The South African Computer Journal: 1989 to 2010.Transactions of the Royal
Society of South Africa,65(2), 107–111. http://dx.doi.org/10.1080/0035919X.2010.
510664
Kroeze, J. H., Pretorius, P. D. & Roode, J. D. (2010). The role of an IT research professor in South Africa.Sprouts: Working Papers on Information Systems,10(32).
Larivière, V., Gingras, Y., Sugimoto, C. R. & Tsou, A. (2015). Team size matters: Collaboration and scientific impact since 1900.Journal of the Association for Information Science and Technology,
66(7), 1323–1332. http://dx.doi.org/10.1002/asi.23266
Lotka, A. J. (1926). The frequency distribution of scientific productivity.Journal of the Washington
Academy of Sciences,16(12), 317–323.
Lowry, P., Romans, D. & Curtis, A. (2004). Global journal prestige and supporting disciplines: A scientometric study of Information Systems journals.Journal of the Association for Information