1
METHOD DEVELOPMENT AND VALIDATION OF RP-HPLC
METHOD FOR DETERMINATION OF NEW ANTIDIABETIC AGENT
LINAGLIPTIN IN BULK AND IN PHARMACEUTICAL
FORMULATION
M.Archana
*, N.Sriram, Md.Gayasuddin
*1Department of Pharmaceutical Analysis, Smt. Sarojini Ramulamma College of Pharmacy, Palamuru University,
Mahaboobnagar, Andhra Pradesh, India.
ABSTRACT
A novel isocratic reverse phase liquid chromatography method for determination of Linagliptin was developed and validated after optimization of various chromatographic conditions. A Khromosil C18, 5μm column having 150×4.6 mm i.d., with mobile phase containing 0.02 M potassium dihydrogen phosphate : acetonitrile (70:30, v/v, pH 5.0 adjusted with 1% OPA solution) was used. The flow rate was 1.2 mL min-1and effluents were monitored at 226 nm. The retention time of Linagliptin was 4.2min. The linearity for Linagliptin was in the range of 0-75μg mL-1 with coefficient of correlation 0.999. The proposed method was validated with respect to linearity, accuracy, precision and robustness.
Keywords: Linagliptin, RP- HPLC, Tradgenta Tablets, Validation.
INTRODUCTION
Linagliptin is described chemically as 1H-Purine-2,6-dione, 8-[(3R)-3-amino-1-piperidinyl]-7-(2-butyn-1-yl)-3,7-dihydro-3-methyl-1-[(4-methyl-2-quinazolinyl) methyl]-
The empirical formula is C ₂₅H₂₈N₈O₂. The structural formula is shown in fig (1).
Fig 1. Linagliptin
Linagliptin is a white to yellowish, not or only slightly hygroscopic solid substance. It is very slightly soluble in water (0.9 mg mL-1). Linagliptin is soluble in methano (ca. 60 mg mL-1), sparingly soluble in ethanol
(ca. 10 mg mL-1), very slightly soluble in isopropanol (<1 mg mL-1), and very slightly soluble in acetone (ca. 1 mg mL-1) [1-3].
Linagliptin is an oral drug that reduces blood sugar (glucose) levels in patients with type 2 diabetes. Linagliptin is a member of a class of drugs that inhibit the enzyme, dipeptidyl peptidase-4 (DPP-4). Following a meal, incretin hormones such as glucagon-like peptide-1 (GLP-1) and glucose-dependent insulinotropic polypeptide (GIP) are released from the intestine, and their levels increase in the blood. GLP-1 and GIP reduce blood glucose by increasing the production and release of insulin from the pancreas. GLP-1 also reduces blood glucose by reducing the secretion by the pancreas of the hormone, glucagon, a hormone that increases the production of glucose by the liver and raises the blood level of glucose. The net effect of increased release of GLP-1 and GIP is to reduce blood glucose levels. Linagliptin inhibits the
Corresponding Author: - M.Archana Email: [email protected]
International Journal of
Medicinal Chemistry & Analysis
www.ijmca.com
e ISSN 2249 - 7587
2
enzyme, DPP-4, that destroys GLP-1 and GIP and therebyincreases the levels and activity of both hormones. As a result, levels of GLP-1 and GIP in the blood remain higher, and blood glucose levels fall. Linagliptin reduces blood glucose levels by inhibiting DPP-4 and increasing the levels of GLP-1 and GIP [4-8].
MATERIALS AND METHODS Chemicals and Reagents
HPLC grade Acetonitrile from Merck specialties Pvt Ltd, Mumbai. Chemicals and Whatman GFC filter were used in the study. Analytically pure Linagliptin was procured as gratis sample from reputed laboratory. Water HPLC grade was obtained from Rankem laboratories.
Tablet formulation (Tradjenta 5mg) manufactured by Eli Lilly and Company containing labeled amount of 5 mg of Linagliptin film coated tablets was purchased from local market.
Equipments
The instrument was a Water Alliance 2695 separation module, having water 2996 photodiode array detector in isocratic mode. The system was connected with the help of Empower2 software in a computer system for data collection and processing. The analytical column used is Khromosil C18.
Chromatographic condition
The mobile phase consists of a mixture of 0.02N Potassium dihydrogen phosphate (pH adjusted to 5 with 1% o-phosphoric acid) (70 volumes) and Acetonitrile (30 volumes) was filtered through 0.45 μm nylon membrane filter before use. The injection volume was 20μL with a flow rate 1.2 mL min-1 and detection wavelength 226 nm having ambient condition and run time 15 min.
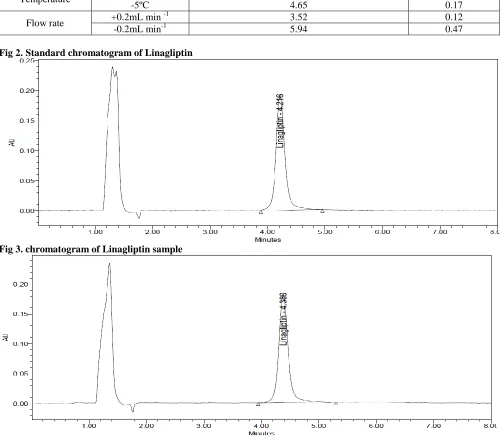
Standard preparation
Stock solutions were prepared by accurately weighing 10 mg of Linagliptin and transferring to 10 ml volumetric flasks containing 3 ml of methanol. The flasks were sonicated for 10 min to dissolve the solids. Volumes were made up to the mark with methanol, which gave 1000 μg Ml-1. Aliquots from the stock solutions were
appropriately diluted with mobile phase to obtain working standards of 50 μg mL-1 of drug. Typical standard
chromatogram of Linagliptin is shown in Fig (2) [9-12].
RESULT AND DISCUSSION
Estimation of Linagliptin in tablet dosage form
The HPLC procedure was optimized with a view to develop precise and stable assay method. Linagliptin was run in different mobile phase composition and different pH ranges (5 to 7) of mobile phase with different C18 columns Agilant Xdb (100 mm x 4.6 mm i.d.,5 μm), hypersil BDS (150 mm x 4.6 mm i.d., 5μm) at ambient temperature (25º and 30º C).The flow rate was also varied
from 0.5 mL to 1.2 mL min-1. The mobile phase consists of and a mixture of 0.02N potassium dihydrogen phosphate (pH adjusted to 5) (70 volumes) and acetonitrile (30volumes) was filtered through 0.45 μm nylon membrane filter before use. The column used is Khromosil C18, 5μm column having 150×4.6 mm i.d.
Twenty tablets were weighed and crushed to fine powder. The powder equivalent to 25mg of Linagliptin was taken in a 25 mL volumetric flask and made up with methanol. The resultant mixture was filtered through 0.45 μm nylon filter. From this filtrate 5mL of solution was pipette out into 100 ml standard flask and made up with mobile phase. The sample solution was chromatographed similar to standard solution and concentrations of Linagliptin in tablet samples were calculated using regression equation. Typical sample chromatogram of Linagliptin is shown in Fig (3).
Method Validation
The described method has been validated for the assay of Linagliptin using following parameters.
Accuracy
The accuracy of the method was determined by recovery experiments. Placebo was spiked with known quantities of standard drugs at levels of 50 to150% of label claim. The recovery studies were carried out 3 times and the percentage recovery and standard deviation of the percentage recovery were calculated and presented in Table (1).
System suitability studies
The system suitability test was carried out on freshly prepared stock solution of Linagliptin to check various parameters such as column efficiency, tailing factor and number of theoretical and presented in Table (2).The values obtained were demonstrated the suitability of the system for the analysis of the drug. System suitability parameter may fall within 3% standard deviation range during routine performance of the method.
LOD and LOQ
The LOD and LOQ of the developed method were determined by injecting progressively low concentrations of the standard solutions using the developed RP-HPLC method. The LOD is the smallest concentration of the analyte that gives a measurable response (signal to noise ratio of 3). The LOD for Linagliptin was found to be 0.9 μg mL-1.The LOQ is the smallest concentration of the analyte, which gives response that can be accurately quantified (signal to noise ratio of 10). The LOQ was 2.95μg mL-1 for Linagliptin
respectively.
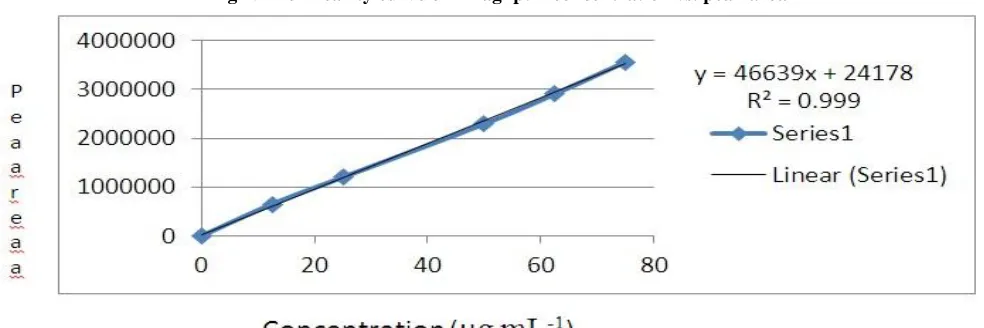
Linearity and Range
3
range was found to be 0-75 μg mL-1. 20μL of eachsolution was injected into chromatograph. Peak areas were recorded for all the chromatogram. Calibration curve was constructed by plotting peak areas (Y axis) against the amount of drug in μg mL-1 (X axis). Peak area of linearity
range and the parameters were calculated and presented in Table 3 The linearity curve of Linagliptin was shown in Fig(4).
Specificity
Specificity of the method was determined by injecting the diluted placebo. There was no interference of placebo with the principle peak, hence the developed analytical method was specific for Linagliptin in tablet dosage form.
Precision System precision
The system precision of the method was
established by six replicate injections of the standard solution containing Linagliptin. The percentage RSD were calculated and presented in Table (4). From the data obtained, the developed RP-HPLC method was found to be precise.
Method precision
The method precision of the method was established by carrying out the analysis of Linagliptin in dosage form (n=6) using the proposed method. The low value of the relative standard deviation showed that the method was precise The results obtained were presented in Table (5).
Robustness
Robustness of the method was determined by making slight change in the chromatographic condition. It was observed that there were no marked changes in the chromatograms, which. The results of robustness were presented in Table (6).
Table 1. Results of accuracy studies
The mean %recovery is well within the acceptance limit, hence the method is accurate
Table 2. System Suitability Studies
Table 3. Result of Linearity
S.No Pipetted from stock (mL) Volume of flask (mL) Concentration μg mL-1 % of linearity level Peak area
1 0 0 0 0 0
2 0.125 10 12.5 25 65209
3 0.25 10 25 50 1205065
4 0.5 10 50 100 2298165
5 0.625 10 62.5 125 2913681
6 0.75 10 75 150 3569378
S. No %Accuracy Peak area Amount Added
(mg mL-1)
Amount Found
(mg mL-1) %Recovery
Avg %Recovery
1 50%
1051124 0.025 0.025133 100.5304
101.0179
1058124 0.025 0.0253 101.1999
1059417 0.025 0.025331 101.3235
2 100%
2082382 0.05 0.04971 99.58038
98.9629
2073687 0.05 0.049582 99.16458
2052342 0.05 0.049072 98.14385
3 150%
3144006 0.075 0.075174 100.2318
98.9439
3078953 0.075 0.073618 98.15788
3087873 0.075 0.073832 98.44225
S. no peak area Retention Time Theoretical plates Tailing factor
1 2081801 4.216 4039 1.11
2 2101070 4.319 3932 1.15
3 2094054 4.38 3941 1.11
4 2099531 4.217 4100 1.1
5 2093628 4.3 3977 1.13
AVG 2094017 4.2864 3997.8 1.12
SD 7575.163 0.070323 70.94153 0.02
4
Table 4. System precision resultsS.No Peak A ea
1 2081801
2 2101070
3 2094054
4 2099531
5 2093628
6 2076856
AVG 2091157
Stdev 9746.212
%RSD 0.466068
Table 5. Method precision result
S.No Peak Area % Assay of Dosage Form
1 2124657 101.5004
2 2130499 101.7795
3 2103228 100.4767
4 2123178 101.4297
5 2109707 100.7862
6 2103990 100.5131
AVG 2115877 101.0809
SD 11692.41 0.558567
%RSD 0.552604 0.552694
Table 6. Method Robustness of Linagliptin in Dosage Forms
Fig 2. Standard chromatogram of Linagliptin
Fig 3. chromatogram of Linagliptin sample
Condition Change Retention time (Min) % RSD
Temperature +5º C 4.58 0.15
-5ºC 4.65 0.17
Flow rate +0.2mL min
-1 3.52 0.12
5
Fig 4. The linearity curve of Linagliptin concentration vs. peak areaCONCLUSION
The proposed RP-HPLC method for the estimation of Linagliptin in tablet dosage forms is accurate, precise, linear, robust, simple and rapid.
Hence the present RP-HPLC method is suitable for the quality control of the raw material, formulation and dissolution studies.
REFERENCES
1. Four Phase III Trials Confirm Benefits of BI’s Oral, Once-Daily Type 2 Diabetes Therapy. Genetic Engineering & Biotechnology News. 28 June 2010.
2. Spreitzer H. Neue Wirkstoffe - BI-1356.Österreichische Apothekerzeitung, 918, 2008. 3. World Health Organization. Fact Sheet No. 312: What is Diabetes? 2011.
4. FDA Approves Type 2 Diabetes Drug from Boehringer Ingelheim and Lilly. 3 May 2011 5. Wang Y, Serradell N, Rosa, E Castaner, R BI-1356. Drugs of the Future, 33(6), 2008, 473-477.
6. Lakshmi B, Reddy TV. A novel RP – HPLC Method for the Quantification of Linagliptin in formulations. J Atoms and
Molecules, 2012; 2(2), 2012, 155-164.
7. Krause SO. Analytical method validation for biopharmaceuticals: a practical guide. Guide to Validation. Supp to Bio
Pharm Int, 2000, 26-34.
8. Kanarek AD. Method validation guidelines. Guide to Bioanalytical Advances. Supp to Bio Pharm Int, 28, 2005, 33. 9. Centers for Disease Control and Prevention. National Diabetes Fact Sheet, 2011.
10. US FDA. Guideline for industry: text on validation of analytical procedures: ICH Q2A. Rockville, 1995. 11. International Diabetes Federation. Diabetes Atlas. 3rd edn. Brussels: International Diabetes Federation, 2006.