Vol. 10, No. 2, 2018 Article ID IJIM-00829, 9 pages Research Article
Ranking Two-Stage Process Using a Common Set of Weights in DEA
S. Mamizadeh-Chatghayeh ∗†, A. A. Noura ‡
Received Date: 2016-02-16 Revised Date: 2016-12-02 Accepted Date: 2017-12-26
————————————————————————————————–
Abstract
Supply chain management is the combination of art and science that goes into improving the supply chain. In some cases of supply chain especially two-stage process, differing weights for the same factors, may not acceptable. The purpose of this paper is a performance evaluation of two-stage process using DEA and based on a CSW model and this method for ranking two-stage process and could be used to measure the efficiency of two-stage process.
Keywords: Two-stage process; Supply chain management; Data envelopment analysis; Common set of weights.
—————————————————————————————————–
1
Introduction
I
ntwo-stage process for example supply chain,today’s competitive business environment, has been one of the core subjects in most in-dustrial parts, since it has found to create value for each subsystem i.e., suppliers, manufacturers, distributions, retailers and customers. The sup-ply chain process has gained a prodigious of at-tention from both managers and industries since the last decade. In fact, the market is growing hand over fist and value to the supply chain by enhancing efficiency and effectiveness of perfor-mance evaluation programs. Until now there are many researches that were professional and depth research on supply chain management, ([13], [7], [26], [25] and [10]). But there is still a lack of∗Corresponding author.
so-mayeh [email protected], Tel: +(98)9191142890
†Department of mathematics, Islamic Azad University,
Central Tehran Branch, Tehran, Iran.
‡Faculty of matematics, Sistan and Baluchestan
Uni-versity, Zahedan, Iran.
integration between the performance evaluation method and common set of weights (CSW) for subsystems.
Significant research has been done on a com-mon set of weighted problem. Examples include the models of [20] and [21], that there are control-ling factor weights in Data Envelopment Analy-sis (DEA) and alternate methods of treating fac-tor weights in DEA. [24] presented a nonlinear discriminate analysis to provide the common set weights and the discriminated analysis of ratios for ranking units. [9] suggested a multiple objec-tives max-min model to determine a common set of weights. [6] presented minimizes a convex of these deviations measured in terms of a couple of distances in such family and improving the dis-criminating power of DEA. [11] proposed a DEA compromise programming model for comprehen-sive ranking. In addition, [12] proposed an allo-cation that is based on a common dual weights approach. Abbas Ali [18] applied common set of weights approach methodology in stochastic DEA. [8] proposed a common set of weights to
create the best efficiency scores on the DEA fron-tier with common weight and S. [19] modify and improve the method introduced by [8].
The types of two stage DEA models for two-stage process as described by [14], [5], [22], [23], [3], [4], [5], [16], [17]. In some cases of two-stage process for example supply chain process, dif-fering weights for the same factors of two-stage processes may not acceptable in the performance evaluation of two-stage processes, for instance, the general manager of a chain store or bank de-sires to measure the performance of all stores or bank branches using a common set of weights. On the other hand, modeling is an important tool for understanding and managing the two-stage pro-cess and improving the two-stage propro-cess perfor-mance. Therefore, the contribution of this re-search is that it provides a method for not only a common set of weights for all of the two-stage process s but also show common set input excess, intermediate products and output shortfalls all of the two-stage process s simultaneously. It is nec-essary to mention that one of the advantages of the proposed method it is a ranking of two-stage processes, and could be measuring the efficiency of twostage processes. The remainder structure of this paper is organized as follows: Section 2 our proposed approach is explained with the common set weight DEA models. Section 3 we apply the proposed approach to appraise the performance of 17 bank branches of China Construction Bank in Anhui province for twostage process.
2
Method
Throughout this paper, we assume to deal with n
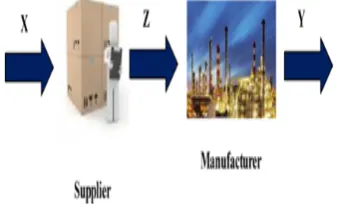
observed two-stage process. Figure (1) shows the structure of a supplier-manufacturer, that each manufacturer uses m inputs (xij, i = 1,2, ..., m)
to producef outputs (zkj, k= 1,2, ..., f) and
sup-plier usesf intermediate production to produces
outputs (yrj, r= 1,2, ..., s).
2.1 Performance evaluation of two-stage process
Managing the performance of the two-stage pro-cess without subsystems is not an effective and it will not adequately alert the manager to a
prob-Figure 1: A two-stage.
lem in business. An effective performance evalu-ation process enables two-stage process manager to evaluate and measure subsystems in the overall performance of the stage process. In the two-stage process for example supply chain; there are two key elements when we consider performance evaluation. First, represent the relative impor-tance of supplier and second represent the rel-ative importance of manufacturer to the overall performance of the two-stage process. Therefore, in this section we computed the overall efficiency of the two-stage process under a constant return to scale, [4]
M ax
(
α f
∑
k=1
wkzko
m
∑
i=1
vixio
+β s
∑
r=1
uryro
f
∑
k=1
wkzko
)
s.t. f
∑
k=1
wkzkj
m
∑
i=1
vixij
≤1,∀j
s
∑
r=1
uryrj
f
∑
k=1
wkzkj
≤1,∀j
(2.1)
ur≥ϵ, wk ≥ϵ, vi≥ϵ, ∀r,∀k,∀i. (2.2)
A focus on objectives, α and β are supplier and manufacturer specific weights such that α+β = 1. It is important to identify the contribution of supplier and manufacturer in objective of the model (2.1). Under each contribution of supplier and manufacturer, we have:
α=
m
∑
i=1
vixio
m
∑
i=1
vixio+ f
∑
k=1
wkzko
Contribution to the performance of
manufac-turer: β =
f
∑
k=1
wkzko
m
∑
i=1
vixio+ f
∑
k=1
wkzko
Then the objective function of model (2.1) be-comes:
M ax
(∑f
k=1
wkzko+ s
∑
r=1
uryro
m
∑
i=1
vixio+ f
∑
k=1
wkzko
)
s.t. f
∑
k=1
wkzkj
m
∑
i=1
vixij
≤1,∀j
s
∑
r=1
uryrj
f
∑
k=1
wkzkj
≤1,∀j
ur ≥ϵ, wk≥ϵ, vi ≥ϵ, ∀r,∀k,∀i. (2.3)
Using the [2] transformation, we let t =
1 m
∑
i=1
vixio+ f
∑
k=1
wkzko
and setπi =t.vi,σk=t.zk and
φq=t.uq. Then it is formulated as follows:
η∗ =M ax f
∑
k=1
σkzko+ s
∑
r=1
φryro
s.t. m
∑
i=1
πixio+ f
∑
k=1
σkzko = 1
f
∑
k=1
σkzkj− m
∑
i=1
πixij ≤0,∀j
s
∑
r=1
φryrj− m
∑
i=1
σkzkj ≤0,∀j
πi≥0, σk≥0, φr ≥0, ∀i,∀k,∀r.
(2.4)
2.2 Common set of weights
In the DEA methodology, are run separately for each decision making units to calculate the maxi-mum relative efficiency. Its efficiency is defined as
a ratio of weighted sum of outputs to a weighted sum of inputs. The common weights DEA in-troduced by [20] is an approach for identifying best unique weights in which all decision making units (DMUs) in the presence of multiple inputs and outputs. Therefore, we have:
M ax
{∑s
r=1
uryrj
m
∑
i=1
vixij
, j = 1, ..., n
}
s.t. s
∑
r=1
uryrj
m
∑
i=1
vixij
≤1,∀j
ur≥ϵ, vi≥ϵ, ∀r,∀i. (2.5)
But since MOFP programming cannot handle fraction, we need to transform the formulation, [18]:
M ax
{
s
∑
r=1
uryrj− m
∑
i=1
vixij, j = 1, ..., n
}
A common set of weights to create the best per-formance evaluation scores of the group of two-stage processes. Therefore, the following Multi Objective Fractional Programming (MOFP) can be used to maximize the performance evaluation of all two-stage process s in the model (2.3). Then, we have:
M ax
{∑f
k=1
wkzk1+ s
∑
r=1
uryr1
m
∑
i=1
vixi1+ f
∑
k=1
wkzk1
,
f
∑
k=1
wkzk2+ s
∑
r=1
uryr2
m
∑
i=1
vixi2+ f
∑
k=1
wkzk2
, ..., f
∑
k=1
wkzkj+ s
∑
r=1
uryrj
m
∑
i=1
vixij+ f
∑
k=1
wkzkj
}
s.t. f
∑
k=1
wkzkj
m
∑
i=1
vixij
≤1,∀j
s
∑
r=1
uryrj
f
∑
k=1
wkzkj
≤1,∀j
Table 1: Data of 17 bank branches.
NO. Bank FA EM EX CR IL LO PR
Branch (108) (103) (108) (108) (108) (108) (108)
SC1 Hefei 1.0168 1.221 1.2215 166.9755 8.3098 122.1954 3.7569 SC2 Bengbu 0.5915 0.611 0.4758 50.1164 1.7634 19.4829 0.6600 SC3 Huainan 0.7237 0.645 0.6061 48.2831 3.4098 34.4120 0.7713 SC4 Huaibei 0.5150 0.486 0.3763 35.0704 2.3480 15.2804 0.3203 SC5 Maanshan 0.4775 0.526 0.3848 49.9174 5.4613 34.9897 0.8430 SC6 Tongling 0.6125 0.407 0.3407 23.1052 1.2413 32.5778 0.4616
SC7 Wuhu 0.7911 0.708 0.4407 39.4590 1.1485 30.2331 0.6732
SC8 Anqing 1.2363 0.713 0.5547 37.4954 4.0825 20.6013 0.4864 SC9 Huangshan 0.4460 0.443 0.3419 20.9846 0.6897 8.6332 0.1288 SC10 Fuyang 1.2481 0.638 0.4574 45.0508 1.7237 9.2354 0.3019 SC11 Suzhou 0.7050 0.575 0.4036 38.1625 2.2492 12.0171 0.3138 SC12 Chuzhou 0.6446 0.432 0.4012 30.1676 2.3354 13.8130 0.3772
SC13 Luan 0.7239 0.510 0.3709 26.5391 1.3416 5.0961 0.1453
SC14 Xuancheng 0.5538 0.442 0.3555 22.2093 0.9886 13.6085 0.3614 SC15 Chizhou 0.3363 0.322 0.2334 16.1235 0.4889 5.9803 0.0928 SC16 Chaohu 0.6678 0.423 0.3471 22.1848 1.1767 9.2348 0.2002 SC17 Bozhou 0.3418 0.256 0.1594 13.4364 0.4064 2.5326 0.0057
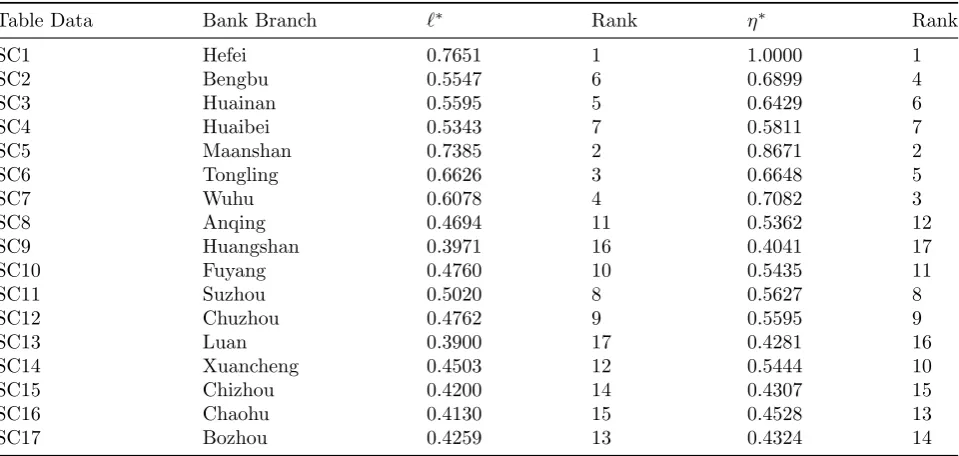
Table 2: Efficiency scores and ranks.
Table Data Bank Branch ℓ∗ Rank η∗ Rank
SC1 Hefei 0.7651 1 1.0000 1
SC2 Bengbu 0.5547 6 0.6899 4
SC3 Huainan 0.5595 5 0.6429 6
SC4 Huaibei 0.5343 7 0.5811 7
SC5 Maanshan 0.7385 2 0.8671 2
SC6 Tongling 0.6626 3 0.6648 5
SC7 Wuhu 0.6078 4 0.7082 3
SC8 Anqing 0.4694 11 0.5362 12
SC9 Huangshan 0.3971 16 0.4041 17
SC10 Fuyang 0.4760 10 0.5435 11
SC11 Suzhou 0.5020 8 0.5627 8
SC12 Chuzhou 0.4762 9 0.5595 9
SC13 Luan 0.3900 17 0.4281 16
SC14 Xuancheng 0.4503 12 0.5444 10
SC15 Chizhou 0.4200 14 0.4307 15
SC16 Chaohu 0.4130 15 0.4528 13
SC17 Bozhou 0.4259 13 0.4324 14
We call the model (2.6) the common set of weights of the performance evaluation model. It maxi-mizes the joint efficiency of the supplier and man-ufacturer and two subsystems to agree on a com-mon set of weights on the intermediate produc-tion. To solve the above MOFP, i. e.:
M ax
{∑f k=1
wkzkj+ s
∑
r=1
uryrj
m
∑
i=1
vixij+ f
∑
k=1
wkzkj
, j= 1, ..., n
}
We need to transform the formulation:
M ax
{
(
f
∑
k=1
wkzkj + s
∑
r=1
uryrj) − ( m
∑
i=1
vixij +
f
∑
k=1
wkzkj), j= 1, ..., n
}
And then we obtain:
M ax s
∑
r=1
ur n
∑
j=1
yrj− m
∑
i=1
vi n
∑
j=1
To address this method, we introduce ˆxi =
∑
xij and ˆyr =
∑
yrj, [18]. We now propose
the model:
γ∗ =M ax s
∑
r=1
uryˆr− m
∑
i=1
vrxˆi
s.t. f
∑
k=1
wkzkj− m
∑
i=1
vixij ≤0,∀j
s
∑
r=1
uryrj − f
∑
k=1
wkzkj ≤0,∀j
ur ≥ϵ, wk≥ϵ, vi ≥ϵ, ∀r,∀k,∀i.
(2.7) Using (V∗, W∗, U∗) optimal common set of weights from (2.7), the common set of weights performance evaluation of two-stage process s is defined as follows:
ℓ∗ =
f
∑
k=1
wk∗zkj+ s
∑
r=1
u∗ryrj
m
∑
i=1
vi∗xij + f
∑
k=1
w∗kzkj
, j = 1, ..., n (2.8)
Definition in this relation (2.8), thepthtwo-stage process (Xp, Zp, Yp) is CSW efficiency if and only
ifℓ∗p = 1.
Theorem 2.1 The CSW efficiency of the pth
two-stage process (Xp, Zp, Yp) is better than of
the qth two-stage process (Xq, Zq, Yq) if only if ℓ∗q< ℓ∗p.
Proof. Based on the (Xp, Zp, Yp) and
(Xq, Zq, Yq) forpth and qth two-stage process,
re-spectively, we suppose (V∗, W∗, U∗) is the opti-mal common set of weights. Then we have for input of both of supplier and manufacturer:
{ X
p > Xq −→V∗Xp> V∗Xq,(V∗ >0)
Zp> Zq−→W∗Zp > W∗Zq,(W∗ >0)
(2.9) =⇒V∗Xp+W∗Zp > V∗Xq+W∗Zq
=⇒ 1
V∗Xq+W∗Zq
> 1 V∗Xp+W∗Zp
And for output of both of two stages:
{ Y
q> Yp −→U∗Yq > U∗Xq,(U∗ >0)
Zq> Zp −→W∗Zq> W∗Zp,(W∗ >0)
(2.10)
=⇒U∗Yq+W∗Zq> U∗Yp+W∗Zp
Therefore (2.9) and (2.10):
=⇒ U
∗Yq+W∗Zq V∗Xq+W∗Zq
> U
∗Yp+W∗Zp V∗Xp+W∗Zp
(2.11)
Then,ℓ∗q > ℓ∗p. That is contradiction.
The dual form of (2.7) is (2.9):
δ∗=M ax ϵ
( m ∑
i=1
si+ f
∑
k=1
sk+ s
∑
r=1
sr
)
s.t. n
∑
j=1
λjxij +si= ˆxi, i= 1, ..., m
n
∑
j=1
µjyrj−sr = ˆyr, r= 1, ..., s
n
∑
j=1
(λj−µj)zkj−sk= 0, k= 1, ..., f
λj ≥0, µj ≥0 ∀j
si ≥0, sk ≥0, sr≥0 ∀i,∀k,∀r.
(2.12)
Model (2.12) defines the total shortfalls and ex-cess of all two-stage proex-cess s corresponding to the inputs, intermediate products and outputs by
si ,sk and sr.
2.3 Ranking
We could introduce to the common set of weights by taking the slack variable, [8], [9]. The Com-mon set of weights model is formulated as:
M in n
∑
j=1
(
2Ψj+ Φj + Γj
)
s.t. f
∑
k=1
wkzkj+ Ψj
m
∑
i=1
vixij−Φj
= 1,∀j
s
∑
r=1
uryrj + Γj
f
∑
k=1
wkzkj−Ψj
= 1,∀j
The ratio form of constraints in the model (2.13) can be translated into linear form:
M in n
∑
j=1
(
2Ψj+ Φj + Γj
)
s.t. f
∑
k=1
wkzkj− m
∑
i=1
vixij + Ψj+ Φj = 0,∀j
s
∑
r=1
uryrj− f
∑
k=1
wkzkj+ Γj+ Ψj = 0,∀j
Ψj ≥0,Φj ≥0,Γj ≥0,∀j
(2.14)
ur≥ϵ, wk≥ϵ, vi ≥ϵ, ∀r,∀k,∀i. (2.15)
Following the transformation of the model (2.14), we let Ψj+ Φj = ∆j and Ψj+ Γj = Ωj and then
we have:
M in n
∑
j=1
(
∆j+ Ωj
)
s.t. f
∑
k=1
wkzkj− m
∑
i=1
vixij + ∆j = 0,∀j
s
∑
r=1
uryrj− f
∑
k=1
wkzkj+ Ωj = 0,∀j
∆j ≥0,Ωj ≥0,∀j
(2.16)
ur≥ϵ, wk≥ϵ, vi ≥ϵ, ∀r,∀k,∀i. (2.17)
By removing the slack variable ∆j, Ωjand setting
ˆ
xi =
∑
xij and ˆyr =
∑
yrj. We can obtain the
model (2.7). In other words, the model (2.7) and (2.16) is equivalent.
Definition 2.1 The pth two-stage process is ef-ficient if and only if ∆∗p+ Ω∗p= 0.
Definition 2.2 Suppose ℓ∗q =ℓ∗”p <1, then the
efficiency of pth two-stage process is better than
the CSW efficiency of qth two-stage process if
(∆∗p+ Ω∗p)<(∆∗q+ Ω∗q).
Theorem 2.2 If
m
∑
i=1
v∗ixip = s
∑
r=1
u∗ryrp, pϵ{1, ..., n} or ∆∗p + Ω∗p = 0 then the per-formance of pth two-stage process is CSW efficiency, i.e., ℓ∗p = 1.
Proof. See definition (2.1) and according to the model (2.8) we will ℓ∗p= 1.
In our model will address three important is-sues:
(1) Two-stage process management obtains the preferable ranking with determining the common weights.
(2) One of the popular methods for evaluating and ranking DMUs is the common set of weights (CSW) method. Another advan-tage is that common set of weights does not require different weights for two-stage pro-cesses.
(3) This method is applied in order to obtain a ranking by modifying the model (2.4).
(4) Model (2.4) is to evaluate each two-stage pro-cess optimistically. But the common set of weights model proposed in this paper can be formulated to obtain performance evaluation and ranking all of the two-stage processes es-pecially supply chain.
(5) This method reduces computation and high accuracy.
(6) This CSW is important when the number of two-stage process s regarding the number of inputs, intermediate products and outputs are small.
(7) CSW to create the best efficiency score of one group composed of efficient two-stage process s. Then, we use this common set of weights to evaluate the absolute efficiency of each ef-ficient DMUs in order to rank them.
2.4 An application to bank branches
Loan (LO) and Profit (PR). Credit (CR) and Interbank Loan (IL) are intermediate products, Table 1, (The data are taken from Annual Re-port (2004) of China Construction Bank in Anhui Province). In this application, the performance evaluation of each bank is shown in Table2. The 3th and 5th column of Table 2 report the [4] ef-ficiency and CSW efef-ficiency score obtained from models (2.4) and (2.8), respectively. The model (2.8) shows that manager chooses the most favor-able weights for the group that compromise all banks under the CSW. As listed in Table 2, per-formance evaluation of Hefi branch is better than all of another branch. The 4th and 6th column of Table 2 show the results of the ranking calcu-lated from the model (2.4) and model (2.8). Hefi, Huaibei, Maanshan, Suzhou, Chuzhou branches is the same ranking in both the model (2.4 and (2.8). Our method reduces computation and high accuracy.
3
Conclusions
Performance improvement and the role of perfor-mance evaluation is an increasingly supply chain topic. Business pressures are now required to be-come even more effective and efficient, execute better on twostage process management on sup-ply chain to remain competitive. In some cases of two-stage process s differing weights for the same factors of two-stage processes may not accept-able in the performance evaluation of two-stage processes. In this paper, we proposed a method for obtaining common set weights in a DEA two-stage process problem. The method proposed can obtain measure efficiency and ranking all of the two-stage processes.
The presented model has important applications in areas such as supply chain and small and medium enterprise (SME). This approach applied to serial process applies as well to more sub mem-bers of two-stage process structures under dy-namic situation and cost, revenue and profit ef-ficiencies in two-stage process. This method re-duces computation and high accuracy.
Acknowledgments
The authors would like to thank institute for Trade Studies & Research (ITSR) for their con-structive comments and suggestions which helped prove the paper.
References
[1] A. L Al, L. M. Seiford, The Mathematical Programming Approach to Efficiency Mea-surement, The Measurement of Productive Efficiency: Techniques and Applications, H. Fried, C. A. Knox Lovell, and S. Schmidt (editors), Oxford University Press, London,
(1993).
[2] A. Charnes, W. W. Cooper, Programming with linear fractional functional, Naval Re-search Logistics Quarterly 9 (1962) 181-185. [3] C. M. Chen, A network-DEA model with new efficiency measures to incorporate the dynamic effect in production networks, Eu-ropean Journal of Operational Research 194 (2009) 687-699.
[4] Y. Chen, W. D. Cook, N. Li, J. Zhu, Ad-ditive efficiency decomposition in two-stage DEA, European Journal of Operational Re-search 196 (2009) 1170-1176.
[5] Y. Chen, J. A. Du, H. D. Sherman, J. Zhu, DEA model with shared resources and effi-ciency decomposition, European Journal of Operational Research 207 (2010) 339-349. [6] D. K. Despotis, Improving the
discriminat-ing power of DEA: focus on globally efficient units, Journal of the Operational Research Society 53 (2002) 314-323.
[7] D. Estampe, S. Lamouri, J.L. Paris, S. Brahim-Djelloul, A framework for analyzing supply chain performance evaluation mod-els,International Journal of Production Eco-nomics 142 (2013) 247-258.
[8] F. H. F Liu, H. H. Peng, Ranking of units on the DEA frontier with common weight, Computers and Operation Research
[9] F.H. Franklin Liu, H. Hsuan Peng, A sys-tematic procedure to obtain a preferable and robust ranking of units,Computers & Oper-ations Research 36 (2009) 1012-1025. [10] Z. Gong, An economic evaluation model of
supply chain flexibility,European Journal of Operational Research 184 (2008) 745-758. [11] A. Hashimoto, D.A. Wu, A
DEA-compromise programming model for comprehensive ranking, Journal of the Operations Research Society of Japan 47 (2004) 73-81.
[12] F. Hosseinzadeh Lotfi, A. Hatami-Marbini, Per J. Agrell, N. Aghayi, K. Gholami, Allo-cating fixed resources and setting targets us-ing a common-weights DEA approach, Com-puters & Industrial Engineering 64 (2013) 631-640.
[13] S.K. Jakhar, Performance evaluation and a flow allocation decision model for a sus-tainable supply chain of an apparel indus-try,Journal of Cleaner Production 87 (2015) 391-413.
[14] C. Kao, S. N. Hwang, Efficiency decomposi-tion in two-stage data envelopment analysis: An application to non-life insurance compa-nies in Taiwan,European Journal of Opera-tional Research 185 (2008) 418-429.
[15] R. KianiMavi, S. Kazemi, J. M. Jahangiri, Developing Common Set of Weights with Considering Nondiscretionary Inputs and Using Ideal Point Method,Hindawi Publish-ing Corporation, Journal of Applied Mathe-matics 2013.
[16] L. Liang, W. D. Cook, J. Zhu, DEA models for two-stage processes: Game approach and efficiency decomposition,Naval Research Lo-gistics 55 (2008) 643-653.
[17] L. Liang, F. Yang, F, W. D. Cook, J. Zhu, DEA models for supply chain efficiency eval-uation, Annals of Operations Research 145 (2006) 35-49.
[18] A. A. Noora, M. Khodabakhshi, A. Payan, M. Nozohour, Common Set of Weights Ap-proach in Stochastic DEA and its Applica-tion to Chief Executive Officers of US Public Banks and Thrifts, Acta computer 1 (2012) 193-205.
[19] S. Ramazani-Tarkhorani, M. Khodabakhshi, S. Mehrabian, F. Nuri-Bahmani, Ranking decision-making units using common weights in DEA,Applied Mathematical Modelling 38 (2014) 3890-3896.
[20] Y. Roll, W. D. Cook, B. Golany, Controlling factor weights in data envelopment analysis,
IIE Transactions 23 (1991) 2-9.
[21] Y. Roll, Alternate methods of treating factor weights in DEA,Omega 21 (1993) 99-109. [22] M. Sanei, S. Mamizadeh-Chatghayeh,
Appli-cation of non-radial models in evaluation of performance of supply chain, International Journal Emerging Science (IJES) 2 (2012) 161-170.
[23] M. Sanei, S. Mamizadeh-Chatghayeh, Eval-uation of Supply Chain Operations using slacks-based measure of efficiency, Inter-national Journal Industrial Mathematics 3 (2011) 35-40.
[24] Z. Sinuany-Stern, L. Friedman, DEA and the discriminated analysis of ratios for ranking units, European Journal of Operational Re-search 111 (1998) 470-478.
[25] Y. Wu, M. Dong, T. Fan, Sh. Liu, Perfor-mance evaluation of supply chain networks with assembly structure under system dis-ruptions,Computers & Operations Research
39 (2012) 3229-3243.
[26] J. Xu, B. Li, D. Wu, Rough data envelop-ment analysis and its application to supply chain performance evaluation,International Journal of Production Economics 122 (2009) 628-638.
Annals of operation research185 (2009) 195-211.
Somayeh Mamizadeh-Chatghayeh is an Iranian business executive. She is the current chair, president and Chief executive officer (CEO) of SDO and BSDO, and the first woman to head the company. She has got Ph.D and B.SC and M.SC degrees in Applied Mathematics, Operation Re-search field from Islamic Azad University, Central Branch, Tehran, Iran. Her research focuses on supply chain management, reverse logistic, Data Envelopment Analysis, Value Chain and Advance Analysis of Small to medium-sized manufacturing enterprises (SME). She is member of United Na-tions Industrial Development Organization, Asia Business Clusters Networks Development Foun-dation Cooperation.