ISSN: 2334-2986 (Print), 2334-2994 (Online) Copyright © The Author(s). All Rights Reserved. Published by American Research Institute for Policy Development DOI: 10.15640/jea.v3n1a8 URL: http://dx.doi.org/10.15640/jea.v3n1a8
Sales Forecast of Electric Vehicles
Antonio Naranjo Redondo
1& Alberto Pérez Cagigas
2Abstract
The present research presents the sales forecast of electric vehicles in Spain until the year 2040, all of these under the conditions of different technological generations and scenarios. Although the market structure isn’t clear yet, goverments and car makers recognize that is an important strategical factor to know the sales forecast to mid and long term; so both could design the most suitable strategy. The evolution of the transition between ICE and EV is conditioned by objective factors (Fuels prices, autonomy range and government grants) and subjective factors (Post-materialist values related with ecology and the interest in new technologies). The present research uses a developed versión of the Bass Model (1969), known as BB-04X (P. Bass & Frank, 2004), which allows to contemplate different generations of the product as well as the leap-frogging phenomenon. A preference model is used to calculate the number of potencialdrivers, this contemplates that the switch can be based in the drivers preferences only when the EV has a certain amount of features, independently of the entry barriers and the forced adoptions. All the data used has been obtained form the survey developed by IPSOS-TRT company in different countries of the European Union in 2012. The present research presents the sales forecast of electric vehicles in Spain until the year 2040, all of these under the conditions of different technological generations and scenarios. It uses a developed versión of the Bass Model (1969), known as BB-04X (P. Bass & Frank, 2004), which allows to contemplate different generations of the product as well as the leap-frogging phenomenon.
Keywords: Electric Vehicle (EV), Bass Model, InternalCombuston Engine (ICE), forecasting, sales
Background Related with the Methodology Design
Given the advantages associated with the Bass Model, in recent years different versions have been used to predict the EV diffusion of EV (Becker et al., 2009; Feeney & Adams, 2009; Jeon, 2010; Liu, Klampfl, Tamor, & Co, 2014; Wei, Wu, & Huang, 2009). Following these cases, this paper aims to use the potential of the Bass diffusion model to analyze the adoption of the EV in the Spanish market.
Becker, and Tenderich Sidhu (2009) used a single model of Bass (1969) to predict the adoption of new
technology in the time interval between 2010 and 2030. The work of Becker et al. (2009) suggests that starting, all drivers are susceptible EV market potential, and then discards some of them based in their transportation behavior. This paper aims to make a more comprehensive approach to the calculation of the potential EV market, therefore, has developed a model taking into account individual preferences and circumstances (ie barriers and assumptions of forced adoption) models the possibility that the driver is part or not of the potencial EV market.
1
Director of Industrial Engineering. UEM, European University of Madrid, C/Tajo 28670 Villaviciosa de Odón Madrid. Phone: +34 661 549 868
2
Feeney and Adams in his work for AECOM (2009) about the spread of EV on the horizon 2050 used
different scenarios derived from factors such as infrastructure development or expectations of changes in fuel prices
Jeon (2010) studied the expansion of HEV in the US, using a modification of the original Bass model (ie
Norton & Bass-87), which allows taking into account the number of generations in which the expansion of the technological innovation is developed.
Contract & Lot (2012) shaped in a theoretical model the factors that may affect the adoption of the electric
car clearly distinguishing between adoption in the commercial sector and private. Adoptions by private users would be influenced by the attitudes that ultimately have an effect on the behavior of the user-consumer. To that effect, this work is also based on a model of preferences for developing the M parameter, that is, to determine who is part of the potential EV market.
Shoemaker (2012) used the Bass model to predict the spread of vehicles using alternative energies as fuel.
Yimin Liu et al. (2014) also they used a modified Bass model to predict the spread of PHEV. In their
model, apart from including the price of the vehicle, they had other factors such as GDP and driving costs (fuel price derivatives).
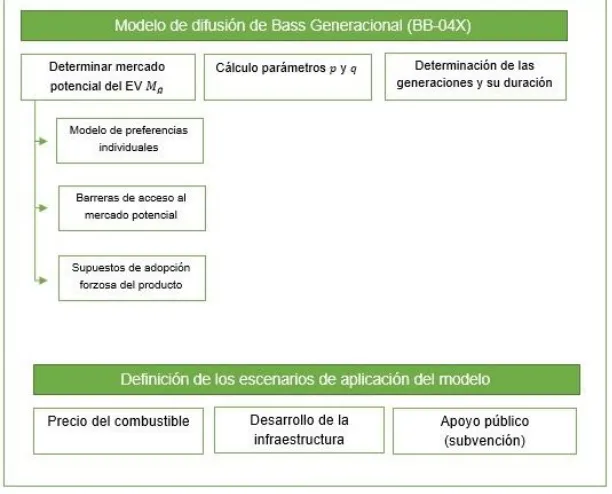
Methodology
The used methodology follows the next steps, in first place the Bass model is presented and all the items related with it must be specified according to the present research (i.e. potencial market, p and q parameters for innovators and followers, time or number of generations and their lifespan). To determinate the potencial market size, firstly a preference model is developed useing the survey data. After this, we can differentiate segments based in their characteristics (i.e. Transportation habits or socio-economic characteristics) and exclude them from the potencial market - this is known as entry barriers. Later the forced adoptions are included – this means that in many cases the individual could be included in the potencial market independently of his preferences. Now, we can present the three
scenarios used in the proposed model under different conditions of three parameters: fuel prices, charge
infrastructure development and governmanet grants. Finally, for each scenario two cases habe been studied: renting
and selling batteries.
Explanation of the Model Applied
Individual Preferences Model
The preference model assesses how technological changes in the EV, along with other demographic characteristics, affect the propensity to purchase an EV as the next vehicle compared to ICE, based on a priori probability. Given the characteristics of Bass model, Mg parameter, which represents the potencial growth of a technological innovation market by generation, setting the limits of the expansion, the maximum number of adopters of the product in each generation. Following other studies that have analyzed the process of adoption of the EV (Becker et al, 2009;. Feeney & Adams, 2009), this research involves identifying the factors that can influence a driver to be part or not of the potential market (iedrivers preferences, entry barriers and cases of forced adoption), to adapt this parameter to the characteristics of the Spanish market. As for forced adoptions, there are individuals who will be forced to become EV users, since the decision on the adoption of the technological innovation is taken by someone else. For example, in the workplace, the company can provide workers with an EV for their daily work. Similarly, there are some user segments, due to its characteristics, which are preferring an EV versus an ICE as next vehicle but they can’t be users due to the segment where they belong. In this group we can distinguish the technical barriers, related to issues such as autonomy and sociological barriers established by socio-economic criteria. In this case, they are excluded because of their low probability to be part of potential adopters.
Number of Generations and their Lifespan
The number of generations are related with the evolution of the technical characteristics of the EV.
Advances in research and development of new batteries will set the maximum autonomy of electric vehicles, which is the most influential variable in buying an electric car. Moreover, another variable to be considered is the time required for the development of a generation of EV. The possibility of a reduce in the lifespan of the generation as effect of the passage of time, generations tend to be shorter when the product it’s been on the market for a longer time. Generations and their duration have been established based on industry reports such as: Boston Consulting Group - "Focus Batteries for Electric Cars" (2011). (See Table 1).
GEN1 GEN2 GEN3
From 2010 to 2020 From 2020 to 2028 From 2028 to 2040
Table 1: Differentgenerations
One of the previous decisions the analysis was to establish the cutoffs for each generation to classify individuals as likely to acquire the EV against ICE, and partially correct biases arising in models declared intentions. (Juster, 1960, 1966; Morwitz & Schmittlein, 1992; Theil & Kosobud, 1968).
Mg Parameter
This first part of the development of Mg aims to determine the proportion of drivers who would purchase an EV versus an ICE to different EV settings.
Statistical Model and Data Used
In this last phase of the survey, the respondent could make three improvements to any of the following characteristics: purchase price, range, recharge time, recharge ability in house without a garage. The respondent could choose reduce the price in 3000 euros or improve autonomy in 50 km or reduce recharge in half an hour, or be able to recharge at home without a private garage. After implementing the three selected changes by the respondent, the final characteristics of the vehicle were presented again, and drove him to ask about the probability (a posteriori) that the next vehicle acquired outside the EV modified by the user against the ICE (Fiorello et al., 2012). The sample size for Spain was 617 cases.
Scenarios
This research presents three scenarios, one of maximum diffusion characterized by high oil prices,
significant aid for the purchase and a great development of the charging infrastructure. At the other extreme a scenario of slow development characterized by low oil prices, less aid to the purchase and poor recharging infrastructure. The third scenariois an intermediate situation, called "late development".
Binary Logistic Regressionprobit Model
The model includes three independent variables, the probability of purchase a priori, the technical characteristics of the vehicle (purchase price, autonomy, recharge time and the ability to recarge the car) and sociodemographic variables (age, prior knowledge of the product, the tenure of housing, sex and garagedisponibility). As for the a priori probability, this is defined as the probability that under the conditions of that time (2011), the interviewee prefer to buy an EV versus an ICE as their next vehicle. Works such as Rogers (1962) show that all individuals have the same predisposition to acquire technological innovations, the prior probability is to set the baseline scenario that faces the entry of the EV in the Spanish market.
Individual Preferences Model Explained
In order to set the scenarios which this research work and recommendations to the agents involved in the value chain in order to encourage the adoption of electric mobility, this study summarizes the main results of most recognized surveys (IBM-2011, EurotaxGlass 2010, Cetelem 2011, BCG-2011, 2010 Accenture, Deloitte, 2010, Deloitte-2011, va-2010, 2010 Harvard, UCLA, 2011, Airbiquity-2010, Fiorello et al., 2012 ) about the drivers preferences, the variables considered critical and entry barriers. Between 50% and 75% of all respondents at the cited studies say:
The reasons why they would take the electric car are saving and environment. The entry barriers are ignorance, price, range and recharging.
A development of recharging infrastructure favor the adoption of EVs
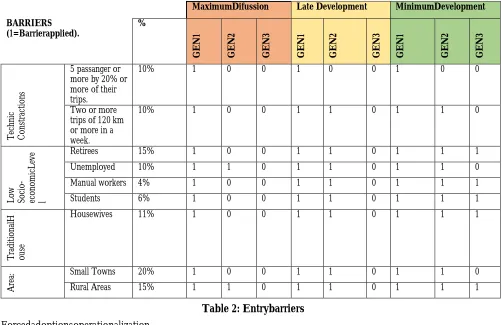
Entry Barriers Operationalization
To find out which sectors of society are likely to be excluded we used as reference two studies conducted in the US, that use barriers in predicting the spread of EV. In the case of Becker et al. (2009), the barriers are applied in considering the oil price scenario, so in the baseline, it is considered that households where vehicles make a monthly trip of over 80 miles should be excluded; to this, in the scenario of high oil prices, the vehicles in which 20% or more of the trips are made with 5 or more occupants and owners of large homes and high-income vehicles are excluded too. In the high oil prices scenario, the excluded vehicles reaches 30% of the US fleet Similarly, Rosenfeld &
Nyquist (2009) added another type of barriers when they estimate the potential size of the EV market. In this case,
eliminate market households with low and high incomes from the market for different reasons, the first ones because they can’t afford the higher cost of an EV, and the second ones because they have enough income to follow other criteria than price when purchasing a new vehicle. This research considers two barriers have been created related
to the technical limitations of EV, those who have more than five passengers by 20% or more of their trips, and
those who make two or more trips of 120 km or more in a week. Subsequently it included as a barrier to reside in a
low-income household, for this we have used socio-demographic profiles. In the section of barriers resulting from
Finally, the housewives have been included in this group since its role is identified by a traditional home in which there are often innovative in adopting durable goods (Tezanos & Field, 2008). Finally, the barriers have also
included two types of area, small towns and rural areas. According to several studies on the expansion of EV
(Becker et al, 2009;. Feeney & Adams, 2009; Rosenfeld & Nyquist, 2009;.Thiel et al, 2012), the development and form of the development of infrastructure on the recharge and change (if possible) of the batteries will be critical to the expansion of EV. In this case, rural areas and small towns are the places where infrastructure expansion could be delayed, in part because the proportion of innovators is often below average in these segments. The operationalization of the barriers and the percentage of population that affects each, is set out in Table 2.
MaximumDifussion Late Development MinimumDevelopment
BARRIERS (1=Barrierapplied). % G E N 1 G E N 2 G E N 3 G E N 1 G E N 2 G E N 3 G E N 1 G E N 2 G E N 3 T ec h n ic C o n st ra ct io n s
5 passanger or more by 20% or more of their trips.
10% 1 0 0 1 0 0 1 0 0
Two or more trips of 120 km or more in a week.
10% 1 0 0 1 1 0 1 1 0
L o w S o ci o -ec o n o m ic L ev e l
Retirees 15% 1 0 0 1 1 0 1 1 1
Unemployed 10% 1 1 0 1 1 0 1 1 0
Manual workers 4% 1 0 0 1 1 0 1 1 1
Students 6% 1 0 0 1 1 0 1 1 1
T ra di ti o n al H o u se
Housewives 11% 1 0 0 1 1 0 1 1 1
A
re
a: Small Towns 20% 1 0 0 1 1 0 1 1 0
Rural Areas 15% 1 1 0 1 1 0 1 1 1
Table 2: Entrybarriers
Forcedadoptionsoperationalization
The operationalization is contained in
Table 3. Note, as with barriers, the application or not in the model changes depending of the scenario.
MaximumDifussion Late Development MinimumDevelopme nt
FORCED ADOPTIONS (1=Applied). %
G E N 1 G E N 2 G E N 3 G E N 1 G E N 2 G E N 3 G E N 1 G E N 2 G E N 3
CEO–Managers/gestión media (Business Vehicle) 1 1 1 1 1 1 1 1 1 1
Manual workers (Business Vehicle) 4 0 1 1 0 1 1 0 0 1
Fuel Prices: Scenariosoperationalization
In most work done about the expansion of EV, the price of fuel and its possible evolution is taken into account (Becker et al., 2009; Feeney & Adams, 2009; Liu et al, 2014.) Under the EV concept and possible adoption, lies a rational element related to potential savings in the medium and long term, since generally, due to the special features of these vehicles and reduced range of models available the purchase cost, on average, is usually higher in the case of EV (Boston Consulting Group, 2011, Cetelem Observatory, 2013). This paper aims to articulate the possibilities opened by the barriers and forced adoptions, including the effect that could have fuel prices on the rate of adoption of EV. Another key aspect in the expansion of EV that this analysis aims to take into account concerns the infrastructure development. This development enables the expansive use of the EV and therefore a number of studies that have been concerned about this aspect (Becker et al, 2009;. Feeney & Adams, 2009; Thiel, 2013). In the case of technical barriers, it has been assumed that the limitations imposed by the autonomy of the EV can be mitigated in the case that the charging infrastructure is developed. When the ability to recharge the EV away from home has been developed, however limited autonomy EV compared to the ICE this won constitute a technical barrier, since drivers could cover long distances regardless of the number of times they had to refuel.
Mg Parameter Operationalization
The application of the three factors which include Mg is performed in a hierarchical manner. First we have calculated the probability of preferring an EV compared to ICE for all individuals. Subsequently, irrespective of the individual preferences, those affected by any of the barriers are excluded from the potential market. Finally, individuals who have corporative vehicle and belong to any of the professional areas mentioned in the previous section are automatically included in the potential audience.
Calculating Base
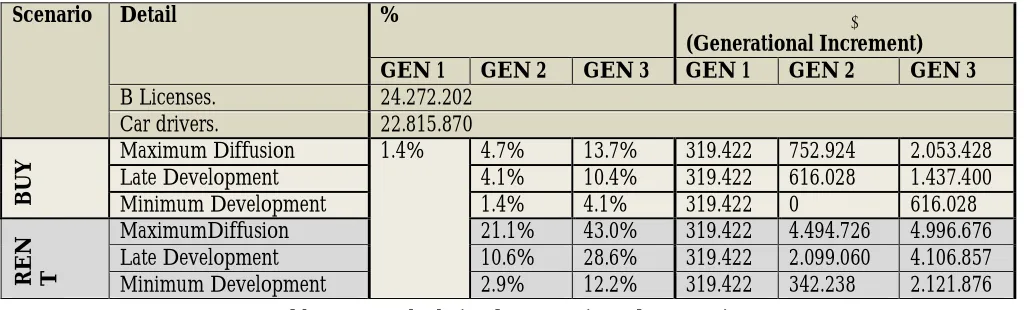
According to DGT, at December 31, 2012, in Spain were 26.309.230 valid driving licenses, excluding licenses for heavy agricultural vehicles and vehicles for the disabled.(http://www.dgt.es/Galerias/seguridad-vial/estadisticas-e-indicad1ores/censo-conductores/series-historicas/2012.pdf). Of those driving licenses, 24.272.202 are driving cars (ieB License). (http://www.ine.es/jaxi/menu.do?type=pcaxis&path=%2Ft20%2Fp321&file=inebase&L=0 ) Once established this base, the CIS barometer at September 2013 gives us an approximate ratio of those who have driving license and those who, even occasionally, drive a car. (http://datos.cis.es/pdf/Es2997mar_A.pdf). From this basis, and taking the final calculation of percentages for Mg, it is presented in
Table 4. In this table you can find the value of Mg for each scenario, for more information about setting up different scenarios readingthe section of the report devoted to this aspect is advised.
Scenario Detail %
(Generational Increment)
GEN 1 GEN 2 GEN 3 GEN 1 GEN 2 GEN 3
B Licenses. 24.272.202
Car drivers. 22.815.870
B
U
Y Maximum Diffusion Late Development 1.4% 4.7% 4.1% 13.7% 10.4% 319.422 319.422 752.924 616.028 2.053.428 1.437.400
Minimum Development 1.4% 4.1% 319.422 0 616.028
R
E
N
T
MaximumDiffusion 21.1% 43.0% 319.422 4.494.726 4.996.676
Late Development 10.6% 28.6% 319.422 2.099.060 4.106.857
Minimum Development 2.9% 12.2% 319.422 342.238 2.121.876
Table 4: Mg Calculation by Scenario and Generation
As for the final results in
Table 4 it should be noted that it was decided to maintain a constant population base over time, because do not exist evidences that make us consider large population movements.
SSE
319,422 .00047* .4919* .91 26521.6
* p<.05
Table 5: p y q Parameters
The comparison of data based on other studies and parameters derived from historical data of registrations in Spain, we suggest that the expected evolution of EV is in line with other studies.
Study Objetive Param eters
Liuet al.(2014) Determine EV expansion rhythm in US. p=0.00303; q=0.6631 McManus & Senter(2009) Determine PHEV expansion in US. Uses Bass and
Generalized Bass.
0.0012<p<0.0026; 0.709<q<0.779 Jeon (2009) Determine Hybrid and electric expansion in US.
Norton-Bass ´87 – with constant parameters across different generations.
0.01<p<0.03; q=0.3
Shoemaker (2012) Bass model to study the diffusion of vehicle using alternative fuels.
p=0.007; q=0.39
Table 6: Different Studies and Their Parameters
We will use our own parameters calculated for Spanish case for the first generation and applied to the two subsequent generations. About this Norton & Bass (1987)spoke, stating that there is usually minimal differences in the parameters of different generations for most products do not imply a difference in the development of the model.
Time Factor: Generations and Lifespan
A generation should be interpreted as a perceptible change to the user (Bass & Bass, 2004b). In this work it has been established as the basic criterion of technological change, the change in the EV characteristics that is truly a leap to the user. Following this and based on the first and clearer criteria, the technical characteristics of EV, we can announce that in the next 30 years could talk about three generations. The first began in 2010 and is a first EV prototype that given its limited autonomy and low coverage in terms of infrastructure has a limited travel market for both businesses and individuals. With the substantial changes expected from 2020 (ie increased autonomy, reduced load time ...), we could talk of a second generation in which the technical features make it a viable alternative for a significant portion of the drivers that not make long journeys routinely (Boston Consulting Group, 2011). Likewise, it is expected that the time technological development will go shorter, examples of other products such as MP3 players or mobile phones show that with time and market opening, elapsed time between generations it is lower. (PI Bass & Bass, 2004; Norton, 1986).
Results
Scenario Buy/Rent Battery M total Acumulated Adoptions
2020 2028 2040
Maximun Diffusion
Buy 3.125.774 57.145 350.115 1.801.027 Renting 9.810.824 59.435 629.002 6.500.993
Late Development Buy 2.372.850 57.061 339.601 1.442.617
Renting 6.525.339 57.969 451.055 3.856.675
Minimum Development
Buy 935.451 56.684 293.480 545.301
Renting 2.783.536 56.894 319.745 1.428.773
Table 7: Scenarios Summary
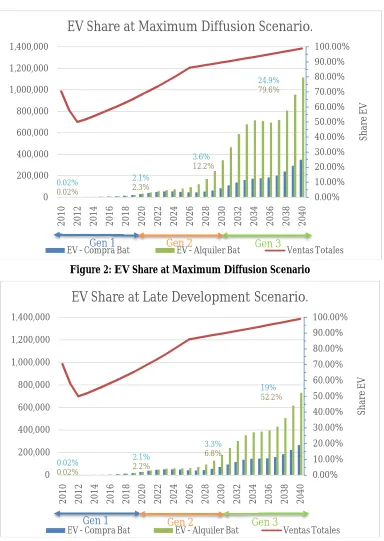
As summary:
MaximunDiffusion Late Development MinimunDevelopment
Buy Renting Buy Renting Buy Renting
2010 0.02% 0.02% 0.02% 0.02% 0.02% 0.02%
2020 2.1% 2.3% 2.1% 2.2% 2.1% 2.1%
2028 3.6% 12.2% 3.3% 6.8% 1.8% 2.7%
Table 8: Adoption
Figure 2: EV Share at Maximum Diffusion Scenario
Figure 3: EV Share at Late Development Scenario
Conclusions
46% of Spanish drivers declared that they would choose an EV before an ICE in 2011. In the period of time for which data (2010-2013) are available, these positive attitudes have not translated into actual behaviors (ie 934 cars EV-PHEV registered in Spain in 2010-2012).
The slow pace of EV expansion despite positive attitudes toward the product by conductors suggests that Spain is moving in a late development scenario with regard to the incorporation of new technology.
0.00% 10.00% 20.00% 30.00% 40.00% 50.00% 60.00% 70.00% 80.00% 90.00% 100.00% 0 200,000 400,000 600,000 800,000 1,000,000 1,200,000 1,400,000 2 0 1 0 2 0 1 2 2 0 1 4 2 0 1 6 2 0 1 8 2 0 2 0 2 0 2 2 2 0 2 4 2 0 2 6 2 0 2 8 2 0 3 0 2 0 3 2 2 0 3 4 2 0 3 6 2 0 3 8 2 0 4 0 Sh ar e E V
EV Share at Maximum Diffusion Scenario.
EV - Compra Bat EV - Alquiler Bat Ventas Totales
0.02% 0.02% 2.1% 2.3% 3.6% 12.2% 24.9% 79.6%
Gen 1 Gen 2 Gen 3
0.00% 10.00% 20.00% 30.00% 40.00% 50.00% 60.00% 70.00% 80.00% 90.00% 100.00% 0 200,000 400,000 600,000 800,000 1,000,000 1,200,000 1,400,000 2 0 1 0 2 0 1 2 2 0 1 4 2 0 1 6 2 0 1 8 2 0 2 0 2 0 2 2 2 0 2 4 2 0 2 6 2 0 2 8 2 0 3 0 2 0 3 2 2 0 3 4 2 0 3 6 2 0 3 8 2 0 4 0 S h ar e E V
EV Share at Late Development Scenario.
EV - Compra Bat EV - Alquiler Bat Ventas Totales
0.02% 0.02% 2.1% 2.2% 3.3% 6.8% 19% 52.2%
The fact that Spain is placed on the late development/minimum development scenario now is reversible to the extent that stakeholders are mobilized to promote the expansion of EV.
Scenario analysis indicates the power of contextual circumstances defining the rate of EV expansion.
The most favourable situation for the incorporation of electric vehicles into the market would be under the conditions of battery renting, which reach a total share of 79% of registrations in 2040. On the other hand, if under the same conditions maximum diffusion scenario, the assumption of battery purchase will get total share would be 25% by 2040.
For the "minimal development" scenario, sales with battery renting would be close to 20% of the national share sales and purchase batteries with 7.5% in 2040, mainly due to its higher price.
There is a delay in the adoption of product that could affect future generations, as shown by the slow transitions in the generational models, if the stakeholder don’t mobilize to promote the incorporation of EV vehicles into the Spanish market.
The technical characteristics of EV seem to not have a clear relevance in changing preferences. An exception is the case of the possibility of charging the EV without having a garage, which seems essential for Spanish drivers. The late development scenario suggests that by 2028 between 300,000 and 450,000 drivers have adopted the new
technology, depending on the case of acquisition of batteries (ie purchase / leasing). The accumulated number of adoptions could rise to about 4,000,000 in the case of battery rental if after a slow development in the medium term will give the necessary factors to promote a late development.
The minimum development scenario under the assumption buying batteries portends the possibility of an indefinite delay in the expansion of EV if the contextual factors take negative values.
The route of marketing of batteries (ie rent / purchase) cause very significant differences in the rate of adoption and this should be taken into account for the marketing strategy in Spain.
References
Estudiorealizadoen 2011 por “IBM Institute for Business Value Advancing Mobility Study” denominado “The shift to electric vehículoeléctricohicles. Puttingconsumers in thedrivehículoeléctricor’sseat”.
Estudio realizado en 2010, por “EurotaxGlass”, denominado “CONSUMER VIEW “
Estudio realizado en 2011 por el “Observatorio Europeo Cetelem. Gabinete de estudios y consultoría BIPE”, denominado “El coche eléctrico y los europeos “
Estudiorealizadoen 2011 por “Boston Consulting Group”, denominado “Powering Autos to 2020: The Era of the Electric Car?”
Estudiorealizadoen 2010 por ACCENTURE, denominado “Changing perceptions, hedging bets. Accenture end-consumer survey on the electrification of private transport“,
Estudiorealizadoen 2010 por “Deloitte Touche Tohmatsu Limited’s, DTTL, Global Manufacturing Industry Group” denominado “Unplugged: EV realities versus consumer expectations”
Estudiorealizadoen 2011 por “Deloitte Touche Tohmatsu Limited’s, DTT, L Global Manufacturing Industry Group”, denominado “Gaining Traction: Will Consumers Ride the Electric Vehícle?”,
Estudios realizados en 2010 por los investigadores Philip y Wiedererde ”Harvard Kennedy School”, y en 2011 por investigadores de la Universidad de UCLA.
Abramson, P. R., & Inglehart, R. (1994). Education, security, and postmaterialism: A comment on Duch and Taylor’s `Postmaterialism and the. American Journal of PoliticalScience, 38, 797. doi:10.2307/2111607
Bass, F. M. (1969). A new product growth for model consumer durables.
Bass, F. M. (2004). Comments on “A New Product Growth for Model Consumer Durables The Bass Model.” Management Science, 50(12_supplement), 1833–1840. doi:10.1287/mnsc.1040.0300
Bass, F. M., & Ferguson, T. L. (2001). DIRECTV : Forecasting Diffusion of a New Technology Prior to Product Launch, 2001(June), 82–93.
Bass, F. M., Krishnan, T. V., & Jain, D. C. (1994). Why the Bass Model Fits without Decision Variables. Marketing Science. doi:10.1287/mksc.13.3.203
Bass, P., & Frank, M. (2004). IT Waves: Two Completed Generational Diffusion Models. Working Paper, Bass Economics Inc. …. Retrieved from
Bass, P. I., & Bass, F. M. (2004). IT Waves : Two Completed Generational Diffusion Models – Appendices Supplement Copyright , Permissions and Citations.
Becker, T., Sidhu, I., &Tenderich, B. (2009). Electric vehicles in the United States: A new model with forecasts to 2030. Center for …. Retrieved from
http://www.www.odpowiedzialnybiznes.pl/public/files/CET_Technical Brief_Economic Model 2030. pdf Duch, R. M., & Rusk, J. G. (1993). Postmaterialism and the economic condition. American Journal of Political
Science, 37, 747. doi:10.2307/2111573
Feeney, K., & Adams, D. (2009). Economic viability of electric vehicles. AECOM Australia Pty Ltd., Sydney NSW, Tech. Rep, (September). Retrieved from
http://scholar.google.com/scholar?hl=en&btnG=Search&q=intitle:Economic+Viability+of+Electric+Vehicles#2
Fiorello, D., Scarcella, G., Zani, L., &Alemanno, A. (2012). The Travel Survey Results and the Driving Profiles. Deliverable D2 Study to estimate electric vehicle load profiles for selected EU countries based on travel survey data. Service contract for the European Commission JRC-IET Petten (Vol. 1). Milán.
Inglehart, R., & Abramson, P. R. (1999). Measuring postmaterialism. The American Political Science Review, 93, 665– 677. doi:10.2307/2585581
Jeon, S. (2010). Hybrid & electric vehicle technology and its market feasibility. Retrieved from http://dspace.mit.edu/handle/1721.1/59252
Juster, F. T. (1960). PREDICTION AND CONSUMER BUYING INTENTIONS. American Economic Review, 50(2), 604–622. Retrieved from
http://search.ebscohost.com/login.aspx?direct=true&db=bth&AN=8748355&site=ehost-live&scope=site Juster, F. T. (1966). Consumer Buying Intentions and Purchase Probability: An Experiment in Survey Design. Journal
of the American Statistical Association, 61(315), 658–696. Retrieved from
http://www.jstor.org/stable/2282779\nhttp://www.jstor.org/stable/pdfplus/2282779.pdf?acceptTC=true Liu, Y., Klampfl, E., Tamor, M. A., & Co, F. M. (2014). Modified Bass Model with External Factors for Electric
Vehicle Adoption, 7–13. doi:10.4271/2013-01-0505
McManus, W., & Jr, R. S. (2009). Market models for predicting PHEV adoption and diffusion, (46827). Retrieved from http://deepblue.lib.umich.edu/handle/2027.42/64436
Morwitz, V., &Schmittlein, D. (1992). Using segmentation to improve sales forecasts based on purchase intent: Which“intenders” actually buy? Journal of Marketing Research, (November), 391–405. Retrieved from http://www.jstor.org/stable/3172706
Norton, J. (1986). Growth, diffusion and technological substitution in industrial markets: an examination of the semiconductor industry. University of Texas at Dallas.
Norton, J., & Bass, F. (1987). A diffusion theory model of adoption and substitution for successive generations of high-technology products. Management Science, 33(9), 1069–1086. Retrieved from
http://pubsonline.informs.org/doi/abs/10.1287/mnsc.33.9.1069
Observatorio Cetelem 2013. (2013). El automóvil en Europa: 5 marchas para repuntar. Rogers, E. (1962). Diffusion of innovations. Retrieved from
http://books.google.com/books?hl=en&lr=&id=v1ii4QsB7jIC&oi=fnd&pg=PR15&dq=DIFFUSION+OF +innovations&ots=DKTtqMWq6W&sig=eWNZAH-7t5ZR811dIZGAvP8ldwI
Rosenfeld, J., &Nyquist, S. (2009). Averting the next energy crisis: The demand challenge, (March). Retrieved from http://scholar.google.com/scholar?hl=en&btnG=Search&q=intitle:Averting+the+next+energy+crisis+:+The+demand+challenge#0
Shoemaker, M. (2012). A Bass Diffusion Model Analysis: Understanding Alternative Fuel Vehicle Sales. Retrieved from http://scholarship.claremont.edu/cmc_theses/399/
Tezanos, J. F., & Campo, S. del. (2008). España en el S. XXI: La Sociedad (p. 766). Madrid: Biblioteca Nueva.
Theil, H., &Kosobud, R. F. (1968). How informative are consumer buying intentions surveys? The Review of Economics and Statistics, 50(1), 50–59.
Thiel, C. (2013). Projections for Electric Vehicle Load Profiles in Europe Based on Travel Survey Data Contact information (Vol. 1). doi:10.2790/24108
Thiel, C., Alemanno, A., &Scarcella, G. (2012). Attitude of European car drivers towards electric vehicles: a survey. JRC…. doi:10.2790/67556