Advanced Genomic Signal Processing Methods in DNA
Mapping Schemes for Gene Prediction Using Digital
Filters
Mai S. Mabrouk
Biomedical Engineering Department, Faculty of Engineering, Misr University for Science and Technology (MUST University), Egypt
Abstract
Genomic signal processing (GSP) is an engineering domain involved with the analysis of genomic data using digital signal processing (DSP) approaches after transformation of the sequence of genome to numerical sequence. One challenge of GSP is how to minimize the error of detection of the protein coding region in a specified deoxyribonucleic acid (DNA) sequence with a minimum processing time. Since the type of numerical representation of a DNA sequence extremely affects the prediction accuracy and precision, this study aimed to compare different DNA numerical representations (genetic code context (GCC), atomic number, frequency of nucleotide occurrence in exons (FNO), 2-bit binary and electron ion interaction potential (EIIP)) by measuring the sensitivity, specificity, correlation coefficient (CC) and the processing time for the protein coding region detection. The proposed technique based on digital filters was used to read-out the period 3 components and to eliminate the unwanted noise from DNA sequence. This method applied to 20 human genes demonstrated that the maximum accuracy and minimum processing time are for the 2-bit binary representation method comparing to the other used representation methods. Results suggest that using 2-bit binary representation method significantly enhanced the accuracy of detection and efficiency of the prediction of coding regions using digital filters.Keywords
Gene prediction, Digital filters, 3- Base periodicity, Exon, Intron, Bioinformatics, Genomic signal processing1. Introduction
Analysis of genomic sequence using DSP approaches such as filters, transformers and models has been increasingly used to recognize the hidden features and information of these sequences which cannot be achieved by the traditional biological methods [1]. As such, DSP is considered as an significant zone of engineering that understands the numerically represented signal manipulation to create a signal with higher quality from the original signal [2].
The DSP applications on genomic sequences represent a new scope of GSP [3]. The latter is known as the genomic signals spectral analysis by DSP methods and algorithms to reach different goals such as gene (protein coding regions) detection [4], ECG signals analysis [5], MRI signals description [6], microarray image processing [7] and disease prediction [8]. The GSP applications lead to living system understanding for development of new diagnostic and curative apparatus [9].
* Corresponding author:
[email protected] (Mai S. Mabrouk) Published online at http://journal.sapub.org/ajsp
Copyright © 2017 Scientific & Academic Publishing. All Rights Reserved
In eukaryotic organisms, the DNA consists of intergenic and genic areas. As shown in Fig. 1, the genic areas are composed of two sub-areas called exons (coding regions) and introns (non-coding regions) [10].
After sequencing of a new organism, it is required to obtain as much information as possible about its genome. The protein coding regions detection is an essential step to determine the boundaries of exons and introns of a DNA sequence in which the genes and other hidden features are unknown [11-14].
The task of the protein coding region detection out of thousand, millions, or even billions of nucleotides in a DNA sequence is a challenging mission since 2.8% of the human DNA is protein coding [15]. The rigorous detection of these coding regions will help in understanding the functional content of the analyzed DNA sequence [16].
such as: minimum redundancy, compact representation, all nucleotide pairs must have equal distance. Additionally, biological and statistical information of the sequence must be well represented in mathematical properties [17].
Overall, the standing numeral representation methods can be categorized into three main groups. The first group is called: fixed mapping methods (FM) where the DNA nucleotides are converted into a series of arbitrary numerical sequences [18]. The second group is called: physico-chemical property based mapping methods (PCPBM) where biochemical and biophysical characteristics of DNA nucleotides are used for DNA mapping [18]. The third group is called: statistical property based mapping methods (SPBM) in which the DNA sequences are mapped in terms of some statistical properties [18]. Previous studies show that EIIP [19] which is one of the PCPBM methods is the most rigorous representation method for DNA spectral analysis since it is able to realize the coding regions in some genomes where the other methods is unsuccessful in their identification. In addition, the computational efficiency is reduced by 75% [20-23]. Thus, EIIP is the most closely used method for protein coding regions detection of a specific DNA sequence [4, 9, 14, 22].
Other developed representation methods have been lately used as: GCC [24], FNO [25], atomic number [26], 2-bit binary [27]. In GCC method, the DNA sequence is transformed into indicator sequence with one dimension according to the amino acids structure and allocation in three coding frames [28]. The DNA single chain sequence is transformed into the triple codons from three reading frames, and then each amino acid is described by a unique complex number based on the amino acids hydrophobicity characteristics and deposit volumes [29]. If there is a DNA sequence of length N: Y1, Y2, Y3,………,YN, the nucleotide
Yj (j=1,2,……,N-2) is translated into a complex number that
depends on the amino acid encoded by the codon Yj Yj+1 Yj+2.
For a specified DNA sequence, the power spectrum that is obtained by GCC representation method can be used as a unique signature of protein coding information for this sequence, unlike Voss mapping method [30] that may give similar power spectrum for different sequences [28]. In FNO scheme, the nucleotides of DNA sequence are represented based on their frequency of occurrence in the different datasets. This scheme confirms the fact that; exons have higher numbers of nucleotides 'C' and 'G' than introns. In atomic number scheme, the nucleotides in DNA sequence are represented by assigning the atomic number, the total number of protons in each nucleotide. The assigned values are proportional to the nucleotide mass. In 2-bit binary method, 1-D indicator sequence represents the DNA sequence by transforming the nucleotides A, C, G, T into two binary as, 00, 11, 10, and 01 respectively.
The protein coding region detection mainly uses the above illustrated methods using discrete Fourier transform (DFT) spectral analysis. Beyond the 2-bit binary representation scheme which is used for the same purpose, using the based multi-classifier neural network; furthermore, the digital
filters have been used for the protein coding regions detection for EIIP coded sequences of different genes [31, 32]. However, this accuracy still needs to be improved especially in the case of short and multiple exons.
Among the different kinds of DNA numerical representations used yet, it is difficult to choose the suitable representation method as it highly affects the sensitivity, accuracy and computational efficiency of the used method.
Given these limitations, the present study aimed to compare the efficiency of certain advanced numerical representation schemes GCC, FNO, atomic number and 2-bit binary, on the detection accuracy of protein coding regions using digital filters by measuring the specificity, sensitivity, computational complexity and correlation coefficient of each method compared to EIIP method.
Figure 1. DNA structure of eukarvotes
2. Methodology
2.1. Database of DNA Sequence
The different eukaryotic genes of DNA sequences were downloaded from HMR195 dataset presented by SangaRogic [33]. These model genes were selected according to two conditions. The first condition is that the length of the sequence should not over run 10000 base pairs and the second one is that the exons number should be less than five exons.
2.2. Numerical Representation of DNA
The sequences of the selected genes DNA were numerically represented by the following five representation methods:
2.2.1. Genetic Code Context (GCC)
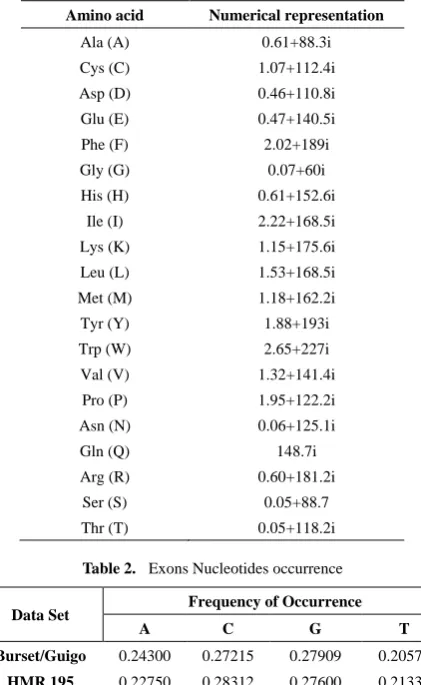
For a specific DNA sequence Y= ACGATTCAGGT, the triple codons for the three reading frames are as follows; the first reading frame is ACG ATT CAG, the second reading frame is CGA TTC AGG and the third reading frame is GAT TCA GGT. For the first frame, [T, I, Q] is the corresponding encoded amino acids, [R, F, R] for the second frame and [D, S, G] for the third frame. As shown in Table 1, each amino acid is described by a unique complex number.
Consequently the numerical vector of DNA sequence is [0.05+ 118.2i, 0.60+ 181.2i, 0.46+ 110.8i, 2.22+ 168.5i, 2.02+ 189.0i, 0.05+ 88.7i, 148.7i, 0.60+ 181.2i, 0.07+ 60.0i].
2.2.2. Frequency of Nucleotide Occurrence
corresponding DNA numerical sequence downloaded from HMR195 dataset is, [0.22750, 0.28312, 0.27600, 0.22750, 0.21336, 0.21336, 0.28312, 0.22750, 0.27600, 0.27600, 0.21336].
Table 1. GCC Based Numerical Representation of the 20 Amino Acids
Amino acid Numerical representation
Ala (A) 0.61+88.3i
Cys (C) 1.07+112.4i
Asp (D) 0.46+110.8i
Glu (E) 0.47+140.5i
Phe (F) 2.02+189i
Gly (G) 0.07+60i
His (H) 0.61+152.6i
Ile (I) 2.22+168.5i
Lys (K) 1.15+175.6i
Leu (L) 1.53+168.5i
Met (M) 1.18+162.2i
Tyr (Y) 1.88+193i
Trp (W) 2.65+227i
Val (V) 1.32+141.4i
Pro (P) 1.95+122.2i
Asn (N) 0.06+125.1i
Gln (Q) 148.7i
Arg (R) 0.60+181.2i
Ser (S) 0.05+88.7
Thr (T) 0.05+118.2i
Table 2. Exons Nucleotides occurrence
Data Set Frequency of Occurrence
A C G T
Burset/Guigo 0.24300 0.27215 0.27909 0.20576
HMR 195 0.22750 0.28312 0.27600 0.21336
2.2.3. Atomic Number
For a specific DNA sequence Y= ACGATTCAGGT, the values of atomic indicator sequence are known as: A=70, G=78, C=58, T=66.
Consequently the corresponding numerical sequence of DNA is, [70, 58, 78, 70, 66, 66, 58, 70, 78, 78, 66]
2.2.4. 2-bit Binary
For a specific DNA sequence Y= ACGATTCAGGT, the values of the 2-bit binary indicator sequence are known as, A=00, G=10, T=01, C=11.
Consequently the corresponding numerical sequence of DNA is [00, 11, 10, 00, 01, 01, 11, 00, 10, 10, 01]
2.2.5. Electron Ion Interaction Potential (EIIP)
For a specific DNA sequence Y= ACGATTCAGGT, the values of the EIIP indicator sequence are known as, A= 0.1260, G= 0.0806, C= 0.1340, T= 0.1335.
Consequently the corresponding numerical sequence of DNA is, [0.1260, 0.1340, 0.0806, 0.1260, 0.1335, 0.1335,
0.1340, 0.1260, 0.0806, 0.0806, 0.1335]
2.3. Protein Coding Region Detection Using Digital Filter
Infinite impulse response (IIR) digital filter are classified based on their equivalent analog filter approximation into the following types; Butterworth, Bessel-Thomson, Elliptic, Chepyshev (Type I) and inverse Chepyshev (Type II). In this study, the inverse Chebyshev (Type II) approximation has been elected because of its high selectivity which can be carried out with a low order transfer function. In addition, it doesn't display any undulation in its passband amplitude response [2] that is necessary for the application of protein coding region detection. In order to eliminate the IIR filter phase response delay, zero phase filtering is applied.
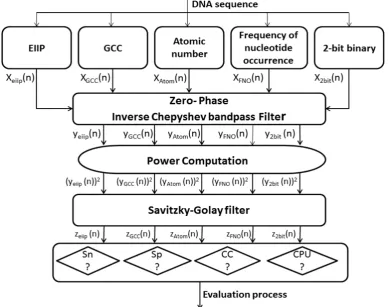
The background noise was removed by Savitzky-Golay (S-G) filter. The latter has the ability to effectively smooth the noisy signal while preserving the signal’s features such as the peak’s width and height. Fig. 2 shows the procedures of the technique realization using MATLAB, in which the numerically converted DNA sequence has been filtered through narrowband bandpass filter designed to read out the period 3 component, the noise has been eliminated using S-G filter, then the evaluation parameters for each numerically represented DNA sequence have been measured.
2.3.1. Zero-phase Bandpass Filtering
The numerical sequence DNA is filtered using Inverse Chepyshev bandpass filter with specifications as follow: Filter order N=3, the lower & upper stopband edge frequencies [0.66, 0.672], the lower & upper passband edge frequencies [0.663, 0.669], the minimum stopband attenuation=30dB, the maximum passband attenuation=1dB. The filter amplitude response is shown in Fig. 3.
2.3.2. Power Computation
When the signals are represented in the frequency domain, the power levels of those signals need to be measured. The signal power is proportional to the amplitude square. For instance, for a specific time domain sequence y(n), the power of that sequence can be defined as |Y(n)|^2. Thus, the power of the output filtered DNA signal was estimated by squaring the signal amplitude.
2.3.3. The Savitzky-Golay Smoothing Filtering
The S-G smoothing filter was applied to smooth the squared signal to noise trajectories of DNA sequences. The main indicator of the S-G smoothing filter was determined by the frame size (N) and polynomial order (M).Various values for M and N were examined for better DNA sequence smoothing. The chosen design parameters are; M=3 and N=51.
2.4. Estimation of Evaluation Parameters
parameters (sensitivity, specificity, correlation coefficient and average CPU run times) were estimated as follows:
Sensitivity (Sn) is the representation method ability to
predict the true exons. In opposite, specificity (Sp) is the
representation method ability to exclude the false exons. The DNA representation method is believed to be rigorous only if
both sensitivity and specificity are high. Correlation coefficient (CC) is the measure of accuracy and ranges from -1 to 1 [34].
The Sn, Sp, and CC can be calculated by the following
equations:
Figure 2. Overall scheme of the proposed system; Sn: Sensitivity SP: Specificity CC: Correlation coefficient CPU: CPU run tine
Figure 3. Amplitude response of the bandpass Type II Chebyshev filter
(1)
(2)
(3)
where TP is True Positive, TN is True Negative, FN is False Negative and FP is False Positive. The definitions of these parameters are shown in Fig. 4. These parameters were computed based on the true exon locations as if the peak of an intron region greater than half of the minimum detected true exon peak, it will be considered as false positive (false exon) otherwise it will be considered as true negative.
Tic and toc commands in MATLAB are used to compute the average CPU run times which are over 1000 run.
3. Results
3.1. The Used Dataset Demographic
To reach our purpose, IIR inverse Chepyshev digital filter was used for applying the detection technique on 20 human testing genes with single and multiple exons which were downloaded from HMR195 dataset. In Table 3, the accession numbers, gene description, sequence length and true exon locations of the genes are shown.
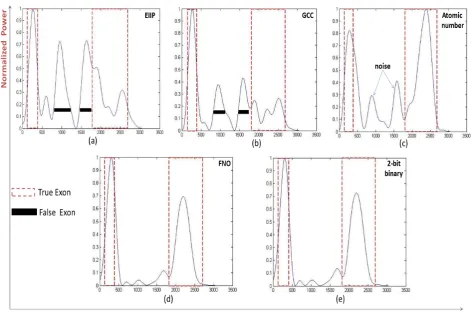
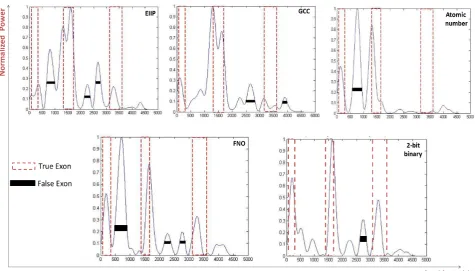
In Fig. 5, 6, 7 and 8, results of four sample genes with different exon numbers are shown. The red dashed box describes the true exon locations while the black bars describe the false exons.
3.2. Single Exon Genes
As shown in Fig. 5, at the level of single exon the frequency of nucleotide occurrence in exons (FNO) and 2-bit binary representation schemes showed a clearly identified high peak at the right location of true exon (964-1938) without any other misleading peaks compared to EIIP, GCC,
and atomic number schemes. Furthermore, when the performance measures were calculated for different single exon genes, the FNO and 2-bit binary representation schemes showed the same highest level of sensitivity, specificity, and correlation coefficient of (100%, 75.228%, and 0.4994) respectively. Of note, the 2-bit binary scheme showed the lowest computational time (7.38ms) among other representation schemes, see Table 4.
3.3. Genes of Two Exonic Regions
The prediction efficiency of the various representation methods on various genes with two exonic regions was explained, the same results were showed by the FNO and 2-bit binary methods at the level of sensitivity and nucleotide position identification and as displayed in Fig. 6 where the two methods efficiently detect the two true exons of (GALNR2) gene at their right positions (115-482, 1867-2662). Although the specificity of the FNO and 2-bit binary schemes were reduced by approximately half of that achieved with the prediction of single exonic region, but they also gave the highest specificity values of (56.012%, 65.02) respectively compared to other schemes. Interestingly the 2-bit binary representation method gave the highest correlation coefficient (0.6838) and minimum processing time (8.5ms) among all representation schemes, see Table 5.
3.4. Genes of Three and Four Exonic Regions
When the five various representation methods were used in the prediction technique which was applied on various genes of three and four exonic regions, the representation method 2-bit binary obviously reinforced the accuracy as compared to the remaining representation methods as displayed in Fig 7 and Fig. 8. Under this setting, two genes of three and four true exon locations analyzed, the true nucleotide positions were carefully detected with minimum number of false exons which appropriate with the highest levels of sensitivity, correlation coefficient, specificity and minimum CPU run time achieved by this scheme, see Tables 6 and Table 7.
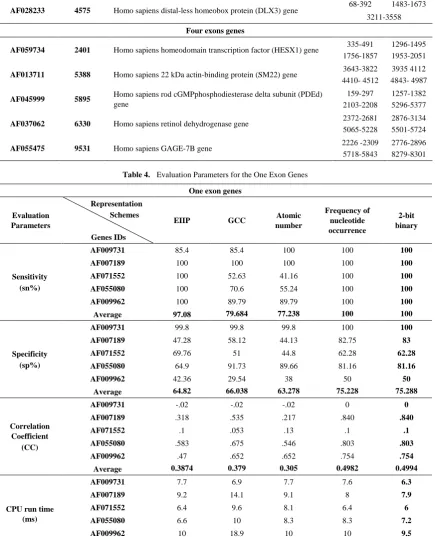
Table 3. Demographic of the dataset used
Gene accession No.
Sequence
length Gene description True exon locations One exon genes
AF009731 702 Lepussaxatilis cytochrome b (cytb) gene 1-702
AF007189 1601 Homo sapiens claudin 3 (CLDN3) gene 477-1139
AF071552 1618 Homo sapiens N-acetyltransferase-1 (NAT1) gene 441-1313
AF055080 2078 Homo sapiens winged-helix transcription factor forkhead 5 gene 964-1938
AF009962 7422 Homo sapiens CC-chemokine receptor (CCR-5) gene 3934-4581
Two exons genes
AF061327 1812 Homo sapiens cyclin-dependent kinase 4 inhibitor D p19 gene 13-153 1245-1604
AF058762 3036 Homo sapiens galanin receptor subtype 2 (GALNR2) gene 115-482 1867-2662
AF042782 3390 Homo sapiens galanin receptor type 2 (GALR2) gene 305-672 2063-2858
AF058761 3607 Homo sapiens ribosomal protein S12 gene 1815-1863 2854-3221
Three exons genes
AF076214 4002 Homo sapiens prophet of Pit1 (PROP1) gene 310-418 1901-2133 3191-3529
AF042001 4034 Homo sapiens zinc finger protein slug (SLUG) gene 447-525 1271-1816 2724-2905
AF015224 4206 Homo sapiens mammaglobin gene 1056-1110 1713-1900 3789-3827
AF036329 4498 Homo sapiens gonadotoropin-releasing hormone precursor 2105-2258 2369-2526 3372-3422
AF028233 4575 Homo sapiens distal-less homeobox protein (DLX3) gene 68-392 1483-1673 3211-3558
Four exons genes
AF059734 2401 Homo sapiens homeodomain transcription factor (HESX1) gene 335-491 1756-1857
1296-1495 1953-2051
AF013711 5388 Homo sapiens 22 kDa actin-binding protein (SM22) gene 3643-3822 4410- 4512
3935 4112 4843- 4987
AF045999 5895 Homo sapiens rod cGMPphosphodiesterase delta subunit (PDEd)
gene
159-297 2103-2208
1257-1382 5296-5377
AF037062 6330 Homo sapiens retinol dehydrogenase gene 2372-2681 5065-5228
2876-3134 5501-5724
AF055475 9531 Homo sapiens GAGE-7B gene 2226 -2309 5718-5843
2776-2896 8279-8301
Table 4. Evaluation Parameters for the One Exon Genes
One exon genes
Evaluation Parameters
Representation Schemes
Genes IDs
EIIP GCC Atomic number
Frequency of nucleotide occurrence
2-bit binary
Sensitivity (sn%)
AF009731 85.4 85.4 100 100 100
AF007189 100 100 100 100 100
AF071552 100 52.63 41.16 100 100
AF055080 100 70.6 55.24 100 100
AF009962 100 89.79 89.79 100 100
Average 97.08 79.684 77.238 100 100
Specificity (sp%)
AF009731 99.8 99.8 99.8 100 100
AF007189 47.28 58.12 44.13 82.75 83
AF071552 69.76 51 44.8 62.28 62.28
AF055080 64.9 91.73 89.66 81.16 81.16
AF009962 42.36 29.54 38 50 50
Average 64.82 66.038 63.278 75.228 75.288
Correlation Coefficient
(CC)
AF009731 -.02 -.02 -.02 0 0
AF007189 .318 .535 .217 .840 .840
AF071552 .1 .053 .13 .1 .1
AF055080 .583 .675 .546 .803 .803
AF009962 .47 .652 .652 .754 .754
Average 0.3874 0.379 0.305 0.4982 0.4994
CPU run time (ms)
AF009731 7.7 6.9 7.7 7.6 6.3
AF007189 9.2 14.1 9.1 8 7.9
AF071552 6.4 9.6 8.1 6.4 6
AF055080 6.6 10 8.3 8.3 7.2
AF009962 10 18.9 10 10 9.5
Table 5. Evaluation Parameters for the Two Exons Genes
Two exons genes
Evaluation Parameters
Representation Schemes
Genes IDs
EIIP GCC Atomic number
Frequency of nucleotide occurrence
2-bit binary
Sensitivity (sn%)
AF061327 71.9 71.9 71.9 100 100
AF058762 77.45 43.02 100 100 100
AF042782 100 100 100 100 100
AF058761 88.4 0 100 88.4 88.4
AF092047 100 100 59.8 100 100
Average 87.55 62.984 86.34 97.68 97.68
Specificity (sp%)
AF061327 49 59.8 43.51 50.91 50.91
AF058762 43.75 28.45 45.49 89.2 89.2
AF042782 100 100 100 100 100
AF058761 26.21 0 18.44 29.45 36.84
AF092047 42.36 40.62 38 50 53.3
Average 42.592 36.374 41.974 56.012 65.02
Correlation Coefficient
(CC)
AF061327 .367 .508 .327 .568 .568
AF058762 .163 -.236 .342 .91 .91
AF042782 .514 .54 .68 .63 .91
AF058761 .364 -.54 .28 .41 .48
AF092047 .415 .206 .235 .551 .551
Average .3646 .0956 .3728 .6138 .6838
CPU run time (ms)
AF061327 8.1 9.8 6.4 7.7 7.3
AF058762 8.6 11.3 10.2 10.4 10.2
AF042782 8.7 11.9 8.6 8.6 8
AF058761 7.8 12.5 7.7 8.9 8
AF092047 9.2 14.7 9.1 9 9
Average 8.48 12.04 8.4 8.92 8.5
Table 6. Evaluation Parameters for the Three Exons Genes
Three exons genes
Evaluation Parameters
Representation Schemes
Genes IDs
EIIP GCC Atomic number
Frequency of nucleotide occurrence
2-bit binary
Sensitivity (sn%)
AF076214 80.3 33.7 95.8 100 100
AF042001 73.13 100 100 82 100
AF015224 100 100 100 100 100
AF036329 76.77 76.77 55.59 98.67 100
AF028233 22.06 22.06 59.7 93.6 100
Average 70.452 66.506 82.218 94.854 100
Specificity (sp%)
AF076214 18.79 5.75 28.99 26.08 27.13 AF042001 18.64 21.15 28.66 23.47 24.54
AF015224 14.35 8.45 7.15 11.1 11.62 AF036329 49.5 75.5 69.15 56.8 56.8
AF028233 9.5 12.66 51.04 39.01 75.9
Correlation Coefficient
(CC)
AF076214 .053 .11 .23 .332 .35
AF042001 .06 .123 .33 .21 .22
AF015224 .29 .139 .074 .22 .231
AF036329 .166 .572 .376 .481 .481
AF028233 -.210 -.109 .437 .498 .8
Average .0718 .165 .2894 .3482 .4164
CPU run time (ms)
AF076214 8.9 12.6 7.8 8.7 7.3
AF042001 8.9 13.5 7.8 8.7 7.3
AF015224 9 13.2 8 8.8 8
AF036329 11.2 10.8 8.6 8.4 7.3
AF028233 8.6 13.3 9.1 8.6 8.2
Average 9.32 12.68 8.26 8.64 7.62
Table 7. Evaluation Parameters for the Four Exons Genes
Four exons genes
Evaluation Parameters
Representation Schemes
Genes IDs
EIIP GCC Atomic number
Frequency of nucleotide occurrence
2-bit binary
Sensitivity (sn%)
AF059734 100 46.8 71.8 68.5 71.8
AF013711 74 74 100 100 86.93
AF045999 95.5 94.4 100 70.14 100
AF037062 100 100 0 100 100
AF055475 54.4 54.4 58 22 100
Average 84.78 73.92 65.96 72.128 91.746
Specificity (sp%)
AF059734 29.33 18.44 21.52 31.81 31.81 AF013711 50.21 50.21 12.04 30.29 89.6 AF045999 20.58 14.81 13.1 16.6 19.67 AF037062 15.88 15.88 0 25.45 36.69
AF055475 3.9 3.9 7 5 7.85
Average 23.98 20.648 10.732 21.83 37.124
Correlation Coefficient
(CC)
AF059734 .283 -.130 -.06 .216 .216
AF013711 .55 .55 .098 .463 .85
AF045999 .276 .201 .187 .063 .306 AF037062 .098 .098 -.203 .3498 .5047 AF055475 .018 .018 .117 -.39 .208
Average .245 .1474 .0278 .1403 .41694
CPU run time (ms)
AF059734 7.2 11.3 8.4 8.3 8.3
AF013711 9 14.1 8.2 8.2 8
AF045999 11.4 13.4 9.2 8.7 7.9
AF013711 9 14.1 8.2 8.2 8
AF037062 9.1 14.1 8.3 9.2 8
Figure 5. Power spectrum of Homo sapiens winged-helix phosphodiesterase delta subunit PDEd gene (AF055080) using a) EIIP, b) GCC, c) Atomic number, d) Frequency of nucleotide occurrence (FNO), e) 2-bit binary schemes
Figure 7. Power spectrum of Homo sapiens distal-less homobox protein DLX3 gene (AF028233) using a) EIIP, b) GCC, c) Atomic number, d) Frequency of nucleotide occurrence (FNO), e) 2-bit binary schemes
4. Discussions and Conclusions
In this study, the effect of various DNA numerical representation methods on the accuracy of protein coding regions (exons) detection was discussed for twenty benchmark human genes using IIR inverse Chepyshev filter.
For this purpose, the sensitivity, specificity and correlation coefficient were measured with four advanced DNA numerical representation schemes (GCC, FNO, atomic number and 2-bit binary) as compared to EIIP, which is considered the most vastly used method for protein coding regions detection [21, 35, 36].
The results observed that the 2-bit binary representation method significantly enhanced the identification accuracy of true nucleotide position as compared to other representation schemes regardless the number of exonic regions in the tested sequences with high levels of sensitivity, correlation coefficient, specificity and minimum processing time compared with other schemes.
These findings are consistent with other studies which used the 2-bit binary in another application and they showed that, the 2-bit binary was the best numerical representation scheme with the human DNA sequences for the promoter prediction application using neural network when compared with the 4-bit binary and integer representation schemes [37, 38].
It was also found that at the level of one and two exonic region detection, the 2-bit binary and FNO representation schemes showed the same high levels of sensitivity, correlation coefficient and specificity when compared with the other schemes even though they are different in their numerical representation based methods. For instance, the 2-bit binary depends on assigning some arbitrarily numbers to the nucleotides while the FNO depends on statistically based measures.
At the level of three and four exonic regions detection, the FNO was considered as the second best choice as compared with the 2-bit binary representation scheme. These results are consistent with previous study which showed that the frequency of nucleotide occurrence and the paired numeric representation schemes improved the accuracy prediction of protein coding regions using DFT base technique [1].
Interestingly, the tested phyisco-chemical representation schemes including (EIIP, GCC and atomic number) showed low levels of prediction accuracy although they reflect the physical and chemical properties of the studied sequences. However, EIIP is still the best choice as it gives the highest prediction accuracy of protein coding regions compared with the GCC and atomic number. These findings are consistent with other studies which showed that using EIIP numerically converted DNA sequences improved the protein coding regions detection accuracy when DFT and artificial neural network techniques have been applied [21, 23]. Of note, we found that the GCC representation scheme showed the longest processing time as compared to all other tested schemes which can be explained as the GCC deals with the 20 amino acid instead of four nucleotides as the other
schemes did.
The present study is considered the first to report that the 2-bit binary is the optimal representation method among the tested methods for protein coding regions detection using digital filters as it opens new frontiers for further studies to use the 2-bit binary scheme in other applications and to include more representation schemes for comparison.
ACKNOWLEDGMENTS
This study has been propped by a grant (ID# 5245) funded from the Science and Technology Development Fund (STDF), Ministry of Scientific Research, Egypt to Mohamed L. Salem, the Principal investigator of this project.
Abbreviation List
GSP: Genomic Signal Processing. DNA: Deoxyribose Nucleic Acid. GCC: Genetic Code Context.
FNO: Frequency of Nucleotide Occurrence. EIIP: Electron Ion Interaction Pseudo potential. DSP: Digital Signal Processing.
RNA: Ribonucleic acid. A: Adenine.
C: Cytosine. G: Guanine. T: Thymine. FM: Fixed Mapping.
PCPBM: Physico Chemical Property Based Mapping. SPBM: Statistical Property Based Mapping.
DFT: Discrete Fourier Transform. IIR: Infinite Impulse Response. Tp: True Positive
Tn: True Negative. Fp: False Positive. Fn: False Negative. Sn: Sensitivity. Sp: Specificity.
CC: Correlation Coefficient.
REFERENCES
[1] Akhtar, M, Epps J, Signal processing in sequence analysis: advances in eukaryotic gene prediction, Selected Topics in Signal Processing, IEEE Journal, pp. 310-321, 2008.
[2] Andreas A, Digital signal processing: Signals, systems, and filters, McGraw-Hill, New York, 2006.
[3] Mabrouk MS, Solouma NH, Eukaryotic gene prediction by an investigation of nonlinear dynamical modeling techniques on EIIP coded sequences, International Journal of Biological and Medical Sciences, 2008.
in DNA sequences using signal processing methods, Industrial Electronics and Applications (ISIEA), IEEE Symposium, 2012.
[5] Smolarik L, Mudroncik D, ECG Signal Processing. Advanced Materials Research, Trans Tech Publ, 2013.
[6] Haldar JP, Hernando D, Compressed-sensing MRI with random encoding, Medical Imaging, IEEE Transactions, pp. 893-903, 2011.
[7] Cai, X, Giannakis GB, Identifying differentially expressed genes in microarray experiments with model-based variance estimation, Signal Processing, IEEE Transactions, pp. 2418-2426, 2006.
[8] Barman S, Roy M, Prediction of cancer cell using digital signal processing, Annals of Faculty Engineering Hunedoara, Int. J. Eng, pp. 91-95, 2011.
[9] Inbamalar T, Sivakumar R, Study of DNA sequence analysis using DSP Techniques, Journal of Automation and Control Engineering, 2013.
[10] Alberts B, Bray D, Essential cell biology, Garland Science, 2013.
[11] Tsonis AA, Elsner JB, Periodicity in DNA coding sequences: implications in gene evolution, Journal of theoretical biology, pp. 323-331, 1991.
[12] Akhtar M, Ambikairajah E, Detection of period-3 behavior in genomic sequences using singular value decomposition, Emerging Technologies, Proceedings of the IEEE Symposium, 2012.
[13] Mena-Chalco JP, Carrer H, Identification of protein coding regions using the modified Gabor-wavelet transform, Computational Biology and Bioinformatics, IEEE/ACM Transactions, pp. 198-207, 2008.
[14] Mabrouk MS, A Study of the Potential of EIIP Mapping Method in Exon Prediction Using the Frequency Domain Techniques, American Journal of Biomedical Engineering, pp. 17-22, 2012.
[15] Maji S, Garg D, Progress in gene prediction: principles and challenges, Current Bioinformatics, pp. 226-243, 2013. [16] Anastassiou D, Genomic signal processing, Signal
Processing Magazine, IEEE, pp. 8-20, 2001.
[17] Abo-Zahhad M, Ahmed SM, Genomic analysis and classification of exon and intron sequences using DNA numerical mapping techniques, International Journal of Information Technology and Computer Science (IJITCS), 2012.
[18] Bai Arniker S, Kwan HK, Advanced numerical representation of DNA sequences, International Conference on Bioscience, Biochemistry and Bioinformatics IPCBEE, 2012.
[19] Cosic I, Macromolecular bioactivity: is it resonant interaction between macromolecules?-theory and applications, Biomedical Engineering, IEEE Transactions, pp. 1101-1114, 1994.
[20] Lazović J, Selection of amino acid parameters for Fourier transform-based analysis of proteins, Computer applications in the biosciences: CABIOS, pp. 553-562, 1996.
[21] Nair AS, Sreenadhan SP, A coding measure scheme employing electron-ion interaction pseudopotential (EIIP), Bioinformation, 2006.
[22] Ramachandran P, Antoniou A, Identification of hot-spot locations in proteins using digital filters, Selected Topics in Signal Processing, IEEE Journal, pp. 378-389, 2008.
[23] Abo-Zahhad M, Ahmed SM, Integrated Model of DNA Sequence Numerical Representation and Artificial Neural Network for Human Donor and Acceptor Sites Prediction, International Journal of Information Technology and Computer Science (IJITCS), 2014.
[24] Kwan HK, Arniker SB, Numerical representation of DNA sequences, Electro/Information Technology, IEEE International Conference, 2009.
[25] Akhtar M, Epps J, On DNA numerical representations for period-3 based exon prediction, Genomic Signal Processing and Statistics, GENSIPS, IEEE International Workshop, 2007.
[26] Holden T, Subramaniam R, ATCG nucleotide fluctuation of Deinococcusradiodurans radiation genes, Optical Engineering+ Applications, International Society for Optics and Photonics, 2007.
[27] Ranawana R, Palade V, A neural network based multi-classifier system for gene identification in DNA sequences, Neural Computing & Applications, pp. 122-131, 2005.
[28] Yin C, and Yau SS, Numerical representation of DNA sequences based on genetic code context and its applications in periodicity analysis of genomes, Computational Intelligence in Bioinformatics and Computational Biology, CIBCB'08. IEEE Symposium, 2008.
[29] Goldsack D, Chalifoux R, Contribution of the free energy of mixing of hydrophobic side chains to the stability of the tertiary structure of proteins, Journal of theoretical biology, pp. 645-651, 1973.
[30] Voss RF, Evolution of long-range fractal correlations and 1/f noise in DNA base sequences, Phys Rev Lett, pp. 3805-3808, 1992.
[31] Vaidyanathan P, Yoon BJ, Digital filters for gene prediction applications, Signals, Systems and Computers, Conference Record of the Thirty-Sixth Asilomar Conference IEEE, 2002.
[32] Ramachandran P, Lu WS, Location of exons in DNA sequences using digital filters, Circuits and Systems, ISCAS, IEEE International Symposium, 2009.
[33] Rogic S, Mackworth AK, Evaluation of gene-finding programs on mammalian sequences, Genome research, pp. 817-832, 2001.
[34] Burset M, Guigo R, Evaluation of gene structure prediction programs, Genomics, pp. 353-367, 1996.
[35] Saberkari H, Shamsi M, A fast algorithm for exonic regions prediction in DNA sequences, Journal of medical signals and sensors, 2013.
[37] Demeler B, Zhou G, Neural network optimization for E. coli promoter prediction, Nucleic acids research, pp. 1593-1599, 1991.