[Abduljabbar* 5(10): October, 2018] ISSN 2349-4506
Impact Factor: 3.799
G
lobal
J
ournal of
E
ngineering
S
cience and
R
esearch
M
anagement
SIMULATION
AND
OPTIMZING
TRAFFIC
FLOW
AT
SIGNALIZED
INTERSECTION USING MATLAB
Dr Mohammed B. Abduljabbar*, Dr Amal Ali, Ruaa Hameed
*
Assist Prof., Civil Engineering Department, Al-Mustansiriayah University, Baghdad, Iraq
Assist Prof., Civil Engineering Department, Al-Mustansiriayah University, Baghdad, Iraq
M.SC student, Civil Engineering Department, Al-Mustansiriayah University, Baghdad, Iraq
DOI: 10.5281/zenodo.1456823
KEYWORDS
:
Traffic, Signalized Intersection, VISSIM, MATLAB, Simulation.ABSTRACT
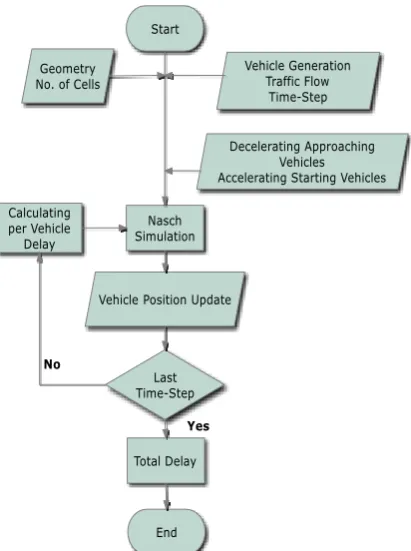
The issue of traffic is a complex one requiring design, planning, engineering and institutional inputs for developing a proper solution. Dealing with traffic at intersection requires, many a times, the study and installation of traffic signals. Signalized intersection locations form the most common bottleneck points in cities across the world. There are many factors that affect the traffic behavior on the signalized intersection; such that number of phases, the arrival rate at the entrance, delay patterns, and the timing diagram.In this research, optimization technique by using cellular autmata technique with taking the benefit of the abilities of MATLAB software. The traffic simulation models have been generally used to study traffic operations and systems impacts cause simulation is safer, less expensive and faster than field implementation and testing. Their use has also increased dramatically in recent years due to their flexibility and ability to visualize simulations. To achieve out the above objective, traffic data is collected at the network in CBD area (AL Mansur) in Baghdad city. Video recording is used to collect field data for three intersections because it provides permanent record of data with minimum manpower. These data are abstracted from video records, and processed by prepared EXCEL sheet. VISSIM simulation software V 5.0 is used to analyze the delay of these intersections by reducing the cycle length and getting less delay A traffic Simulation program that use Nasch model was prepared and processed, the outputs of this model are very close to the output of the VISSIM, which means that the prepared program could be reliable.
INTRODUCTION
The behavior of traffic had a great deal of studies. The importance of these studies is to make the traffic behavior applicable with the solutions of mathematics and consequently could be programmable with various softwares.
The need of converting traffic behavior into software is an essential matter that helps in solving sophisticate problems in a few seconds run. There are several programs that could be used in dealing with traffic operations. Herein VISSIM software were used earlier in this study, and in this chapter the capability of MATLAB program was used to simulate the traffic operations into a model.
Traffic simulation is a process of predicting a model that may considered as effective tool to represents the real world situation, and then using this model to follow up the behavior of traffic operations in the transportation network. The advantage of Traffic simulation is the performance of the traffic could be estimated according to the available previous data, but it may require a high programming skills and capability or using an expensive software packages.
This research aims to solve the simulation of the traffic behavior at the signalized intersections by adapting another technique, the new technique contains the use the benefit of CTM .the results of the traffic microscopic modeling packages was compared with the results of the MATLAB software microscopic modal. The above process was used to propose the best timing stream that makes the less delays.
Preavious Studies
[Abduljabbar* 5(10): October, 2018] ISSN 2349-4506
Impact Factor: 3.799
G
lobal
J
ournal of
E
ngineering
S
cience and
R
esearch
M
anagement
unidirectional flow. Extensive Monte Carlo simulations are carried out to establish the model characteristics. They emphasized that the studied model suffers from non-realistic behaviour of car movement in some situations.Lijun investigated the lane-changing and dwelling behaviors in a two-lane mixed traffic and conducted the simulation using the cellular automaton model under open boundary condition. He proposed that during rush hours, the queuing upstream the intersection could be stretch to the bus stop and then disturb the normal dwelling operation of buses. Therefore, it is necessary to reasonably design the position of signalized intersection and the corresponding cycle time.
Microscopic traffic flow models
Microscopic traffic flow simulation is representing the vehicle units in the traffic, based on the behavior of the driver. The variables that represent the microscopic properties of dynamic of the models are vehicle’s position and velocity. There may be two models which represent the dynamic models, the Car-following model, and the Cellular automata model. The Nasch model was adapted to represent the microscopic model
Cellular Automat model
Cellular automata model is widely used as microscopic traffic model. In this model, a roadway is divided into cells. The vehicles movement may represent by moving from on cell to another. The traffic flow is occurred when vehicle moves from one cell each time step. The velocity v will added by 1 if the next cell is empty and will be slowing down byi−1 if the next cell is not empty and occupied by another vehicle. In Cellular automata model, the divided street by cells is at a certain length of each cell, which represents the vehicles length and the distance to the next vehicle, in a dense density situation.. Each cell may be occupied by a vehicle or empty. There exist a and the velocity of each car can take the value between𝑣=0,1,2,…,umax, which umax is the maximum speed.
Figure:
[Abduljabbar* 5(10): October, 2018] ISSN 2349-4506
Impact Factor: 3.799
G
lobal
J
ournal of
E
ngineering
S
cience and
R
esearch
M
anagement
The Requirements of using Traffic simulation according to AASHTO Guidelines for Traffic Data Programs Data collection
Programming language
To conduct data collection several prepares are to be made. The check list of the step of Data collection requires the following:
The concepts of the operation are to be understood.
Team work is to be established with distributed responsibilities. A well benefit tools should be occupied.
The study area should be defined.
A plan for the collected data should be ready. The data collection cost should be estimated.
An overall work schedule with proper data sheet should be over handed.
Transportation network representation
The Transportation network may include the routes, junction, and any other transportation facility and their location that consists the transportation system in the area. The usually, the transportation network may represents the most important system of the microscopic simulation, it requires a detailed geometry and movements, also some researches need to make the geometry of Transportation network applied with other software packages such as GIS softwares.
Transportation network may include the following Nodes
Links Vehicle types
The scenario of movement
For the purpose of traffic modelling at the intersection the following algorithms may be used
Traffic flow modeling
In the current situation of local street network of the case study, signalized intersection suffers from traffic delays and low level of services. To make detailed studies that include the current situations and the proposed developments, there is a need to model the traffic behavior and study it virtually.
The proposed model should represent the actual operations in the study area, the included parameters of the model should reflect the characteristics of transportation network operations, and the output of the model and the real world should be converged.
In the study case, the length of the approach lanes to the signalized intersection may divided into smaller sections, which may called cells, also the time of the operations may divided into small periods of time, which called time steps, then as we have distance and time segments, the speed could be calculated. Some constraints need to be added, the speed should not exceed the speed limit, first there is acceleration to the desired speed and then deceleration when the desired speed reached, also the driver have to react according to front vehicle situation.
Model Building
[Abduljabbar* 5(10): October, 2018] ISSN 2349-4506
Impact Factor: 3.799
G
lobal
J
ournal of
E
ngineering
S
cience and
R
esearch
M
anagement
TheNasch Model may consist of 4 steps [Nagel und Schreckenberg,1992] as follows: Acceleration: when the speed is not the maximum speed, it could be accelerated by +1 unit
Deceleration: the velocity may be reduced or slowing down to avoid collision with the front vehicle. Fluctuation: a probability may be entered to study the randomization of vehicles in the streets especially
urban arterials which may subject to random behavior. In the case of this work, the behavior of vehicles at the intersection according to sequent of signal lights may be known for great extent and the probability effects may eliminated.
Vehicle progressing: the vehicle movement ahead after the above 3 steps at each time step.
The Nasch Model is an easy and fast method of simulation, it is designed first for one dimensional movement, also every cell in the street section may represent a tiny section with full boundary conditions. Since all the major parameters (time, space, and movement) of this model is discrete and not continuous, the a discrete mathematical function could represent the movement of vehicle from one cell to another cell. herein this model may be very applicable with signalized intersections.
Simulating signal controlled junction
Vehicles tend to move according to the available gaps that lie in front of them according to the following: Slowing down (speed is reduced) if the front traffic is close.
Stopping (speed is zero) if the front traffic is stopped.
When the red light is acting, then the first vehicle is stopped at the stop line of the junction and it may be considered the first headway between the intersection and the lagging vehicles.The number of empty cells between two adjacent vehicles represent the length of the headway between leading and lagging vehicle at time t.
Deterministic model
In the case of signalized intersection, at the beginning of the red light the vehicles are to be packed up at the entrance of the intersection confirming a queue of vehicles. At the beginning of the green light the vehicles move into the intersection slowly until they reach the saturation flow with a starting delay and ending delay.
The saturation flow could be defined as the maximum flow of vehicles that could pass per green time.The advantage of using Matlab is the Matlab language Script is simple to use. Another very important aspect is the huge built-in functions that could be used. With these functions that provided by Matlab a lot of time and efforts could be spared compared with the other programs.Therefore, when a special operations is needed beside a software package like Vissim,it is highly advisable to use the Matlab Script as beside Vissim program.
Simulation of Traditional Cellular Automaton Model
In this work, the model used is a single lane highway based on the Cellular Automata model, because the lane changing maneuvers are very seldom to happened in the congested signalized intersections as observed in the signalized intersection field. The roadway may divide into fixed size cells. Each cell may have one vehicle or have no vehicle. A vehicle, like ith vehicle could be represented in the network by position xi of ith vehicle, and the velocity uiis the velocity of the ith vehicle.
Rules and Algorithm
To conduct the simulation of thenon-lane changing traffic model , parameters are needto be input: the length of the roadway, the length of the cell, numbers of vehicles, and velocity . We set the number of cells equal to the length of the roadway approach. Each cell could be either occupied orempty.
[Abduljabbar* 5(10): October, 2018] ISSN 2349-4506
Impact Factor: 3.799
G
lobal
J
ournal of
E
ngineering
S
cience and
R
esearch
M
anagement
Figure:
Figure (2 ) :Time-Space diagram of the 1st intersection in the range of effective green.
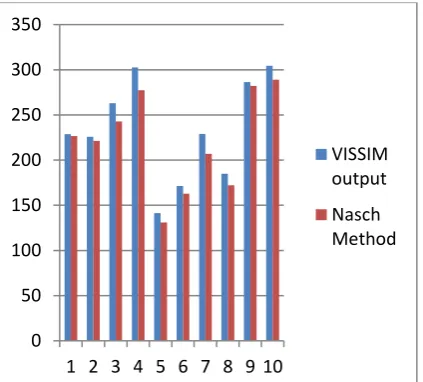
A comparison is made between two different methods of calculating the stopped delay, the first method is the output of the VISSIM software using the conditions explained earlier in chapter 4, the second method is the output of Nasch Method programmed using MATLAB software for each approach of the case study intersections. The results are shown in Table (1).
Figure (3) shows the comparison for each individual approach that explained in Table (1)the data used herein is that before the improvement.
Tables
Table (1): The results of the VISSIM software and the results of the Nasch Method for each approach of the case study intersections
Stop delay(veh/hr) Nasch Method Stop delay(veh/hr)
VISSIM output name of
approaches Approach
Number Name of
intersection
226.5017 228.75
North 1
14 ramadan intersection
221.1752 225.82
South 2
242.7641 262.98
East 3
277.3125 302.7
West 4
131.0363 141.4
North 5
AL Mansur intersection
162.8661 171.21
South 6
206.947 229.09
East 7
172.0897 184.77
North 8
Al yarmouk intersection
282.086 286.27
East 9
289.0013 304.38
[Abduljabbar* 5(10): October, 2018] ISSN 2349-4506
Impact Factor: 3.799
G
lobal
J
ournal of
E
ngineering
S
cience and
R
esearch
M
anagement
The Chi square value for the comparison of the stopped delay between VISSIM output and Nasch Method is 0.38 which means that with the 2 degree of freedom (space and time) .the chi square value here in was due to the high differences between the squental processes, in the intersection with different cycle time,the traffic maneuver may be varied according to many parameters beside the standard parameters (like the effect of weather, drivers , vehicles and pedestrian).also the different philosophy between the vissim model and the NaSch model results in a slightly different outputs at each run.
Figure (3) :comparison between the output of the VISSIM and the output of Nasch Method programmed using MATLAB software for each approach of the case study intersections
CONCLUSIONS
The main conclusions that can be drawn from this study are summarized, as follows
A proposed CTM model that is called NaSch model was modified to contain the case of the study area situation. the model calculates the total delay at the intersection with several cycle time and the results was compared with previous chapter output .A statistical evaluation was carried out and the model was sufficient .it will be concluded that, the NaSch model could be applied to the local cases of signalized intersections, and the model could be generated to the intersections in the area.
The use of modified NaSch model in this study concluded that the delay at the signalized intersections could be calculated by using a small MATLAB software instead of using a traffic simulation package to an acceptable results
Recommendations for Future Work
Comparative Study of VISSIM and paramics on Signalized Intersection.
Developing the microscopic program to use with lane changing operations like freeways and arterials.
REFERENCES
1. Somayyeh Belbasi and M Ebrahim Foulaadvand “Simulation of traffic flow at a signalized intersection”journal of Statistical Mechanics: Theory and Experimentc @2008 IOP Publishing Ltd and SISSA.
2. TIAN Lijun “Traffic Flow Simulation in a Scenario with Signalized Intersection and Bus Stop” JOURNAL OF TRANSPORTATION SYSTEMS ENGINEERING AND INFORMATION TECHNOLOG Y Volume 12, Issue 5, October 2012
0 50 100 150 200 250 300 350
1 2 3 4 5 6 7 8 9 10
VISSIM output