Optimal control algorithm of fertigation system in greenhouse based on
EC model
Yong Wu
1,
Li Li
2,
Shuaishuai Li
2,
Hongkang Wang
2,
Man Zhang
1,
Hong Sun
1,
Nikolaos Sygrimis
3,
Minzan Li
1*(1. Key Laboratory of Modern Precision Agriculture System Integration Research, Ministry of Education, China Agricultural University, Beijing 100083, China;
2. Key Laboratory of Agricultural Information Acquisition Technology, Ministry of Agriculture and Rural Affairs, China Agricultural University, Beijing 100083, China;
3. Department of Agricultural Engineering, Agricultural University of Athens, Athens, 7511855, Greece)
Abstract: Two new control algorithms based on MSP430 microcontroller unit (MCU) were developed to improve the performance of a fertigation system controlled by the electrical conductivity (EC) value of an irrigation nutrient solution in a greenhouse. The first algorithm is incremental proportional–integral–derivative (PID), and the second one is a two-stage combination algorithm (PID + fuzzy). With an improved multi-line mixing Venturi tube, several sets of experiments were conducted for a fertilizer absorption test under two conditions, namely, various suction lines and different EC target values settings. Under the first condition, with an EC target value of 2.0 mS/cm and opening of various suction pipes, the steady-state times are 186 s, 172 s, 134 s, and 122 s corresponding to the opening of one to four suction pipes, respectively, for PID + fuzzy control. The corresponding values are 220 s, 196 s, 158 s, and 148 s for incremental PID control. Under the second condition, four suction pipes are opened with different target EC values of 1.5 mS/cm, 2.0 mS/cm, and 2.5 mS/cm, and the shortest response time and the minimum overshoot were obtained for PID + fuzzy control when the target EC value is 1.5 mS/cm, which are 96 s and 0.18 mS/cm, respectively. While the corresponding values are 112 s and 0.4 mS/cm, respectively for incremental PID control. The two control strategies can adjust the EC value to the target value for real-time control, but the combination control algorithm can be implemented more rapidly, accurately, and steadily with a small overshoot compared with incremental PID control. The combination algorithm (PID + fuzzy) control strategy also possesses better properties for automatic fertigation control in greenhouses than the incremental PID control strategy, the combination algorithm provides an optimal way of water and fertilizer management for crops in greenhouses which will contribute to water and fertilizer saving.
Keywords: fertigation, control algorithm, incremental PID, fuzzy control, irrigation control, greenhouse
DOI: 10.25165/j.ijabe.20191203.4680
Citation: Wu Y, Li L, Li S S, Wang H K, Zhang M, Sun H, et al. Optimal control algorithm of fertigation system in greenhouse based on EC model. Int J Agric & Biol Eng, 2019; 12(3): 118–125.
1 Introduction
Excessive irrigation and fertilization applied in the conventional soil cultivation will cause wasting of water and nutrient accumulation in the soil of the crops root zone and finally lead to the groundwater pollution[1-3]. The establishment of greenhouses (or facility agriculture) is an important direction of modern agriculture in the Internet of Things (IoT) era. And the closed cultivation system of greenhouses as an advanced technology in facility agriculture can save approximately 17.2% of
Received date: 2018-09-27 Accepted date: 2019-04-14
Biographies: Yong Wu, PhD candidate, Research interests: Agricultural
informatization, Email: [email protected]; Li Li, PhD, Associate Professor, Research interests: Smart agriculture system, Email: [email protected]; Shuaishuai Li, MS, Research interests: Agricultural informatization, Email: [email protected]; HongkangWang, MS candidate, Research interests: Agricultural informatization, Email: [email protected]; ManZhang, PhD, Professor, Research interests: Precision agriculture, Email: [email protected]; Hong Sun, PhD, Associate Professor, Research interests: Agricultural informatization, Email: [email protected]; Nikolaos Sygrimis, PhD, Professor, Research interests: automation systems, precision agriculture, web intelligence, smart IOT, Email: [email protected].
*Corresponding author: Minzan Li, PhD, Professor, Research interests:
Precision agriculture, China Agricultural University, Beijing 100083, China. Tel: +86-10-62737924, Email: [email protected].
Numerous researchers have studied the nutrition regulation model. Samsuri et al.[15] studied a control strategy for a drip nutrient solution on the basis of injection time by establishing the relationship between the desired EC value of the nutrient solution and the desired time of fertilizer injection. The measured EC value was close to the desired EC value. Liang et al.[16] designed a fuzzy proportional–integral–derivative (PID) control algorithm for a fertigation system and established a mathematical model of a variable-rate fertilization control system according to mechanical dynamics and electrical principles. They also obtained the simulation curve of system performance by tuning the PID parameters and discovered that the system based on fuzzy PID possessed high steady-state precision, fast dynamic response, small overshoot, and strong anti-interface capability. Steidle Neto et al.[9] developed an automatic control system based on the Penman–Monteith model and leachate concentration. The developed system was efficient in controlling the prepared nutrient solution concentration, and only 44.42 L of the nutrient solution was necessary to produce 1 kg of tomato fruits. Niu and Zhang[17] designed a self-adaptive fertigation control strategy based on artificial neural network–PID, with which the EC value could achieve steady state at the expected value. Yuan[4] designed an incremental PID fertigation control algorithm with the improved Smith predictor, but the algorithm was still in the simulation stage.
All of these studies have shown that although many fertigation methods for supplying crops with nutrient solutions have been investigated, the accuracy, time delay, and stability of the fertigation control system still require further research. This study aims to achieve the desired EC value of a nutrient solution accurately, rapidly and steadily. An automatic fertigation control system will be developed, and an EC sensor will be designed. Two control algorithms, namely, incremental PID algorithm and combination algorithm (PID + fuzzy), based on MSP430G2553 microcontroller unit (MCU) will be used in this study. And then the performance of the two algorithms in the fertigation system will be evaluated to determine the ideal control strategy. Several sets of Greenhouse experiments will be also conducted under two conditions to validate the performance of the control strategies.
2 Materials and methods
Unlike previous studies that used traditional Venturi tubes with
only one suction channel, this study utilized a redesigned Venturi tube for the fertigation system. The redesigned Venturi tube has multiple suction channels, can suck large amounts of fertilizers at once, saves space, and can be easily controlled[18]. An EC sensor
based on frequency measurement was also designed to measure the EC value of the nutrient solution, and then a fertigation control system was built for nutrient solution regulation.
2.1 Control strategy
Previous studies have revealed that PID controllers have been widely used for automatic control due to their effective mathematical modelling for systems. PID controllers can improve transient and steady-state responses, but most of them still exhibit overshoot and time delay. The incremental PID controller is an improved version and effective for initialization[19,20]. Since the proposal of fuzzy inference techniques by Mamdani and Assilian[21] and Sugeno[22], fuzzy controllers that reflect the experience of human experts have also been widely studied for the water and fertilizer management[23-25]. These controllers can be applied to the systems that are difficult to model by mathematical equations[26,27]. On the other hand, a combination control algorithm, which applies PID logic when the error (e) value between the measured and target EC values is large and then applies fuzzy logic when e is small, has rarely been reported, especially for the fertigation nutrient solution regulation. Therefore, we proposed a combination algorithm (PID + fuzzy), based on MSP430G2553 MCU in this study for the fertigation control system, and have it compared to the incremental PID algorithm. Both algorithms were implemented via an analysis of the EC value during the mixing process to determine which of the two was better in controlling the fertigation system.
2.2 EC sensor
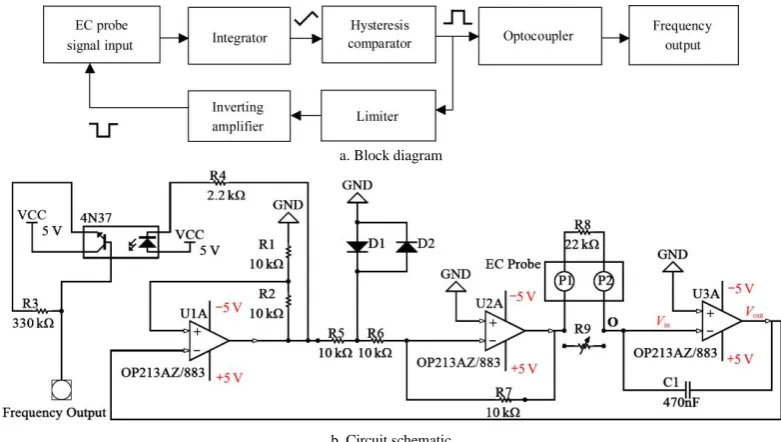
The EC value of the nutrient solution, similar to that of any conductive medium, has a significant positive correlation with nutrient concentration[28,29]. The nutrient solution can serve as an equivalent resistance when current passes through it. The principle of EC measurement is shown in Figure 1. The equivalent resistances measured by the EC sensor changed with the EC value of the nutrient solution, leading to various square-wave output frequencies of the circuit. The EC value of the nutrient solution was determined by measuring the square-wave output frequencies of the circuit.
a. Block diagram
b. Circuit schematic
In Figure 1b, the three operational amplifiers from left to right are hysteresis comparator U1A, inverting amplifier U2A, and integrating circuit U3A. Two probes of the EC sensor, namely, P1 and P2, were two carbon electrodes made from Shanghai Moyang Electric Carbon Corporation Limited. When the probes are plugged into the irrigation nutrient solutions, there will be an equivalent resistance (R) between P1 and P2. And R9 is the equivalent resistance of two parallel resistors, namely R8 and R. The relationship between upper threshold voltage UH and lower
threshold voltage UL of U1A and that between output voltage Vout
and input voltage Vin of U3A are as follows:
1
H OM L
1 2
R
U U U
R R
(1)
1
out in
9 1
R
V V dt
R C
(2)where, R9C1 is the time constant, and only two output values of
U1A, namely, +UOM and −UOM, are available. If R0 is the
equivalent resistance when the EC sensor is placed inside the irrigation nutrient solution, then the output waveform of U3A will be a triangular wave. The slope will be negative if the O point reaches a high level, which would be the input wave of U1A and marked as Ui1. When Ui1 decreased to UL, the output voltage of
U1A changed from –UOM to +UOM. After the level went through
U2A, the level of the O point changed from high to low. The situation was exactly the opposite when the O point decreased to a low level. Thus, a square wave was generated, which indicated that P1 and P2 had an AC power supply. The polarization of the two carbon electrodes could then be avoided. The square-wave output frequency of U1A was measured via the digital input of the MCU after isolation by a 4N37 optocoupler.
2.3 EC modeling
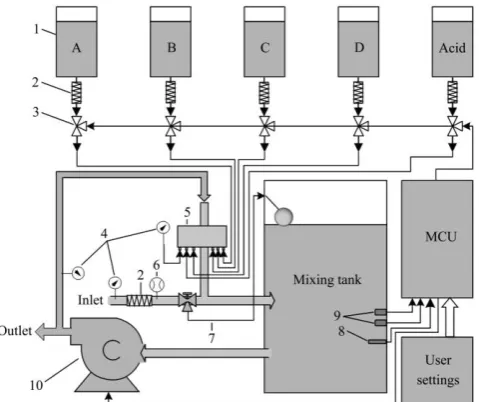
On the basis of the studies of Yuan et al.[4] and Niu et al.[17], the nutrient solution mixing model was regarded as a first-order lag model to simplify the system model according to real fertilizer mixing conditions. The EC model of the nutrient solution regulation was obtained based on the fertigation system developed in this study (Figure 4). If the nutrient solution volume (VT)
inside the mixing tank remained steady when the fertigation equipment was in a working state, then the EC value of the nutrient solution inside the mixing tank would be similar to the EC value of the outlet irrigation nutrient solution. According to the principle of mass conservation, the following equation can be used to show the relationship between the outlet nutrient solution and the inlet water and fertilizers.
5
T out 1 W I 0 O out
( ( )) [ i i( ) ( )]
i
d V C t
C Q m t Q C Q C t dt (3) where, Cout(t) is the concentration of the nutrient solution inside themixing tank and outlet pipe, C0is the concentrationof the nutrient
solution inside the inlet fresh water, and Ci(i = 1, 2, 3, 4, 5)is the
concentration of the stock solution inside dosage tank i. QI and
QO are the inlet water flow and outlet nutrient solution flow,
respectively, which are constant due to the constant power pump.
mi(t)QW(i = 1, 2, 3, 4, 5) is the suction flow of the five input lines
from the five dosage tanks connected to the Venturi tube. This flow is implemented by controlling the duty cycle of the solenoid valve control cycle. Therefore, it is a function of the duty cycle.
QWis a constant and the suction flow of the Venturi tube when the
duty cycle is 100%, which means the solenoid valve is always open. Equation (3) was transformed to the following equation because the concentration of the nutrient solution was proportional to the EC
value of the nutrient solution.
5
T out 1 W I 0 O out
( ( )) [ i i( ) ( )]
i
d V E t
E Q m t Q E Q E t dt (4) where, Eout(t) is the EC value of the nutrient solution inside themixing tank and outlet pipe, E0is the EC value of the inlet fresh
water, and Ei (i = 1, 2, 3, 4, 5)is the EC value of the five types of
nutrient solution from the dosage tank.
During the mixing process, VT=100L, E0=0. If the five EC
values and five duty cycles of the five suction lines are the same, then Equation (4) can be transformed to
T out
W O out
( ( ))
5 i ( ) ( )
d V E t
E Q m t Q E t
dt (5)
Through Laplace transform, Equation (5) can be rewritten as
W out
T O
5
( ) E Qi ( )
E t m s
V s Q
(6)
The response characteristics showed that the fertigation system was a first-order linear system. In an actual experiment, according to the measured data (Ei = 20 mS/cm, QW= 0.02 L/s,
output pressure = 0.15 MPa, and QO= 7.47 L/s), the EC transfer
function can be written as
10 10
2 0.27
( )
100 7.47 13.39 1
s s
H s e e
s s
(7)
2.4 Incremental PID algorithm
The PID control strategy is widely used in the field of control due to its numerous advantages, such as fast response, stable regulation, and easy implementation. As D part of PID control is very sensitive to noise and a very short sampling time, resulting in a severe fluctuation which may cause the overshooting, PID control was cut in this study to PI control to reduce EC overshooting, which might be harmful to crops, due to the lag time of the control system and the crop sensitiveness to the EC value of the irrigation nutrient solution.
An incremental PID algorithm was used, and the output of the PID system was the difference between the former and latter outputs of the positional PID. Unlike positional PID that requires calculation of all errors from the beginning to the present, incremental PID[30] only requires calculation of the current and two previous errors, and the output can be written as
1 P 1 p 1 p 1
k k k k k k k k
i i
T T
u u u K e e e K e K e
T T (8) where, Kp is the proportional gain; T is the sampling time; Ti is the
integration time; ek is the current error (e) value between the
measured and target EC values, and ek−1 is the previous e.
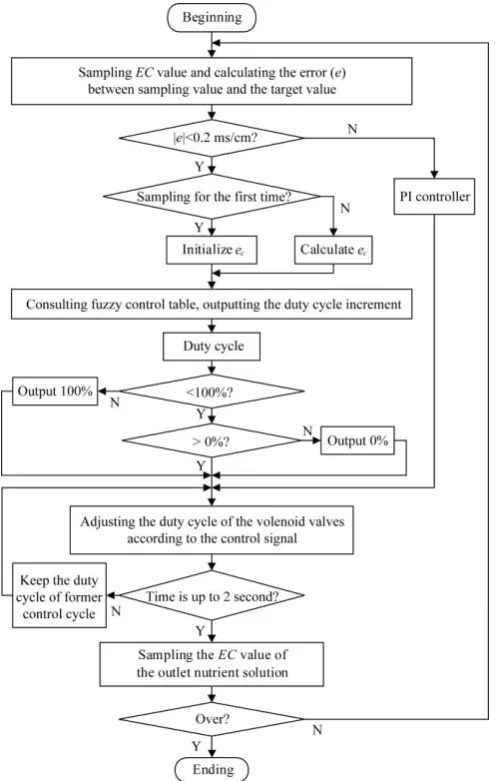
MSP430G2553 MCU was used as the core controller of the PID algorithm, with which the suction flows were controlled by controlling the on–off state of the solenoid valves of each suction line to regulate the EC value of the irrigation nutrient solution. The system control flowchart is shown in Figure 2.
R2017, The MathWorks, Nattick, MA, USA), the proportional and integral coefficients were set to Kp = 20 and Ti= 2, respectively.
Figure 2 Flowchart of the incremental PID control system
2.5 Two-stage combination algorithm
A two-stage control strategy was developed. In the first stage, the PI controller was initialized when the error (e) between the measured EC and target EC values was large, which can rapidly control the duty cycle. In the second stage, the fuzzy controller was initialized when e became smaller than the threshold value eM
(±0.2 mS/cm) to avoid overshooting and rapidly adjust the EC value to the target value. In this study, the threshold value was set to 0.2 mS/cm for the first time based on our experience in other studies.
Figure 3 Flowchart of the two-stage combination algorithm control system
For fuzzy stage control, when e was sufficiently small to meet the condition of (|e|<eM), the PWM driving circuit was connected to
the fuzzy controller with inputs of error (e) and error rate (ec) and
output of solenoid valve duty cycle (u). According to actual conditions and simulation with MATLAB software, the range of e
was set from −0.2 mS/cm to +0.2 mS/cm, and its fuzzy language variable was E, the domain of which was quantified as {−8, −6, −4,
−2, 0, 2, 4, 6, 8}. Its fuzzy set was {NBS, NB, NM, NS, Z, PS, PM, PB, PBS}, and its scaling factor was 40. The range of ecwas
set from −0.3 to + 0.3, its fuzzy language variable was EC, its
domain was quantified as {−6, −4, −2, 0, 2, 4, 6}, its fuzzy set was {NB, NM, NS, Z, PS, PM, PB}, and its scaling factor was 20. The range of output u was [−0.15, +0.15]. Its fuzzy language variable was U, its domain was quantified as {−0.15, −0.125, −0.1,
−0.075, −0.05, −0.025, 0, 0.025, 0.05, 0.075, 0.1, 0.125, 0.15}, and its fuzzy set was {N6, N5, N4, N3, N2, N1, Z, P1, P2, P3, P4, P5, P6}. In this stage, the range of the solenoid valve duty cycle could be controlled to [−15%, +15%] relative to the value to the former duty cycle. For example, if input E was 8 and input EC
was 6, which means that the error and the error rate were the largest, then output U would be −0.15, which means that the fertilizer suction amount would be reduced to 15% of the former suction amount, thereby reducing the latter inputs E and EC as much as possible.
The fertigation control flowchart is shown in Figure 3. The initial value of EC was set to 6, and the control period time was set
to 2 seconds. For appropriate control, if the duty cycle was less than 0, then the duty cycle was 0; if the duty cycle was more than 100%, then it was 100%. Based on expert theory and practical experience, a fuzzy control rule table was designed by using the fuzzy reasoning method, as shown in Table 1. A total of 63 rules were derived. The membership functions of inputs and outputs were triangular, and the centroid method was used for defuzzification.
Table 1 Rule table of fuzzy control
EC
Rate of error change
E
Difference between measured and target values
NBS NB NM NS Z PS PM PB PBS
NB P6 P6 P5 P4 P3 P2 P1 Z Z
NM P6 P4 P3 P2 P1 P1 Z Z Z
NS P4 P3 P2 P1 P1 Z Z N1 N1
Z P3 P2 P1 P1 Z Z N1 N2 N2
PS P2 P1 P1 Z Z N1 N1 N2 N3
PM P1 Z Z Z N1 N2 N2 N4 N6
PB Z Z N1 N1 N2 N4 N5 N6 N6
2.6 Experimental design
controlled by solenoid valves, the four dosage tanks are put together in a platform with the same height, and all the pipes between the dosage tanks and the venturi have a same length, so that we can guarantee a same injection rates for all auction pipes, and the suction flow of each pipe was 3.5 L/min.
The EC values were collected by the IO interface of MSP430G2553 MCU and recorded by a computer connected to the MCU by RS-485. The sampling period was 2 s, and the measured time was 350 s. The results were obtained by opening one, two, three, and four suction pipes, respectively, using the two control algorithms. The target EC values of the four pipes were 1.5 mS/cm, 2.0 mS/cm, and 2.5 mS/cm.
3 Results and discussion
An automatic fertigation system was developed, incremental PID control algorithm was applied firstly as an example of traditional PID algorithms, then a new combined algorithm was proposed based on the analysis of the EC value of the irrigation nutrient solution during the mixing process. Experiments were then conducted under two different conditions to compare the performance of the two control strategies.
1. Dosage tank 2. Filter 3. Solenoid valve 4. Pressure gauge 5. Redesigned mixing Venturi 6. Flow meter 7. Flow valve 8. Low level float switch 9. EC sensor 10. Pump
Figure 4 Structure of the automatic fertigation control system
Figure 5 The developed automatic fertigation system
3.1 Automatic fertigation control system
The developed fertigation control system is shown in Figure 4 and Figure 5. The system comprises a mixing tank, several dosage tanks, a Venturi tube, a fertigation pump, and several
solenoid valves, electronic circuits, and sensors (including EC and pH sensors). The mixing tank, with a capacity of approximately 130 L, was used to store the nutrient solution intended for fertigation. Four 500 L dosage tanks were utilized to store the stock solutions (A, B, C, and D), and a 500 L dosage tank was used to store the acid for pH adjustment of the nutrient solution.
In consideration of crop variety, growth stage, and greenhouse environmental factors, the fertigation control system dynamically adjusted the EC value to the expected value in real time according to the data measured by the EC sensors.
A pump with a head of 32 m, speed of 2,900 r/min, flow rate of 25 m3/h, and power of 4 kW was connected to the mixing tank to pump the irrigation nutrient solution. The irrigation nutrient solution outputted by the pump flowed through two paths, one was for crop fertigation, and the other was through the mixing Venturi for generating negative pressure to suck fertilizers from the dosage tanks and transport these to the mixing tank, then the fertilizer solution goes directly to the inlet water before going to the mixing tank, which will help for the mixing process. The suction lines were controlled by using solenoid valves with a rated voltage of 24 V DC, power of 4 W, frequency of 1/2 Hz, and orifice of 3 mm. Considering the volume of the mixing tank is relatively not big, and the pump we used is close to mixing tank, it will pump water with pressure which can help to mix the fertilizers with water, no stirring equipment for mixing process is need in our mixing tank for current system.
High-level control of the irrigation nutrient solution inside the mixing tank was performed with a float valve connected to a contact sensor to avoid solution overflow during automatic preparation. Low-level control of the irrigation nutrient solution inside the mixing tank was accomplished with a low-level float switch connected to the electronic circuit of MCU to prevent the solution level from decreasing to below the pipe that was connected to the pump.
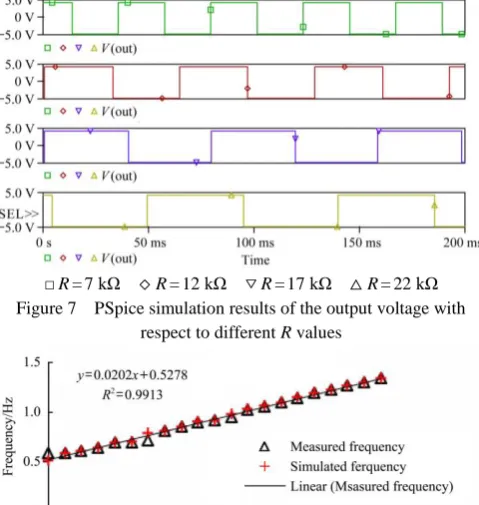
3.2 Software simulation and experimental verification for EC sensor
The EC sensor was designed (Figure 6) and by using the Parametric Sweep function of OrCAD Capture and PSpice software[31], the relationship between the output voltage (V (out)) of the EC sensor and the equivalent resistor of the irrigation nutrient solution (R), as mentioned in section 2.2 and Figure 1, was simulated. Here, V (out) was the voltage of which the output frequency was measured. The simulation time was set to 200 ms. The result showed that the output frequency changed with R
(Figure 7), which meant that the output frequency of the EC sensor changed when the EC value of the irrigation nutrient solution did.
a. PCB part b. EC probe
□R=7 kΩ ◇R=12 kΩ ▽R=17 kΩ △R=22 kΩ Figure 7 PSpice simulation results of the output voltage with
respect to different R values
Figure 8 Relationship amongsimulated frequency, measured frequency and set EC value of the nutrient solution Moreover, an experiment was conducted to verify the mathematical relationship between the simulated frequency, output frequency of the EC sensor and the EC value of the nutrient solutions. The frequencies were measured by using MSP430 G2553 MCU as the EC values of the nutrient solutions were set to different values. A fitted linear equation was obtained between the output frequency and the EC value of the nutrient solution, and the R2 = 0.9993 (Figure 8) which meant that there was a significant linear correlation between the output frequency of the EC sensor and the EC value of the nutrient solution. Thus, the EC value of the nutrient solution can be measured precisely, the accuracy of the EC sensor can reach 0.85% according to the measured EC value and set EC value of the nutrient solution (Figure 9), the set EC value was set by using the DDSJ-308F conductivity meter bought from INESA Scientific Instrument Co., Ltd.
Figure 9 Relationship between measured EC value and set EC value of the nutrient solution.
3.3 Experiment under the first condition using the two algorithms
An experiment was conducted under the first condition, in which various suction pipes were opened with a target EC value of 2 mS/cm. The EC response curves over time when the four suction pipes were opened are shown in Figures 10-13.
According to all four figures, the system could reach the steady state by using both control algorithms. When the combination
control algorithm was used, the steady-state response time was 186 s (Figure 10), 172 s (Figure 11), 134 s (Figure 12), and 122 s (Figure 13) corresponding to the opening of suction pipes 1, 2, 3, and 4, respectively. By contrast, the response time was 220 s (Figure 10), 196 s (Figure11), 158 s (Figure 12), and 148 s (Figure 13) when incremental PID control was used. The response time was shortened when the suction flow was high, and the response time of the combination algorithm control was shorter than that of incremental PID control.
Figure 10 EC response using the two control algorithms when opening one suction pipe
Figure 11 EC response using the two control algorithms when opening two suction pipes
Figure 12 EC response using the two control algorithms when opening three suction pipes
Overshoot phenomena were observed in both control strategies when various suction pipes were opened, but no such phenomena were observed when only one suction pipe was opened using the combination algorithm control strategy. The maximum EC values obtained by opening suction pipes 1, 2, 3, and 4 using the combination algorithm were 2.03 mS/cm (Figure 10), 2.17 mS/cm (Figure 11), 2.3 mS/cm (Figure 12), and 2.4 mS/cm (Figure 13), respectively. Whereas the obtained values were 2.12 mS/cm (Figure 10), 2.27 mS/cm (Figure 11), 2.45 mS/cm (Figure 12), and 2.64 mS/cm (Figure 13), respectively, by using incremental PID control. The overshoot was evidently higher for incremental PID control than for the combination algorithm control.
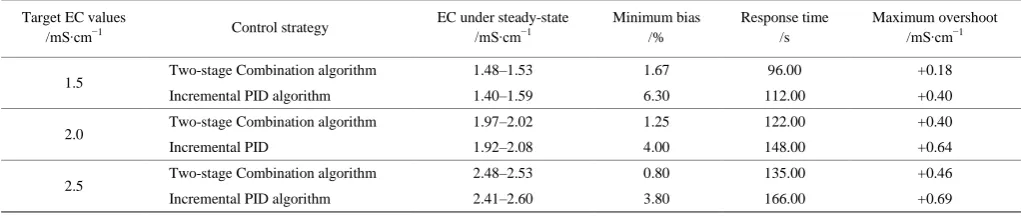
3.4 Experiment under the second condition using the two algorithms
Another experiment was conducted under the second condition, in which four suction pipes were opened with different target EC settings. The EC values under steady state, minimum bias, response time, and maximum overshoot are presented in Table 2, with target EC value settings of 1.5 mS/cm, 2.0 mS/cm, and
2.5 mS/cm, respectively. The results showed that the EC values remained more stable after reaching the steady state when the combination algorithm control was used compared with incremental PID control with the three types of target EC value settings. Using the combination algorithm control resulted in a short response time and low maximum overshoot. The combination algorithm control also showed better performance than incremental PID control. The shortest response time and the minimum overshoot were 96 s and 0.18 mS/cm, respectively, when the target EC value was 1.5 mS/cm.
The results also showed that the response was fast, and the control strategy obtained low overshoot when the target EC value was low.
Most greenhouses in China are located in more than 1 mu (666.67 m2), and the time for irrigation nutrient solutions to move from the fertigation system to the farthest irrigation area is more than 2 min. Therefore, the response time of the combination control algorithm (such as 96 s, 122 s, and 135 s) is suitable for fertigation control in a greenhouse.
Table 2 Comparison of the two control algorithms with different target EC values
Target EC values
/mS∙cm−1 Control strategy
EC under steady-state /mS∙cm−1
Minimum bias /%
Response time /s
Maximum overshoot /mS∙cm−1
1.5 Two-stage Combination algorithm 1.48–1.53 1.67 96.00 +0.18
Incremental PID algorithm 1.40–1.59 6.30 112.00 +0.40
2.0 Two-stage Combination algorithm 1.97–2.02 1.25 122.00 +0.40
Incremental PID 1.92–2.08 4.00 148.00 +0.64
2.5 Two-stage Combination algorithm 2.48–2.53 0.80 135.00 +0.46
Incremental PID algorithm 2.41–2.60 3.80 166.00 +0.69
3.5 Discussion
The fertigation control system developed in this study can automatically regulate the EC values of the irrigation nutrient solutions. With a good control algorithm, it will provide an optimal way of water and fertilizer management to meet the nutritional requirements of crops in greenhouses, thus the automatic fertigation control system can contribute to precise cultivation of crops in greenhouses and save water and fertilizers. The results of the experiments in this study under the two conditions showed that the fertigation system with the combination algorithm can operate rapidly, accurately, and steadily with a small overshoot. Therefore, the fertigation system controlled fertilizer concentration of the irrigation nutrient solution precisely and effectively, which means that the fertigation system can provide a precise quality control of the irrigation and fertilization for greenhouse crops. Fertigating crops in greenhouses based on the two-stage combination algorithm that can provide the nutrient solution that has the most suitable EC value is economical due to the following two reasons.
First, the mixing process of the nutrient solution was simplified to obtain a mathematical model of the fertigation system. The transfer function for incremental PID controller, which might be inaccurate, was then obtained. The mixing process of the nutrient solution is highly complicated, and fuzzy control logic, which can be used for complex nonlinear systems[32], is suitable for the fertigation system.
Second, a two-stage combination control algorithm was proposed and showed better performance than a single one. In the first stage, the fertigation system could rapidly regulate the EC value of the nutrient solution to the desired EC value with the PI controller, and in the second stage, the fuzzy controller could help
the system avoid a large overshoot and maintain stability.
Although the two-stage combination control algorithm was suitable for the fertigation system, overshooting still existed, it might be because the threshold value (+0.2 mS/cm) for e was set too low, or the accuracy of fuzzy logic was insufficiently high. Moreover, only EC control of the irrigation nutrient solution was studied, however, the pH value of the nutrient solution is also a key parameter of the nutrient solution[33] which was under control in this study but not presented in this paper. Thus, we will continue to carry out some experiments for the threshold value adjusting to achieve a better performance in future study, also the pH value regulation of the irrigation nutrient solution will be the topic of our next paper.
4 Conclusions
Two control strategies for automatic fertigation control, namely, incremental PID control and combination control algorithm, were analyzed. Both could effectively adjust the EC value of the nutrient solution to the target EC value.
harmful to crops.
For the combination control algorithm, when the target EC values were set to 1.5 mS/cm, 2.0 mS/cm, and 2.5 mS/cm with four opened suction pipes, the minimum bias data were 1.67%, 1.25%, and 0.80%, respectively. The bias decreased when the target EC was set to a large value.
The present study showed that the combination control strategy had better properties than the incremental PID control strategy for automatic fertigation management, and it will provide a scientific basis for precise irrigation and fertilization control for crops in greenhouses. While due to the limitation of the study, the quantitative estimation is not carried out to verify that the developed control algorithm could significant decrease the water and fertilizer usage, we do have our fertigation system using in several greenhouses, we will continue to do more greenhouse experiments to verify it.
Acknowledgements
This work was supported by Yunnan Academician Expert Workstation (Li Minzan, Grant No. 20170907), the National Key
Research and Development Program (Grant No.
2016YED0201000- 2016YED0201003), and the Key Laboratory Project (2019TC124).
[References]
[1] Ramos C, Agut A, Lidón A L. Nitrate leaching in important crops of the Valencian Community region (Spain). Environ Pollut., 2002; 118(2): 215–223.
[2] Yuan C, Feng S, Wang J, Huo Z, Ji Q. Effects of irrigation water salinity on soil salt content distribution, soil physical properties and water use efficiency of maize for seed production in arid Northwest China. Int J Agric & Biol Eng, 2018; 11(3): 137–45.
[3] Li J, Chen P, Sun X, Liu P. Effects of fertigation strategies on water and nitrogen distribution under water storage pit irrigation for orchards. Int J Agric & Biol Eng, 2018; 11(1): 165–171.
[4] Yuan H. Study on key technologies for closed cultivation systems in solar greenhouses. Beijing: China Agricultural University, 2015. [5] Sonneveld C, Voogt W. Plant nutrition of greenhouse crops. New York:
Springer Dordrecht Heidelberg; 2009; 432p.
[6] Fan Z, Lin S, Zhang X, Jiang Z, Yang K, Jian D, et al. Conventional flooding irrigation causes an overuse of nitrogen fertilizer and low nitrogen use efficiency in intensively used solar greenhouse vegetable production. Agric Water Manag., 2014; 144: 11–19.
[7] Bo Z, Jian-bin Z. Effects of different fertilizers and water managements on water distribution in soil and water use efficiency of tomato. J of Nor thw est A &F Univ, 2009; 37(1): 211–216.
[8] Rodríguez D, Reca J, Martínez J, Lao M T, Urrestarazu M. Effect of controlling the leaching fraction on the fertigation and production of a tomato crop under soilless culture. Sci Hortic (Amsterdam), 2014; 179: 153–157.
[9] Steidle Neto A J, Zolnier S, de Carvalho Lopes D. Development and evaluation of an automated system for fertigation control in soilless tomato production. Comput Electron Agric., 2014; 103: 17–25.
[10] Jeon E, Choi S, Yeo K H, Park K S, Rathod M L, Lee J. Development of electrical conductivity measurement technology for key plant physiological information using microneedle sensor. J Micromechanics Microengineering, 2017; 27(8): 085009.
[11] Moon T, Ahn T I, Son J E. Forecasting root-zone electrical conductivity of nutrient solutions in closed-loop soilless cultures via a recurrent neural network using environmental and cultivation information. Front Plant Sci,
2018; 9(6): 859.
[12] Cliff M A, Li J B, Toivonen P M A, Ehret D L. Effects of nutrient solution electrical conductivity on the compositional and sensory characteristics of greenhouse tomato fruit. Postharvest Biol Technol., 2012; 74: 132–140.
[13] Salih J E M, Adom A H, Shaakaf A Y M. Solar powered automated fertigation control system for cucumis melo l. cultivation in green house. APCBEE Procedia, 2012; 4: 79–87.
[14] Li J N, Hong T S, Feng R J, Ni H N. Design and experiment of automatic mixing apparatus for liquid fertilizer based on fuzzy control. Transactions of the CSAE, 2013; 29(16): 22–30. (in Chinese)
[15] Samsuri S F M, Ahmad R, Hussein M. Development of nutrient solution mixing process on time-based drip fertigation system. AMS2010 Asia Model Symp 2010 - 4th Int Conf Math Model Comput Simul., 2010; pp.615–619.
[16] Liang C, Wang X, Zhang C, Wang F. Research of variable rate fertilization control system based on fuzzy PID control strategy. 2010 IEEE Int Conf Inf Autom., 2010; 3: 2106–2110.
[17] Niu Y, Zhang K. Development of Fertigation Control System Based on Embedded Platform and Self-adaptive Control Strategy. 2nd Int Conf Electr Comput Eng Electron, 2015;(Icecee):1594–600.
[18] Mu Y H, Li L, Meng F J, Wang J H, Sigrimis N. Structure design and performance test of combined fertilizer absorption device. Transactions of the CSAM, 2016; 47(Supp.): 280–284. (in Chinese)
[19] Shen L, Liu Z, Zhang Z, Shi X. Frame-level bit allocation based on incremental PID algorithm and frame complexity estimation. J Vis Commun Image Represent, 2009; 20(1): 28–34.
[20] Fahmy A A, Abdel Ghany A M. Adaptive functional-based neuro-fuzzy PID incremental controller structure. Neural Comput Appl., 2015; 26(6): 1423–1438.
[21] Mamdani EH, Assilian S. An experimental in linguistic synthesis with a fuzzy logic controller. International Journal of Man-Machine Studies, 1975; 7: 1–13.
[22] Sugeno M. An introductory survey of fuzzy control. Inf Sci (Ny), 1985; 36(1-2): 59–83.
[23] Saruwatari N, Yomota A. Forecasting system of irrigation water on paddy field by fuzzy theory. Agric Water Manag., 1995; 28(2): 163–178. [24] El Aoud M M, Franceschi M, Maher M. Self-tuning method of fuzzy system : An application on greenhouse process. Waset, 2007; 25(11): 133–137.
[25] Garofalo P, Campi P, Vonella A V, Mastrorilli M. Application of multi-metric analysis for the evaluation of energy performance and energy use efficiency of sweet sorghum in the bioethanol supply-chain: A fuzzy-based expert system approach. Appl Energy, 2018; 220(2): 313–324.
[26] Chao C-T, Sutarna N, Chiou J-S, Wang C-J. Equivalence between fuzzy PID controllers and conventional PID controllers. Appl Sci, 2017; 7(6): 513.
[27] Tian G, Zhou J, Gu B. Slipping detection and control in gripping fruits and vegetables for agricultural robot. Int J Agric & Biol Eng, 2018; 11(4): 45–51.
[28] Assawarachan R. Estimation model for electrical conductivity of red grape juice. Int J Agric & Biol Eng, 2010; 3(2): 52–57.
[29] Griffin G P, Jurinak J J. Estimation of activity coefficients from the electrical conductivity of natural aquatic systems and soil extracts. Soil Sci, 1973; 116(1): 26–30.
[30] Astrom K. PID controllers: theory, design and tuning. Instrument Society of America, 1995; p.343. http://ci.nii.ac.jp/naid/10013391165/ [31] Fitzpatrick D. Analog design and simulation using OrCAD Capture and
PSpice. Newnes; 2017.
[32] Ganji A, Shekarrizfard M. A simple model of fuzzy irrigation depth control: An application of an intelligent state dropping (ISD) mechanism. Irrig Drain, 2012; 61(5): 596–603.