J. Chem. & Cheml. Sci. Vol.1 (2), 137-149 (2011)
Journal of Chemistry and Chemical Sciences, Vol.1, Issue 2, 31 January, 2011 (93-149)
Geochemical Characterization of Soils and Groundwater
Occurring within the Shallow Subsurface Zones in
parts of the Interfluves between Burhi Dihing
and Noa Dihing rivers, Assam.
PRANJAL KUMAR DAS1, NILAKSHEE HAZARIKA1, P. K. GOGOI1, U. GOSWAMI2* and J. N. SARMAH2
1
Department of Chemistry, Dibrugarh University, Dibrugarh, Assam-786004
2
Department of Applied Geology, Dibrugarh University, Dibrugarh, Assam-786004. *E-mail: [email protected].
ABSTRACT
The geochemical status of ground water and soil of the part of the terrain between Noa Dihing and Burhi Dihing rivers bounded by longitudes 95°0' E and 96°0' E and latitudes 27°0' N and 28°0' N of Dibrugarh and Tinsukia districts of Assam have been studied and tried to find out any correlation, if any, between them. Samples were collected from seventeen sites in order to assess the geochemical status and the major natural and manmade changes in the region. The physical, chemical, and engineering parameters of soil viz. permeability, bulk density, porosity, pH, conductivity, micronutrient contents, total soluble salts, acid insoluble, etc. were determined, while in case of groundwater chemical analyses were carried out in order to assess the hydrogeochemical quality. To get a preliminary idea of depositional history, geochemical analysis of soil samples of various depths from four locations were carried out.X-ray diffractional studies of the clay samples indicated that clay samples are mainly kaolinite mixed with halloysite and impurities like quartz and calcite. The results revealed that soil and groundwater geochemistry is influenced mainly by natural processes such as geological background, weathering of prevailing geological formation together with impacts deriving from the extended cultivation.
Keywords: Geochemical characterization, shallow subsurface,
groundwater quality, x-ray diffraction, TDS, SAR.
INTRODUCTION
Subsurface is the sustainer of all types of lives, as ecology, agriculture and everything depend on the condition of
138 Pranjal Kumar Das et al., J. Chem. & Cheml. Sci. Vol.1 (2), 137-149 (2011)
Journal of Chemistry and Chemical Sciences, Vol.1, Issue 2, 31 January, 2011 (93-149) groundwater is necessary for any future
developmental project. Clay mineralogical information of soil is essential for better management practices for the soil and for understanding of their geological and engineering properties, which are dependent on their geochemical and physico-chemical parameters.
Increasing human population, its greed and its urbanization have increased the land use pattern and land use density. Thus, through the centuries, the nature of the surface and subsurface soil are going on changing due to the anthropogenic causes. Similarly the limited water resources have been overused/ misused by the ever increasing population of the country.
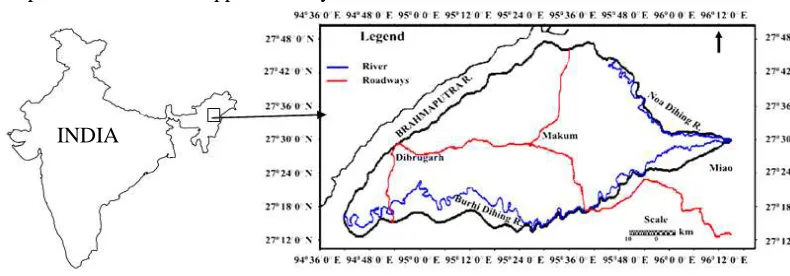
The Brahmaputra valley in Assam comprises an area of approximately 3000
km2 and the present area of investigation being a small part bounded between latitudes 270 0/ N and 280 0/ N and longitudes 950 0/ E and 960 0/ E, extendsfrom the Brahmaputra River in the north to the foothills of Naga-Patkai hills in the south. The eastern boundary is in the apex of the Diyun River and the western boundary is limited to the river Burhi Dihing (Fig. 1). The area is comprised of parts of three river basins: the Noa Dihing, Dibru, and Burhi Dihing. The topmost part of the soil of the area was probably deposited from the great alluvium of the river Diyun. The study of the subsurface soil of this area and geochemical data may be of use in monitoring the changes occurring in the land and also will be helpful in the development project to be undertaken in future.
Fig 1: Location Map of the study area
METHODS
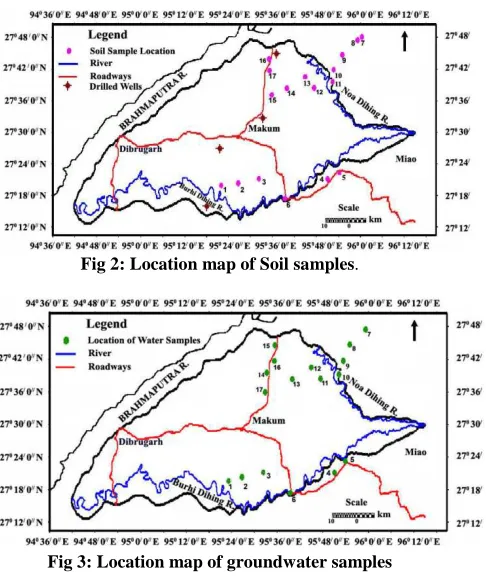
Seventeen samples of soil (Fig. 2) and similar number of samples of groundwater (Fig. 3) were collected during three field visits (Feb-March 2008). Soils were collected from within one metre range from the ground surface and groundwater samples were collected from dug wells. Soil pH (soil : water = 1 : 2.5) was determined pH-metrically using Consort nV pH-meter, Model C830. Electrical
Pranjal Kumar Das et al., J. Chem. & Cheml. Sci. Vol.1 (2), 137-149 (2011) 139
Journal of Chemistry and Chemical Sciences, Vol.1, Issue 2, 31 January, 2011 (93-149) insolubles were determined as per standard
methods1. The amount of calcium and magnesium were determined volumetrically using standard EDTA solution while iron (as sesquioxides) and aluminium (as oxinate) were determined gravimetrically following standard methods2. Sodium and potassium was determined using photoflame flame photometer, dual channels, PEI (Aimil India Ltd.). Of the physico-chemical properties, texture was determined by international pipette method and bulk density, particle density, pore space were determined by methods reported elsewhere 1. Permeability of the soil samples were determined by using constant head (15 cm) permeameter and stop watch 2.
In case of groundwater pH and electrical conductivity (EC) were determined
as in case of the soil samples. Total dissolved solids (TDS) was determined gravimetrically. Various ionic species such as chloride, carbonate, bicarbonate, calcium, magnesium were determined by usual analytical method2. Sodium and Potassium were determined flamephotometrically. From the data obtained, sodium adsorption ratio (SAR) and residual sodium carbonate (RSC) were determined using standard formulae.
XRD studies of randomly selected four clay samples were carried out using a X-Ray diffractogarm model Ultima IV, make Ringaku, Japan, using Cu Kα
Radiation (40kV,40 mA), scan speed 2.0000 deg/min, sampling speed 0.0200 deg., scan range 4.000 to 70.000 deg. at Material Science Division, NEIST, Jorhat, Assam.
Fig 2: Location map of Soil samples.
140 Pranjal Kumar Das et al., J. Chem. & Cheml. Sci. Vol.1 (2), 137-149 (2011)
Journal of Chemistry and Chemical Sciences, Vol.1, Issue 2, 31 January, 2011 (93-149) RESULTS AND DISCUSSIONS
Geochemical Characterization of Soil
Interpretation from permeability data:
The permeability co-efficient of a soil mass is utilized to predict the discharge through it. In general more the clay contents of soil, the lesser is the permeability. The physical parameters and geochemical characteristics of soils of the area are presented in the Table 1 and Table 2 respectively. The hydraulic conductivity of soil refers to the readiness with which it transmits water. This property of soil is of great importance as it affects the drainage rate, trafficability and perhaps infiltration of water.
In the southern part of the terrain as one moves towards river Burhi Dihing finer soils are encountered. The clay contents are more in the soil samples collected from near the Burhi Dihing (around Margherita, 1No. Rongagora, Udaipur etc.). Here the permeability values are low, aquifers are likely to be poorly recharged, indicating reductive condition3.
In the northeastern part of the terrain the relative permeability values are high (Namsai, Nabajyoti, Lajum, Nanam Budha Vihar etc.) near the river Noa Dihing indicating easy recharging of the aquifers, good draining facilities and oxidative condition. This is probably due to sandy patches of the soil occurring near the river Noa Dihing 4. As these areas fall within the upper reaches of the Noa Dihing and other smaller rivers, the relatively high energy conditions of the river regime are probably responsible for carrying the finer particles towards further downstream direction,
leaving the relatively coarser fraction of sediments get deposited in that part of the area.
Soils near Brahmaputra have low permeability value (around Dhola, Horu Dhadum).
Particle density and Bulk density: The
air-liquid-solid volume relationship can be expressed in terms of particle density and bulk density. Air and water spaces vary reciprocally with moisture content of the soil and are indirectly dependent on the texture and structure. In the southern part of the terrain the relatively low bulk density (around Margherita, Jagun, Digboi, Rongagora) and higher pore space value indicate better aeration capacity of the soil, whereas in the north-eastern part most of the soil samples have high values of bulk density and relatively lower values of pore space (around Lajum, Nabajyoti, Namsai, Chowkham-2), hence may have poor aeration capacity.
Pore space and Texture: Most of the soil
near Burhi Dihing (in the southern part, Margherita, Rongagora, Udaipur, Jagun) and near river Brahmaputra (around Dhola, Horu Dhadum) contains higher percentage of clays, having 40%–50% pore space and are mainly characterized by loam or clay-loam textures. In the north-eastern part of the terrain most of the soils show sandy loam textures (around Amguri, Momong, Lathau etc.) having 65%-85% sand with pore space of 30%-40%.
pH: Soils of southern part of the terrain are
Pranjal Kumar Das et al., J. Chem. & Cheml. Sci. Vol.1 (2), 137-149 (2011) 141
Journal of Chemistry and Chemical Sciences, Vol.1, Issue 2, 31 January, 2011 (93-149) content). Other probable reasons of grater
acidity may be human habitation and cultivation. In the northern part, soils are less acidic having pH in the range 4.5 – 6.5 (low organic carbon content) showing probably low presence of humic acid 5.
Electrical conductivity and major cations:
Almost all the soils show variable electrical conductivity and hence concentration of exchangable ions. The amount of major cations varies within their optimum limits and X-ray diffraction studies show multivarient mineral contents.
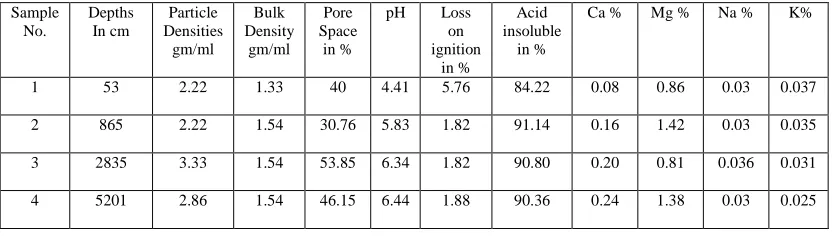
Geochemical Characterization of Soils of Various Depths:
In order to have a preliminary idea about the depositional history of the area, drill hole soil samples of various depths were collected from four drilled hole sites i.e. Dhola, Chota Tingrai, Naharkatia and Doomdooma (Fig 2) and their geochemical characterization are shown in Tables 3, 4, 5
and 6. Of the five soil samples of various
depths at Dhola, it was found that the subsurface soil is acidic and pH increases with depth, indicating acidic nature of the deposits in the flood plains adjacent to river Lohit and Sub-Himalayan foothills. Loss on ignition decrease with depth as well as amount of Fe, Al, Ca, Mg and Na content. The average bulk density and particle density value were ~1.5and ~2.27 g/ml respectively while the pore space values were within the range of 31-45%.The amount of usual cations were found to be minimum from the depth of 2700 cm while relatively higher percentage of cations in the upper layers (660-1440 cm) is probably due
to new deposits. The variation of mineral contents with depth could be an indicator of extent of weathering of the prevailing geological formation.
The samples of Chota Tingrai showed a little wider variation in pH values, more acidic soils were encountered at the depth of 92 cm and 2025 cm with corresponding higher loss on ignition and lower amounts of acid insolubles. At a depth of 5122 cm the particle density and bulk density value were quite high (4.00 and 2.0 g/ml) while pore space were within the range of 28-57%.
The subsurface soils of Naharkatia and Doomdooma were acidic (pH ~4.4 -4.2) which could be due to increase in human population in these two urban centres during last fifty years. However, with the increase in depth the pH increases towards neutral value. In the case of Naharkatia soil, acid insoluble increases with depth and loss on ignition decreases. Like the soils of Chota Tingrai, here too, there was wide variation in the pore space percentage (30.76 -53.85%) with depth.
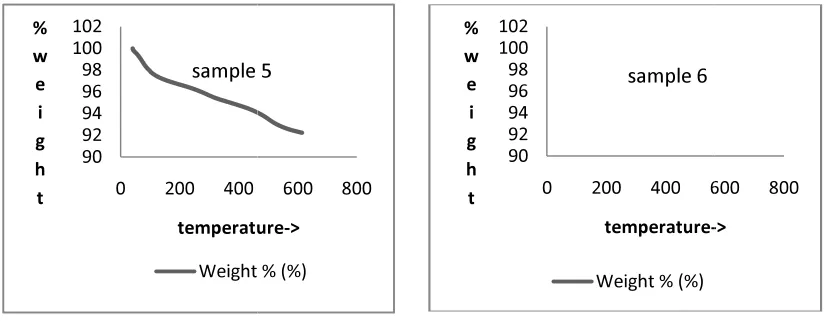
X-Ray Diffraction Studies of Clay Samples:
The X- Ray diffraction studies of four clay samples (1 No Rongagora, Dhola, Horu Dhadum, Margherita) were carried out. From the diffractogram the classification of clay were made according to the scheme recommended by the “Nomenclature of the
clay minerals society”. X-Ray
diffractograms, clay photographs and DTA of some of the soil samples are presented in
142 Pranjal Kumar Das
Journal of Chemistry and Chemical Sciences, Vol.1, Issue 2, 31
(A)
Fig. 5: Clay Photograph of soil samples from Dhola before (A) and after (B) deferration
90 92 94 96 98 100 102
0 200 400
%
w e i g
h t
temperature
Weight % (%)
sample 5
Fig. 4: X-Ray difractogram of clay samples
ranjal Kumar Das et al., J. Chem. & Cheml. Sci. Vol.1 (2), 137-149 (2011
Journal of Chemistry and Chemical Sciences, Vol.1, Issue 2, 31 January, 2011 (93-149
(B)
Fig. 5: Clay Photograph of soil samples from Dhola before (A) and after (B) deferration
600 800
temperature->
Weight % (%)
sample 5
90 92 94 96 98 100 102
0 200 400 600
%
w e i g
h t
temperature-Weight % (%)
sample 6 Ray difractogram of clay samples of Horu Dhadum and Margherita
1)
149) Fig. 5: Clay Photograph of soil samples from Dhola before (A) and after (B) deferration
600 800
->
Pranjal Kumar Das
Journal of Chemistry and Chemical Sciences, Vol.1, Issue
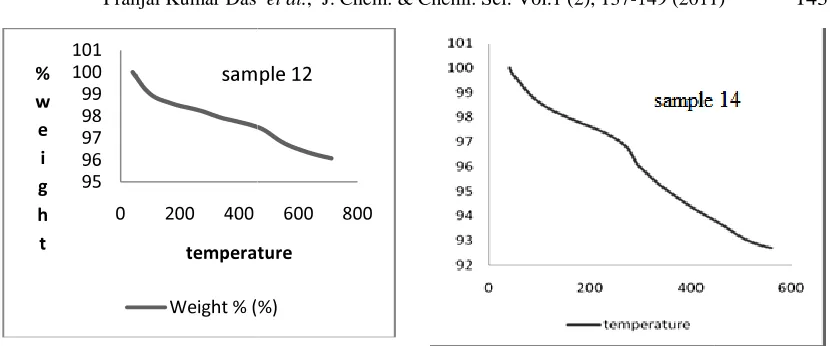
Fig. 6: DTA of some randomly selected soil samples from the area
The clay separated from soil of 1 No. Rongagora, Margherita and Horu Dhadum areas mainly contain Halloysite clay which belongs to Kaolinite group of clay. Soil of Dhola contains Halloysite along with Kaolinite. From the diffractogram studies it was found that soil of 1 No. Rongagora also contains high amounts of calcite and quartz. The presence of feldspar, muscovites were observed. It also contains traces of hematite, siderite, pyrite and goethite.The clay separated from the soil of Margherita is mainly Kaolinite and contains high amounts of quartz and calcite, also contains both feldspar and muscovite. A trace of pyrite is also presents. Similarly the clay obtained from the soil of Horu Dhadum contains high amounts of quartz and calcite along with Kaolinite as the predominant mineral. Muscovite and goethite are also presents. Other trace minerals are siderite and pyrite.
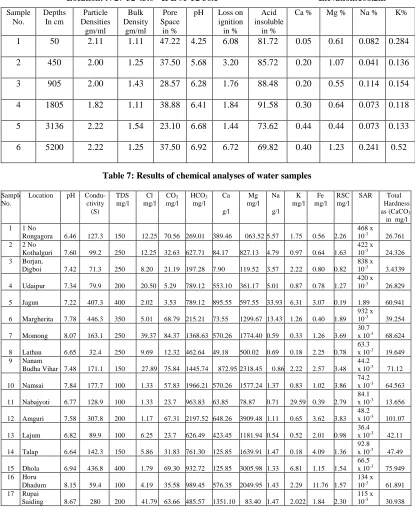
Geochemical Characterization of Water:
Various elements may be present in ground water and their mineral content varies from aquifer to aquifer and from place to place within an aquifer. For this reason it
95 96 97 98 99 100 101
0 200 400
% w e i g h t temperature
Weight % (%)
sample 12
Pranjal Kumar Das et al., J. Chem. & Cheml. Sci. Vol.1 (2), 137-149 (2011
Journal of Chemistry and Chemical Sciences, Vol.1, Issue 2, 31 January, 2011 (93-149 6: DTA of some randomly selected soil samples from the area
The clay separated from soil of 1 No. Rongagora, Margherita and Horu Dhadum areas mainly contain Halloysite clay which belongs to Kaolinite group of a contains Halloysite along with Kaolinite. From the diffractogram studies it was found that soil of 1 No. Rongagora also contains high amounts of calcite and quartz. The presence of feldspar, muscovites were observed. It also contains siderite, pyrite and goethite.The clay separated from the soil of Margherita is mainly Kaolinite and contains high amounts of quartz and calcite, also contains both feldspar and muscovite. A trace of pyrite is also presents. Similarly the m the soil of Horu Dhadum contains high amounts of quartz and calcite along with Kaolinite as the predominant mineral. Muscovite and goethite are also presents. Other trace minerals are siderite
Geochemical Characterization of Water:
lements may be present in ground water and their mineral content varies from aquifer to aquifer and from place to place within an aquifer. For this reason it
would not be practical to discuss them other than in generalization. The chemical analysis data of water samples of the area are presented in Table 7.
The pH is one of the most important attributes of any aquatic system since all the biochemical activities depend on pH of the surrounding medium. It is also established that the pH of the natural water is controlled to a greater extent by interaction of hydroxyl ion arising from the hydrolysis of bicarbonates. The chemical analysis data of the groundwater samples collected from the area of study show that the pH is in the range of 6.46 to 8.67 indicating
nature. The total dissolved solids (TDS) contents ranging between 100 mg/l to 400 mg/l indicate that the groundwater is more or less suitable for drinking purpose.
Regarding suitability of water for irrigation purpose, the evaluation of parameters like electrical conductance (EC), sodium hazards (SH), sodium adsorption ratio (SAR) and residual sodium carbonate (RSC) are essential. Low EC value of the ground water ranging between 38.02
µmho/cm and 446.3 µmho/cm places the
ground water of the area in the “Excellent”
600 800
temperature
Weight % (%)
sample 12
1) 143
149)
would not be practical to discuss them other than in generalization. The chemical analysis water samples of the area are
The pH is one of the most important attributes of any aquatic system since all the biochemical activities depend on pH of the surrounding medium. It is also established is controlled to a greater extent by interaction of hydroxyl ion arising from the hydrolysis of bicarbonates. The chemical analysis data of the groundwater samples collected from the area of study show that the pH is in the range of 6.46 to 8.67 indicating an alkaline nature. The total dissolved solids (TDS) contents ranging between 100 mg/l to 400 mg/l indicate that the groundwater is more or less suitable for drinking purpose.
Regarding suitability of water for irrigation purpose, the evaluation of parameters like electrical conductance (EC), sodium hazards (SH), sodium adsorption ratio (SAR) and residual sodium carbonate (RSC) are essential. Low EC value of the ging between 38.02
µ µmho/cm places the
144 Pranjal Kumar Das
Journal of Chemistry and Chemical Sciences, Vol.1, Issue 2, 31 to “Good” class 6. The Ground water of the
area is characterized by low concentration of sodium, which reduces the sodium hazard. A high concentration of Na in ground water is responsible for deflocculation of clay sized/colloidal particles, which reduce the permeability of the soil. The sodium adsorption ratio (SAR), the relative abundance of Na in relation to other cations in ground water is studied by calculating the SAR value (in meq/l) using the formula
A lower value of SAR is desirable in irrigation water and the SAR value in the present case ranging between 30.7 x 10
Fig 7: Piper Trilinear diagram showing Chemical characte
ranjal Kumar Das et al., J. Chem. & Cheml. Sci. Vol.1 (2), 137-149 (2011
Journal of Chemistry and Chemical Sciences, Vol.1, Issue 2, 31 January, 2011 (93-149 . The Ground water of the
area is characterized by low concentration of sodium, which reduces the sodium hazard. A high concentration of Na in ground water is responsible for deflocculation of clay-sized/colloidal particles, which reduce the
f the soil. The sodium adsorption ratio (SAR), the relative abundance of Na in relation to other cations in ground water is studied by calculating the SAR value (in meq/l) using the formula 6:
A lower value of SAR is desirable in the SAR value in the present case ranging between 30.7 x 10⁻³
meq/l and 1.89 meq/l indicates that ground water of the area are suitable for irrigation.
When the sum of carbonate and bicarbonate is in excess of calcium and magnesium, there occurs a compl precipitation.
RSC (meq/l) = (CO--23 + HCO
-3
Mg+2)
RSC value less than 1.25 meq/l is safe for irrigation, between 1.25 and 2.5 meq/l are of marginal quality, while more than 2.5 meq/l are unsuitable for use in agriculture
one sample (Sl. No.10 – Namsai) is found to unsuitable for higher value of RSC, three samples are of marginal quality while the rest are safe for use in irrigation.
Fig 7: Piper Trilinear diagram showing Chemical character of groundwater of the study area
1)
149)
meq/l and 1.89 meq/l indicates that ground water of the area are suitable for irrigation.
When the sum of carbonate and bicarbonate is in excess of calcium and magnesium, there occurs a complete
3) – (Ca +2
+
RSC value less than 1.25 meq/l is safe for irrigation, between 1.25 and 2.5 meq/l are of marginal quality, while more than 2.5 meq/l are unsuitable for use in agriculture 7, 8. Only Namsai) is found to unsuitable for higher value of RSC, three samples are of marginal quality while the
Pranjal Kumar Das et al., J. Chem. & Cheml. Sci. Vol.1 (2), 137-149 (2011) 145
Journal of Chemistry and Chemical Sciences, Vol.1, Issue 2, 31 January, 2011 (93-149) The graphical representation of the
hydrochemistry of groundwater is evaluated by plotting the cations and anions in percent of total meq/l, in Piper’s Trilinear diagram 9. In the present study, the Piper’s Trilinear diagram (Fig 7) reveals that the water of the area mostly belongs the Ca-Mg-HCO3 facies
while in the two localities viz. around Digboi and Margherita (Sl. Nos. 3 and 6) groundwater belongs to the Na-HCO3 facies.
The plot of the groundwater samples falls in the segments 1, 3 and 4 of the central diamond-shaped field, which suggest that alkaline earth exceeds alkalies and weak acids exceed strong acids respectively. Magnesium and calcium are the major cations while bicarbonate is the major anion in the study area. The plotting of the chemical quality data in the present study shows the dominance of magnesium and calcium bicarbonate. The predominance of Ca, Mg and HCO3 indicate the temporary
hardness, alkalinity and the total hydrochemistry dominated by alkaline earth and weak acids.
Classification of ground water is essential to make an assessment of its suitability for domestic, agricultural or industrial uses. Ground water of the present area of study is classified on the basis of total dissolved solids content as well as on the basis of concentration of Cl-, HCO3
and Total Hardness 10, 11.
Total hardness denotes the concentration of calcium and magnesium in water. Usually expressed as equivalent of CaCO3, it is calculated by the following
formula 6, 7.
TH = 2.497 Ca + 4.115 Mg
The total hardness (as CaCO3) value
of ground water of the area ranges between 3.43 mg/l to 101.07 mg/l and it is observed that the ground water of the area are mostly soft in nature with moderately hard water occurring in two localities around Amguri (S. No. 12) and Dhola (S. No. 15).
Residual Sodium Carbonate
measurements show that maximum water samples are moderately unsuitable (1 No. Rongagora, 2 No Kathalguri, Margherita etc.) for domestic use in the southern part of the terrain, whereas in the north-eastern part of the terrain water samples are also likely to be unsuitable for domestic purpose (Momong, Namam Budha Vihar, Namsai, Amguri etc.). However the chemical compositions of the water samples are suitable for irrigation purpose and are likely to be suitable for industrial usages.
The conductivity measurements shows that some water samples have relatively high values of ionic conductivity which is also reflected by the presence of comparatively large amount of ionic species (Jagun, Margherita, Amguri, Namsai, Nanam Budha Vihar etc.). This is quite possible as these samples are collected from spots near to human habitation and are also high lands not washed out regularly by river water.
Apart from four areas (viz. Jagun,
Amguri, Talap and Haru dhadum)
146 Pranjal Kumar Das et al., J. Chem. & Cheml. Sci. Vol.1 (2), 137-149 (2011)
Journal of Chemistry and Chemical Sciences, Vol.1, Issue 2, 31 January, 2011 (93-149) Table 1: Physical parameters of soil samples
Sample No.
Location Particle
density gm/ml
Bulk density
gm/ml Pore Space
Texture % Water
Permeability ml/hr Clay Silt Sand
1 1 No Rongagora 2.00 1.11 44.44 28.14 30.49 41.33 1.324 2 2 No Kothalguri 1.82 1.11 38.89 18.30 13.51 68.16 3.3 3 Borjan, Digboi 2.00 1.11 55.55 16.59 14.12 69.13 13.59
4 Udaipur 1.66 1.00 40 24.72 38.2 21.45 4.59
5 Jagun 2.00 1.18 41.1 26.86 16.73 51.28 4.49
6 Margherita 2.22 1.11 50 35.75 25.96 38.25 0.71
7 Chowkham 2 2.60 1.63 37.5 2.08 6.65 83.95 6.31
8 Momong 2.17 1.30 40 8.65 10.94 64.69 8.72
9 Lathau 2.35 1.21 48.48 17.64 5.99 67.74 8.51
10 Nanam Budha Vihar 1.82 1.25 31.25 15.29 14.60 58.33 14.46
11 Namsai 2.26 1.45 36.11 15.24 11.29 48.24 7.43
12 Nabajyoti 1.86 1.30 30 4.9 9.3 68.69 4.31
13 Amguri 2.22 1.25 43.75 15.02 9.19 69.28 2.74
14 Lajum 1.82 1.33 26.6 11.83 1.60 84.23 5.22
15 Talap 1.60 1.18 15 24.29 9.9985 62.29 2.61
16 Dhola 2.36 1.11 31.67 24.29 38.48 37.78 1.33
17 Horu Dhadum 3.08 1.03 43.33 20.29 27.99 44.81 1.42
Table 2: Results of chemical analyses of soil samples.
Sam-ple No.
Location pH Cond u- ctivity µs
Total solubl
e salt %
Loss on Ignition %
Acid insol-uble %
Org. Carbon
% Ca %
Mg %
Fe % Al % Na % K %
1 1 No Rongagora
6.65 65.1 1.24 6.47 at 568.330C
75.73 2.37 0.39 1.30 11.30 0.12 0.19 0.69
2 2 No Kothalguri
4.96 40.5 0.28 3.13 at 522.130C
87.40 1.37 0.39 1.30 5.82 0.04 0.22 0.49
3 Borjan, Digboi
4.90 21.0 0.23 4.58 at 565.330C
85.30 4.61 0.19 0.41 6.46 0.03 0.07 0.18
4 Udaipur 4.90 96.3 0.10 8.46 at 608.740C
74.90 4.56 0.24 0.58 7.02 0.064 0.09 0.20
5 Jagun 4.74 71.8 0.05 7.42 at 599.480C
76.50 2.12 0.01 4.31 17.05 0.13 0.29 0.68
6 Margherita 3.90 576.5 0.28 7.70 at 657.080C
77.51 3.12 0.81 0.76 11.99 0.19 0.18 0.54
7 Chowkham 2 5.95 52.6 0.32 2.79 84.38 1.99 0.16 0.23 8.34 1.61 0.06 0.06 8 Momong 6.74 65.7 0.16 3.65 81.63 0.69 0.73 0.11 10.54 2.50 0.04 0.14 9 Lathau 4.63 113 0.15 6.76 74.15 1.89 0.56 0.51 11.86 0.44 0.01 0.04
10 Nanam Budha Vihar
4.27 161.6 0.10 10.12 75.85 3.54 1.31 0.27 13.99 0.31 0.01 0.02
11 Namsai 4.47 13.4 0.26 5.40 83.60 1.56 0.66 0.37 6.59 2.00 0.02 0.06 12 Nabajyoti 6.48 3.8 0.94 2.67 85.31 0.49 0.89 0.50 7.54 2.83 0.20 0.05 13 Amguri 5.37 128.6 0.20 3.73 83.62 1.83 0.67 0.59 10.53 0.13 0.01 0.06 14 Lajum 4.91 248.2 0.35 2.99 85.21 1.46 8.19 0.48 10.53 0.13 0.02 0.05 15 Talap 4.70 182.6 0.29 2.59 81.25 .38 0.97 0.84 13.52 0.46 0.18 0.47 16 Dhola 5.44 102.6 0.27 3.05 70.84 3.41 1.24 0.85 11.99 0.55 0.21 0.71 17 Horu
Dhadum
Pranjal Kumar Das et al., J. Chem. & Cheml. Sci. Vol.1 (2), 137-149 (2011) 147
Journal of Chemistry and Chemical Sciences, Vol.1, Issue 2, 31 January, 2011 (93-149) Table 3: Chemical analysis of soil samples of various depths from Drilled Well No.-1 at Dhola
Location: N 27˚45'16.4" & E 95˚37'17.9" Elevation: 113m
Sample No.
Depths In cm
Particle Densities gm/ml
Bulk Density
gm/ml
Pore Space in %
pH Loss
on ignition
in %
Acid insoluble
in %
Ca % Mg % Na % K%
1 656 2.727 1.875 31.25 5.31 0.4 87.78 1.18 0.9545 0.0086 0.0136
2 1439 2.727 1.579 42.105 6.06 0.3397 85.352 1.022 0.9545 0.0086 0.0109
3 2709 2.727 1.579 42.105 6.14 0.1999 84.08 0.3932 0.8112 0.0064 0.0088
4 4237 2.727 1.5 45.00 6.67 0.3197 89.79 0.708 0.429 0.0099 0.0148
5 5249 2.3076 1.579 31.579 6.64 0.3399 85.40 0.7864 0.859 0.0086 0.0157
Table 4: Chemical analysis of soil samples of various depths from Drilled Well No.-2 at Chota Tingrai
Location: N 27˚27'12.9" & E 95˚22'30.4" Elevation: 106.8m
Sample No.
Depths In cm
Particle Densities gm/ml
Bulk Density
gm/ml
Pore Space in %
pH Loss
on ignition
in %
Acid insoluble
in %
Ca % Mg % Na % K%
1 92 2.857 1.25 56.25 5.1 5.179 75.82 2.815 6.49 0.332 0.028
2 1140 2.5 1.33 46.66 7.13 0.918 90.38 3.942 4.613 0.121 0.013
3 2025 2.00 1.428 28.57 5.43 3.98 78.08 6.19 1.121 0.114 0.008
7
4 3133 2.857 1.818 36.66 7.16 0.74 88.02 4.22 4.44 0.061 0.006
5
5 4153 2.5 1.25 50 6.34 0.69 88.25 5.913 10.418 0.179 0.011
6 5122 4.00 2.0 50 6.84 0.98 88.38 7.039 2.733 0.139 0.006
5
Table 5: Chemical analysis of soil samples of various depths from Drilled Well No.-3 at Naharkatia Location: N 27˚16'49.8" & E 95˚18'57.6" Elevation:103.4m
Sample No.
Depths In cm
Particle Densities gm/ml
Bulk Density
gm/ml
Pore Space in %
pH Loss
on ignition
in %
Acid insoluble
in %
Ca % Mg % Na % K%
1 53 2.22 1.33 40 4.41 5.76 84.22 0.08 0.86 0.03 0.037
2 865 2.22 1.54 30.76 5.83 1.82 91.14 0.16 1.42 0.03 0.035
3 2835 3.33 1.54 53.85 6.34 1.82 90.80 0.20 0.81 0.036 0.031
148 Pranjal Kumar Das et al., J. Chem. & Cheml. Sci. Vol.1 (2), 137-149 (2011)
Journal of Chemistry and Chemical Sciences, Vol.1, Issue 2, 31 January, 2011 (93-149)
Table 6: Chemical analysis of soil samples of various depths from Drilled Well No.-4 at Doomdooma Location: N 27˚32'43.0" & E 95˚32'36.1" Elevation:108.2m
Sample No.
Depths In cm
Particle Densities gm/ml
Bulk Density
gm/ml
Pore Space in %
pH Loss on
ignition in %
Acid insoluble
in %
Ca % Mg % Na % K%
1 50 2.11 1.11 47.22 4.25 6.08 81.72 0.05 0.61 0.082 0.284
2 450 2.00 1.25 37.50 5.68 3.20 85.72 0.20 1.07 0.041 0.136
3 905 2.00 1.43 28.57 6.28 1.76 88.48 0.20 0.55 0.114 0.154
4 1805 1.82 1.11 38.88 6.41 1.84 91.58 0.30 0.64 0.073 0.118
5 3136 2.22 1.54 23.10 6.68 1.44 73.62 0.44 0.44 0.073 0.133
6 5200 2.22 1.25 37.50 6.92 6.72 69.82 0.40 1.23 0.241 0.52
Table 7: Results of chemical analyses of water samples
Sample No.
Location pH Condu-ctivity (S)
TDS mg/l
Cl mg/l
CO3
mg/l HCO3
mg/l Ca
g/l Mg mg/l
Na
g/l K mg/l
Fe mg/l
RSC mg/l
SAR Total Hardness as (CaCO3)
in mg/l 1 1 No
Rongagora 6.46 127.3 150 12.25 70.56 269.01 389.46 063.52 5.57 1.75 0.56 2.26 468 x 10-3 26.761
2 2 No
Kothalguri 7.60 99.2 250 12.25 32.63 627.71 84.17 827.13 4.79 0.97 0.64 1.63 422 x 10-3 24.326
3 Borjan,
Digboi 7.42 71.3 250 8.20 21.19 197.28 7.90 119.52 3.57 2.22 0.80 0.82 838 x 10-3 3.4339
4 Udaipur 7.34 79.9 200 20.50 5.29 789.12 553.10 361.17 5.01 0.87 0.78 1.27 420 x 10-3 26.829
5 Jagun 7.22 407.3 400 2.02 3.53 789.12 895.55 597.55 33.93 6.31 3.07 0.19 1.89 60.941
6 Margherita 7.78 446.3 350 5.01 68.79 215.21 73.55 1299.67 13.43 1.26 0.40 1.89 932 x 10-3 39.254
7 Momong 8.07 163.1 250 39.37 84.37 1368.63 570.26 1774.40 0.59 0.33 1.26 3.69 30.7
x 10-3 68.624
8 Lathau 6.65 32.4 250 9.69 12.32 462.64 49.18 500.02 0.69 0.18 2.25 0.78 63.3
x 10-3 19.649
9 Nanam
Budha Vihar 7.48 171.1 150 27.89 75.84 1445.74 872.95 2318.45 0.86 2.22 2.57 3.48 44.2 x 10⁻³ 71.12
10 Namsai 7.84 177.7 100 1.33 57.83 1966.21 570.26 1577.24 1.37 0.83 1.02 3.86 74.2
x 10-3 64.563
11 Nabajyoti 6.77 128.9 100 1.33 23.7 963.83 63.85 78.87 0.71 29.59 0.39 2.79 84.1
x 10-3 13.656
12 Amguri 7.58 307.8 200 1.17 67.31 2197.52 648.26 3909.48 1.11 0.65 3.62 3.83 48.2
x 10-3 101.07
13 Lajum 6.82 89.9 100 6.25 23.7 626.49 423.45 1181.94 0.54 0.52 2.01 0.98 36.4 x 10⁻³ 42.11
14 Talap 6.64 142.3 150 5.86 31.83 761.30 125.85 1639.91 1.47 0.18 4.09 1.36 92.8 x 10⁻³ 47.49
15 Dhola 6.94 436.8 400 1.79 69.30 932.72 125.85 3005.98 1.33 6.81 1.15 1.54 66.5
x 10-3 75.949
16 Horu
Dhadum 8.15 59.4 100 4.19 35.58 989.45 576.35 2049.95 1.43 2.29 11.76 1.57 134 x 10-3 61.891
17 Rupai
Pranjal Kumar Das et al., J. Chem. & Cheml. Sci. Vol.1 (2), 137-149 (2011) 149
Journal of Chemistry and Chemical Sciences, Vol.1, Issue 2, 31 January, 2011 (93-149) CONCLUDING REMARKS
The area of investigation is a flood plain with thick succession of alluvial deposits and the geochemical characteristics of subsurface soil and groundwater is mainly the signature of natural events and geological formation rather than anthropogenic activities, which are limited to agricultural activities. The properties of the soils are mainly controlled by the deposition of sediments carried by Noa Dihing and Burhi Dihing rivers originated from the Patkai hill ranges. In the area near Noa Dihing river, the relative permeability of the soil is higher, of sandy loam type indicating easy recharge of the aquifers . The organic rich subsurface soils near Burhi Dihing river has more clay but less amount of ionic concentration and less porous. The area is also thickly populated with good agricultural practices. The sediments deposited by Brahmaputra may also contribute towards the overall geochemical characteristics of the soil. Apart from four locality (viz., Jagun, Amguri, Talap and Horudhadum) characterized by higher concentration of iron (3.07 mg/l to 11.76 mg/l), the groundwater from rest of the area are suitable for domestic purposes with relatively low iron concentration.
ACKNOWLEDGEMENT
The authors are grateful to Department of Science and Technology, Govt. of India for financial support, under SSS scheme,
under Project No.
SR/S4/ES-21/Brahmaputra-I/2004(p-4). They also thank Dr P. Sengupta, Head, Material Science division, NEIST, Jorhat for recording XRD patterns of some clay samples.
REFERENCES
1. Vogel, I., A textbook of quantitative inorganic analysis, 4th Edition, ELBS, New York, (1978).
2. Ramulu, U. S. S., Principles in the
quantitative analysis of water,
fertilizers, plants and soils., Scientific publisher, Jodhpur, India, (2003). 3. Tziritis, E. P., Groundwater and soil
geochemistry of the Eastern Kopaida region (Beotia, Central Greece). Cent. Eur. J. Geosci., 1, 219-226 (2009).
4. Saki, M. A., Shahin, M. A., Metwally, Y. M., Utilization of lime for stabilizing soft clay soils of high organic content. Geotech. Geol. Eng.,27, 105-113 (2009). 5. Olobaniyi, S. B., Owoyemi F. B.,
Characterization by factor analysis of the chemical facies of groundwater in the deltaic plain sands aquifer of Warri, Western Niger Delta, Nigeria. A. Jour. Sci. Tech., 7, 73-81 (2006).
6. Karnath, K. R., Ground water Assese-ment DevelopAssese-ment and ManageAssese-ment, Tata McGraw Hill, New Delhi, (1987).
7. Ragunath, H.M., Groundwater (2nd Ed), Wiley Eastern Ltd. Delhi, India, (1987).
8. Wilcox, L.V., Classification and use of irrigation water, USDA Circ. 969, Washington D.C., (1967).
9. Piper, A.M., A graphic procedure in the geochemical interpretation of water analyses, USGS Ground water Note, no 12,63, (1953).
10. Schoeller, Les eaux souterraines, Masson & Cie, Paris, (1962).