Geospatial (GIS) of Potential Soil Erosions Hazard
Mapping in Hulu Langat, Malaysia
Omar Al-Kouri
Department of Human Sciences, Geography , ART Faculty Taibah University, Medina, Kingdom of Saudi Arabia
Date of publication (dd/mm/yyyy): 16/05/2018
Abstract – The main goal of this study is to mapping potential soil erosion hazard map. The mapped and prioritized of Soil erosion hazard areas has been done by integrating GIS-grid analysis to provide valuable information about the most likely areas to be eroded using Arc GIS 9.1. The potential soil erosion factors such as erosive rainfall, soil type and slope steepness map was
utilized
in systematically method using ArcGIS Model Builder; where, the Universal Soil Loss Equation (USLE) for potential erosion map was adapted as GIS function. The results showed that the high potential area of soil erosion is found in North-East areas. Hula Langat residential area which is about 70% of high potential risk; whereas, Hulu Semenyih area has about 60% of high potential risk. Each of Semenyih, Cheras, Baranang has low of high potential risk about 30%, 25% in 10% respectively. Slope is the greater influence factorKeywords – Soil Erosion, Hazard Map, GIS Function, Potential Risk, Residential Area, Slope Steepness.
I. INTRODUCTION
The development tool of Geography information technology can support the new methods to a large extent in monitoring and change detection on Soil erosion. The role of GIS mapping and feature change detection generally provides a source of input data or an aid for computing coefficients and model parameters [12]. Experience has shown that satellite data can be interpreted to derive thematic information on (land change, soil, vegetation change, water level change, etc), combined with conventionally measured climatic parameters (precipitation, humid, temperature etc) and topographic parameters elevations (height, slope, contour), and provide the necessary parameters inputs to the change in land and soil [3, 5, 6].
A natural hazard is an aspect of the interaction between human and nature arising from the common process. [10]. Natural hazards are governed by the coexistent state of adjustment in the human use systems and the state of natural in the natural events systems. These processes, whether employing elaborate technical and social mechanisms or a simple one, make possible the human occupancy of areas of even frequent and recurrent natural hazards [10,11 -13].
Nowadays Geographic Information System (GIS) and remote sensing technology are emerging as a powerful tool for the assessment of risk and management of natural hazards. Due to these techniques, natural hazard mapping such as soil erosion hazard can be prepared now to delineate soil erosion prone areas on the map. Such kind of maps will help the civil authorities for quick assessment of potential impact of a natural hazard and initiation of appropriate measures for reducing the impact. Such data will help the
planners and decision-makers to take positive and in time steps during pre-disaster situation. It will also help them during post disaster activities for the assessment of damages and losses occur due to erosion. Moreover, GIS provides a broad range of tool for determining areas affected by erosion or forecasting areas that is likely to be eroded due to high land exploitation in the hilly, steep slope and heavy rainfall area [1, 7, 9, and 13].
Agricultural land needs preserving for maintaining crops quantity and quality. However, agriculture land is prone to erosion that damage soil. Soil erosion is long term phenomenon that is not easy to simplify or visualize for a layman. The aim is to create potential soil erosion risk map of Hulu Langat area base on GIS. The objectives of this study are to create potential risk map of soil erosion using ArcGIS model builder tool, to identify the priority areas for soil conservation.
Review of previous and related literature reveals that GIS map and temporal satellite-derived information has been used in monitoring soil erosion effected parameters, soil level change detection, and in other environmental applications such as the use of Radar for soil level and surface change [14, 15, 17,]. The study was conducted to detect changes in soil and effected soil erosion parameters change using GIS and temporal satellite data Ikons and Land-sat for monitoring potential risk area of soil erosion [2]. Many research have been studied and investigate the potential soil erosion hazard map and there effected in residential area using GIS and remote sensing data [10, 16]. However, their work was done for smaller areas. As such, it was not wide and comprehensive enough to include larger effected parameter of soil erosion [1, 7, 9, 13]. Also, they didn't investigate the level of risk in potential erosion soil hazard map of large periods. Mostly, they didn't use the eroded due to high land exploitation in the hilly, steep slope and heavy rainfall area analysis. This means low accuracy of detection of potential erosion soil area. In this research, we have included the whole effected parameters in a large period.
II. STUDY AREA
Fig. 1. Show the Hulu Langat, Malaysia.
III. MATERIAL AND METHOD
A- Data
Table 1: shows the dataset (digital topographical map, soil map and rainfall map) that are essential to perform geospatial processing to produce soil erosion map.
Table 1: Required data set
Data type Data year Source of data
digital topographical
map 2015 UPM Library
Soil map 2010 MACRES
Rain Fall map 2015 MACRES
A brief description of each map and its classifications are listed as follows: Rain fall factor map (erosivity surface) was obtained from MACRES, dated for the year 2015. The map classification was based on rain fall level measured by cm. The map was classified to 7 classes of between 450 and 750 cm. These classes was used as ready input of R factor in ULSE, show in figure 2. Soil map that was obtained from MACRES was classified to 7 classes (LAA, MUN, RGM, SDG, STP, Tavy and Urban); the majority soil type of the area is STP followed by RGM, show in figure 3.
Fig. 2. Hulu Langat Rainfall factor map
Fig. 3. Hulu Langat Soil map.
Table 2: present 11 soil types and its equivalent K factor for Selangor state, where Hulu Langat district have 7 types. The table was obtained from MACRES (2010) [19]. Therefore, Hulu Langat soil Erodibility map was produced by matching the soil type and the equivalent k factor
Table 2: Soil type and Soil equivalent K factor (MACRES, 2010).
Soil Type
K-Value Soil Type Value
K-MUN 0.325 STP 0.181
LAA 0.286 KRJ 0.179
SDG 0.243 SGR 0.155
TVY 0.209 KDH 0.143
RGM 0.181 PRH 0.090
PRG 0.041 Water and Urban
areas 0
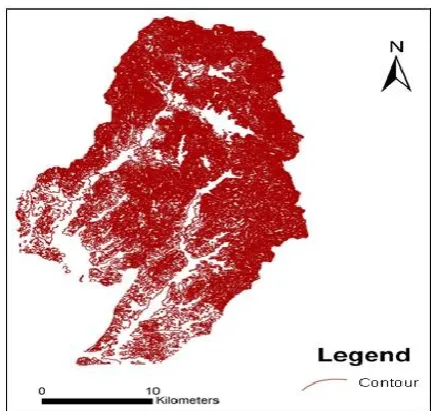
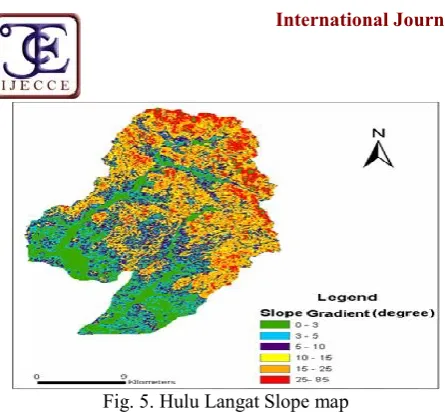
Digital topographical maps of the Hulu Langat were obtained from UPM Library, dated for the year 2015. The map is based on contour lines with 20m interval, which used to calculate the LS factor by using ArcGIS built-in geo-processing functions same as defined in the study of MACRES (2010) figure 4 and 5.
Fig. 5. Hulu LangatSlope map
IV. FACTORS INFLUENCING EROSION
Soil erosionsas it is natural phenomena, there are factors that influence its occurrence and directions; the common known factors are climate, vegetation and land slope. These factors also define its potential risk based on the community The climate factor affecting erosion hazard is mainly characterized by erosivity as the potential ability of rain to cause erosion; it is a function of the physical characteristics of rainfall [1, 7].
The climatic sub-factors that influence erosion are rainfall amount, intensity, and frequency. During periods of frequent rainfall, a greater percentage of the rainfall will become runoff due to high soil moisture or saturated conditions [5]. Vegetation is probably the most important physical factor influencing soil erosion. A good cover of vegetation shields the soil from the impact of raindrops. It also binds the soil together, making it more resistant to runoff. A vegetative cover provides organic matter, slows runoff, and filters sediment. On a graded slope, the condition of vegetative cover will determine whether erosion will be stopped or only slightly halted. A dense, robust cover of vegetation is one of the best protections against soil erosion.
The vegetation factors, affecting erosion hazard vary with the season, crops, degree of maturity, as well as with the kind of vegetative material, namely, roots, plant tops, and plant residue. Soil with sparse vegetation is more susceptible to erosion. This is because the roots of plants, especially trees, bind soils and rocks together. Vegetation cover leaves and branches plus the top layer of organic matter covering the ground, known as litter, also acts to protect the soil from the force of intense rains [8].
According to [3, 15 steepness and roughness affect Erodibility. Generally, the longer the slope the greater the potential of erosion. The greatest erosion potential is at the base of the slope, where runoff velocity greatest and runoff concentrates. Slope steepness, along with surface roughness, and the amount and intensity of rainfall control the speed at which runoff flows down a slope. The steeper the slope, the faster the water will flow. The faster it flows, the more likely it will cause erosion and increase sedimentation
Slope steepness is an important factor governing the efficacy of splash erosion as slope angle steepness more soil is splash down slope. The relationship between slope
steepness and sheet erosion and rill erosion are equivocal. However, although it is assumed in equations for predicting soil loss that slope steepness is an important factor controlling severity of erosion [12-14].
Fig. 6. The Influence of Slope Factor
V. DETERMINATION AND CLASSIFICATION OF
EROSION FEATURE SET
Morgan indicated a method to combine the erosion hazard factors in the compilation of an erosion hazard map by using a scoring system for rating erosion hazard. In this method each unit is rated on a scale from 1 to 5 on the basis of erosion hazard factors, i.e. erosivity, slope steepness, Erodibility, ground cover and human occupation. The scoring is arranged so that 1 is associated with a low erosion hazard and 5 with a high erosion hazard. The five factors scores are summed to give a total score which is compared with an arbitrarily chosen classification system to categorize areas which vary from very low up to very high erosion hazard classes11-14].
The soil loss is predicted on basis of soil loss equation according to Wischmeier and Smith [17] as follows formula 1:
A = R. K. L. S. C. P (1)
Where:
A = Is the computed soil loss on tons per acre per year. R = The rainfall and runoff factors.
K = The Erodibility factor. L = The slope length factors. S = The slope steepness factor. C = The crop and management factor. P = The support practice factor.
In order carry out an erosion hazard survey efficiently a systematic approach can be adopted based on the land resource survey, resulting in a breakdown of the area into land units. The degree of erosion hazard within each land unit can be obtained by the evaluating each soil loss factor. Saro (2011) studied the evaluation of the hazard of soil erosion and its verification at Boun, Korea, using a GIS and remote sensing. The precipitation, topographic, soil, and land use data were collected, processed, and constructed into a spatial database using GIS. Areas that had suffered soil erosion were analysed and mapped using the Universal Soil Loss Equation (USLE)[20].
Erodibility (K) from the soil database, slope length and steepness (LS) from the topographic database, and crop and management (C) and conservation supporting practices (P) from the land use database. Land use was classified from Landsat Thematic Mapper satellite images.
In Malaysia, Soil erosion risk map was developed for Langkawi Island using the USLE, remote sensing and GIS; Spatial modelling requires generating a representative raster layers based on original data for the following parameters: rainfall erosivity, slope length/gradient, soil Erodibility and conservation practices[8]. The analysis was performed using IDRISI, a raster based GIS software.
Recently, the use of USLE has been extended as a useful tool to predict soil losses and planning control practices in agricultural watersheds by estimating the factor values in a grid cell basis. The study was performed in the Kazan Watershed located in Central Anatolia, Turkey to predict soil erosion risk by the integrating USLE and GIS methodology for planning conservation measures in the site [6].
VI. CALCULATING THE LS FACTOR
There is an about two well-known methods for calculating Length Slope (LS) factor: i) Weischmeier and Smith (1968) and ii) Moore and Burch (1986)[13]. Weischmeier and Smith (1968) method consist of two inputs regarding the slope (gradient and length). However, the method proposed by Moore and Burch (1986) [12-13] found to be computerize due most of its inputs depend on digital raster metadata, such as cell size (also known as grid size).
The method of determining potential risk areas of soil erosion is based on MACRES (2003) using the four factors (rain Erosivity, soil Erodibility, slope gradient and slope length). However, method of calculating Length Slope (LS) factor will be based on Moore and Burch (1986)[22], where the calculation depend on three type of entries: the slope gradient (in degrees), flow accumulation (calculated from slope) and cell size (obtained from ArcGIS default parameters of data conversion to raster). In contrast, the method of Weischmeier and Smith (1968) requires calculating each of slope gradients (provide as ArcGIS function) and slope length (which is not provided as ArcGIS function). Therefore, the method of Moore and Burch (1986) was used in this project of it simple implementation of USLE in ArcGIS. In This research had undertaken the following steps as fellow:
1.
A new toolbox was created for soil erosion and within it a new model was created.
2. Data format for each of the TIN, R and K factor maps were unified for using geoprocessing function (specifically Map Algebra), where inputmaps are converted to raster maps. This was done in ArcGIS Model Builder by inserting “TIN to Raster” function into model builder and establishing the connection between it and the input data (TIN data). The same was done for each of K and R factor by converting them using “Polygon to Raster” function.
3. The LS factor was calculated from the derived formula that was proposed by Moore and Burch (1986). The formula and the raster topographical map were entered using Map Algebra (Figure 6). The entered expression of the formula 2 is :
Pow (Flow Accumulation (Flow Direction (Tin2 Raster)) *20/22.1, 0.4)* Pow (Sin (slope (Tin2 Raster)* 0.01745) /
0.09, 1.4) (2)
Where, Tin2Raster is the raster topography map.
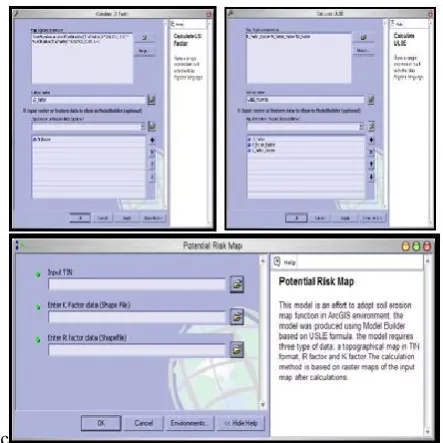
Calculation of USLE for potential soil erosion in ArcGIS Model Builder was done using Map Algebra (Figure 7). The entered expression of the USLE is :
R_factor_Raster*K_factor_Raster*LS_factor
The model was enhanced to enable users to add their data through defining each of TIN, R factor and K factor as input parameter for the model (Figure 8).
c
Fig. 7. Customized function for LS factor calculation and USLE potential map calculation using Map Algebra
The model was saved with the following diagram layout, show in figure 8.
The model was tested using the available dataset of Hulu Langat district, where it produce the soil erosion potential risk map. The model was tested using the available dataset of Hulu Langat district, where it produce the soil erosion potential risk map.
The produced soil erosion potential risk map view was classified to match the ones was produced by MACRES [19] for Selangor state. The soil erosion classification scheme was adopted from Department of Environment, Malaysia. This was done to validate the produced map by sub setting Hulu Langat district part from Selangor state. The potential risk map of soil erosion was overlaid with residential boundaries in Hulu Langat district to view the severity in each residential boundary (Mukim).from the overlay, it was determined the priority for each mukim area for soil conservation.
V. RESULT AND DISCUSSION
The implementation soil erosion model in ArcGIS using Model Builder, have provided a systematic and simple method to view and study the adopted soil erosion model. In addition, the Model Builder have provided a method for developing a soil erosion function, which simplify the usage of the soil erosion model; where users have only to define their data set, the model process the spatial data and display the results on screen. Based on the developed potential soil erosion model that requires 3 input (K factor, R factor and TIN), the final map was utilized in figure 9. The classification method used for displaying potential risk was based on the soil erosion scheme that was developed by Department of Environment, Malaysia and used by MACRES (2010)[9], see figure 10.
Fig. 9. A: The potential soil erosion risk map of Hulu Langat district
Fig. 10. B Soil Erosion for Selangor state (MACRES, 2010)
The visual comparison of the two maps shows there is high potential soil erosion in Hulu Langat district near is upper part, where about third quart of its map shows less potential risk. However, the comparison shows that MACRES (2010) [19] map have general pattern of soil erosion for Hulu Langat District; because the map was produce for whole Selangor state. Whereas, the produce map in this project show more details of soil erosion, though both maps were geoprocessed based on raster function and calculations.
VI.
S
OILE
ROSION FORR
ESIDENTIALA
REAS INH
ULUL
ANGATD
ISTRICTFig. 11. Potential soil erosion risk map for residential areas in Hulu Langat district
VII. CONCLUSION
The potential soil erosion risk map for Hulu Langat area was produced using USLE model in ArcGIS model builder. Hazard assessment and risk mapping can prove very useful tool for advance conservation planning,. Based on this study, the input factor maps are the important aspect for producing accurate erosion risk map. This research was found that the implementation of USLE model in ArcGIS Model Builder was useful in term of organization. In addition, the model was simplified by making it’s usage like a function of ArcGIS. The produced potential soil erosion risk map have shown some level ofdetails compared with the map that was produces by MACRES (2010), where their work have been generalized for whole state of Selangor. Whereas, the produced map is for the Hulu Langat district.
ACKNOWLEDGMENT
We thank the NASA Earth System for the LANDSAT products and Taibah university the Deanship Science Foundation for Resources Satellite Data and Application.
REFERENCES
[1] A. N. Moses, “GIS-RUSLE Interphase Modelling of Soil Erosion Hazard and Estimation of Sediment Yield for River Nzoia Basin in Kenya, “ Journal of Remote Sensing & GIS, vol. 06, no. 03, 2017.
[2] A. H. El Nahry,Mahmoud M. Ibrahim,A.A. El Baroudy“Soil Degradation Assessment in North Nile Delta Using Remote Sensing and GIS Techniques“The International Archives of the Photogrammetry, Remote Sensing and Spatial Information Sciences, Volume XL-7/W3, 201536th International Symposium on Remote Sensing of Environment, 11–15 May 2015, Berlin, Germany.
[3] A.A. El Baroudy,A.A. El BaroudyFarahat, S. Moghanm Farahat S. Moghanm, “Combined use of remote Sensing and GIS for degradation risk assessment in some soils of theNorthern Nile Delta, Egypt” Egyptian Journal of Remote Sensing and Space The
Egyptian Journal of Remote Sensing and Space Sciences, vol.17, 77–85, 2014.
[4] B. Das, “Role of GIS in Soil Erosion,” SSRN Electronic Journal, 2017.
[5] B. Šarapatka, M. Bednář, and P. Novák, “Analysis of soil degradation in the Czech Republic: GIS approach,” Soil and Water Research, vol. 5, no. No. 3, pp. 108–112, Nov. 2018. [6] C. Igwe and S. Obalum, “Microaggregate Stability of Tropical
Soils and its Roles on Soil Erosion Hazard Prediction,” Advances in Agrophysical Research, 2013.
[7] F. J. Arriaga, B. Lowery, D. J. Reinert, and K. Mcsweeney, “Cone Penetrometers as a Tool for Distinguishing Soil Profiles and Mapping Soil Erosion,” Progress in Soil Science Digital Soil Morphometrics, pp. 401–410, 2016.
[8] F. Li and G. Tang, “DEM based Terrain Factor of Soil Erosion at regional Scale and Soil Erosion Mapping,” Lecture Notes in Geoinformation and Cartography Advances in Cartography and GI Science. Volume 2, pp. 383–395, 2011.
[9] G. Valladares and M. Hott, “The Use of GIS and Digital Elevation Model in Digital Soil Mapping – A Case Study from São Paulo, Brazil,” Digital Soil Mapping with Limited Data, pp. 349– 356, .8002
[10] H. Reuter, L. R. Lado, T. Hengl, and L. Montanarella, “Modeling Wind Erosion Events – Bridging the Gap Between Digital Soil Mapping and Digital Soil Risk Assessment,” Digital Soil Mapping, pp. 281–293, 2010.
[11] J. K. Newman, A. L. Kaleita, and J. M. Laflen, “Soil erosion hazard maps for corn stover management using National Resources Inventory data and the Water Erosion Prediction Project,” Journal of Soil and Water Conservation, vol. 65, no. 4, pp. 211–222, Jan. 2010.
[12] L. Gouee, C. Olivier, B. Abdelkrim, and G. Alexis, “SCALES: An Original Model to Diagnose Soil Erosion Hazard and Assess the Impact of Climate Change on Its Evolution,” Soil Erosion Studies, 2011.
[13] Miftari, F. Gjoka, and E. Toromani, “Assessment of soil loss and mapping of erosion hotspots in Ulza watershed using GIS,” Proceedings of the 5th Virtual Multidisciplinary Conference, 2017.
[14] M. Habibullah, “GIS-Based Soil Liquefaction Hazard Zonation due to Earthquake Using Geotechnical Data,” International Journal of Geomate, 2012.
[15] R. Lawley and B. Smith, “Digital Soil Mapping at a National Scale: A Knowledge and GIS Based Approach to Improving Parent Material and Property Information,” Digital Soil Mapping with Limited Data, pp. 173–182.
[16] R. J. Patil, “USLE–GIS-Based Soil Erosion Assessment: An Overview,” Spatial Techniques for Soil Erosion Estimation Springer Briefs in GIS, pp. 7–27, 2018.
[17] U. Berk Soil Erosion Modelling By Using GIS & Remote Sensing: A Case Study, Ganos Mountain Itu, Civil Engineering Faculty, Maslak Istanbul,Turkey, 2015.
[18] Y. Lf, Y. Gs, and Z. of, “Soil Erosion Assessment of the Poyang Lake Basin, China: Using USLE, GIS and Remote Sensing,” Journal of Remote Sensing & GIS, vol. 5, no. 3, 2016. [19] Y. Sasaki, “Shallow Landslide Process and Hazard Mapping
Using a Soil Strength Probe,” Engineering Geology for Society and Territory - Volume 2, pp. 957–960, 2015.