Turkish Journal of Fisheries and Aquatic Sciences 12: 417-422 (2012)
www.trjfas.org ISSN 1303-2712 DOI: 10.4194/1303-2712-v12_2_31
© Published by Central Fisheries Research Institute (CFRI) Trabzon, Turkey
Black Sea Phytoplankton Data Quality – Problems and Progress
Introduction
The quality of biological data has gained a recognition as an essential part of international monitoring programmes, in response to the demand for strategic environmental evaluations such as the EU WFD, the MSFD and informed decisions for environmental sound management.
Phytoplankton is an essential part in the process of understanding and predicting changes in the marine environment. Community structural characteristics bear valuable information about the evolution of phytoplankton assembly and the trajectories of shifts under multiple environmental factors, including anthropogenic and global climatic impacts. Details of phytoplankton analytical procedures are essential to compare data produced by different analysts either during long-term monitoring programs in one area or between different areas in order to evaluate statistically significant long-term trends or spatial differences. Carbon biomass of plankton organisms is a fundamental parameter in ecosystem models and biogeochemical carbon budgets. Temporal and spatial variability in total and export primary production can
be quantified and predicted only if the carbon content of the major plankton organisms is known. Estimates of carbon biomass of plankton organisms are usually made by converting microscopic size measurements to cell volumes, which are then converted to carbon biomass using empirically or theoretically derived carbon to volume ratios. Irrespective of the available manual for phytoplankton sampling and analysis in the Black Sea (Moncheva and Par, 2005) based on agreed procedures among laboratories from the 6 Black Sea countries the latter are not fully followed, or labs are working according to there own routines. Standards such as the ISO 9000 series and ISO 17025 provide a general framework for quality assurance but so far criteria for determining the acceptability of data from surveys of biological communities to meet specified information needs at international level are still under development, and should be given high priority.
Hence the importance of comparability of data when regional data bases are composed and further used in various regional studies. In the present paper the results of an intercalibration exercise conducted among four Black Sea phytoplankton laboratories Snejana Moncheva1,*, Maria Pantazi2, Larisa Pautova3, Laura Boicenco4, Dan Vasiliu5,
Luydmila Mantzosh6 1
Institute of Oceanology-BAS, Parvi Mai str., No 40, P.O. Box 152, 9000 Varna, Bulgaria. 2
HCMR P.O. Box 712, 19013Anavissos, Greece. 3
P.P Shirshov IO-RAS, 36, Nahimovski prospect, 117997 Moscow, Russia. 4 NIMRD “Grigore Antipa”, Mamaia Bd., No 300, RO-900581 Constanta, Romania. 5
GeoEcoMar Institute, Mamaia Bd., No 304, RO-900581, Constanta, Romania. 6
IBSS,2 Nakhimov Ave. 99011 Sevastopol, Ukraine. * Corresponding Author: Tel.: +359.52 370485; Fax: ; E-mail: [email protected]
Received 15 March 2012 Accepted 23 June 2012
Abstract
The quality of biological data has gained recognition as an essential part of international monitoring programmes, in response to the demand for strategic environmental evaluations such as the EU WFD, the MSFD and informed decisions for environmental sound management. The paper presents the results of an intercalibration exercise among four Black Sea phytoplankton laboratories (NIMRD-RO, IBSS-UKR, IO-RAS – RUS and IO-BAS - BLG) conducted under SESAME FP6 Project with the objectives: 1) to assess the degree of comparability of phytoplankton and chlorophyll a data produced by routine in-house methods; 2) to formulate recommendations for progress towards harmonization of the research methodology in the Black Sea. The statistical treatment of the results reveal that at the level of total phytoplankton abundance and biomass as well as chlorophyll a the data were in a good agreement, while for some taxonomic classes (Prymnesiophyceae and small flagellates) the differences were significant. The counted sample volume proves essential for detection of species diversity and the methods of species specific biovolume measurements - for the total biomass. As a follow up Guidelines for QC/QA of phytoplankton data and check-list with suggested shapes for biovolume calculation were produced under UP-Grade Black Sea SCENE FP7 Project that offer key options for progress.
418
(NIMRD-RO, IBSS-UKR, RAS – RUS and IO-BAS - BLG) are presented.
The objective of the intercalibartion exercise was to compare the results of phytoplankton and chlorophyll a measurements following in-house routine methodology in order to:
1) assess the degree of comparability/differences in phytoplankton and chlorophyll a data collected during the SESAME field campaigns;
2) where possible to make recommendations and catalyze actions for further improvement and harmonization of research methodology in the Black Sea.
We focus on the abundance and biovolume analysis, where the differences may impact significantly the final results. This exercise was expected to produce valuable results for assisting the modeling stage of SESAME Project and contribute to phytoplankton data management in the Black Sea.
Materials and Methods
Sampling Logistics
Prior to the cruise a one day workshop was organized at IO-BAS to design the sampling strategy and refine the approach of the intercalibration exercise. 2 sampling stations were selected along the SESAME sampling polygon – one in the coastal area and one in the open sea (SESAME intercalibration & sediment trap station), where data have been already collected during previous campaigns by several SESAME partners.
Phytoplankton and Chlorophyll a Sample
Preparation
Water samples were collected from a depth 1m bellow the surface by CTD Rosette System to which
5l sampling bottles were attached. In order to minimize possible sampling difference the water from the CTD bottles was homogenized in a large vessel (15 L) prior to collecting 1l water samples distributed in three replicates to each partner. The samples were fixed in 4% buffered to pH 8-8.2 with disodiumtetraborate (borax-Na2B403 • 10 H20) formaldehyde solution and stored in plastic containers for further lab analysis. For IO-RAS the samples were fixed in 2% buffered formaldehyde to comply with the routine practice.
Similar homogenizing procedure was applied for chlorophyll samples. The samples were filtered through 47 mm GF/F, Whatman MILLIPORE filters at 0.2 atm vacuum (Vacuum pump MILLIPORE). The filters were stored in liquid N and delivered to the partners lab.
Basic information of the in- house routines for phytoplankton and chlorophyll a lab analysis among the different participants labs is summarized in Table 1 and Table 2.
Statistical Analysis
The data were checked for statistical differences among the 4 laboratories (Bulgaria, Russia, Romania and Ukraine) on the following parameters:
• Phytoplankton Total Abundance [cells/L] • Phytoplankton common taxonomic classes (Bacillariophyceae, Dinophyceae, Prymnesiophyceae, Cryptophyceae, Small flagellates and Chrysophyceae) Total Abundance [cells/L]
• Phytoplankton Total Biomass (wet weight) – [mg/m3]
• Chlorophyll a measurements [μg/L]
In this comparison test we applied the following statistic treatement:
1) Robust statistics-ANOVA test and the Tukey’s test at a confidence of 0.95, on log -transformed data in order to normalize the skewed distribution and to stabilize the variance and Lavene
Table 1. Inventory of in-house methods of phytoplankton analysis
Participant Sample concentration Counting chamber Type of microscope Volume of subsample BLG Decantation Utermol Segwick Rafter Utermol Nicon inverted+
immage analysis 1.0 ml
RO Decantation Utermol Utermol Inverted 0.1 ml
RUS Decantation/inverse filtration
Nogott’s - 0.1 ml Nauman’s
chamber 1 or 5 ml Light compound 1.0 ml
UKR Decantation Nauman’s chamber 1 ml - 0.05 ml Light compound 0.1 ml
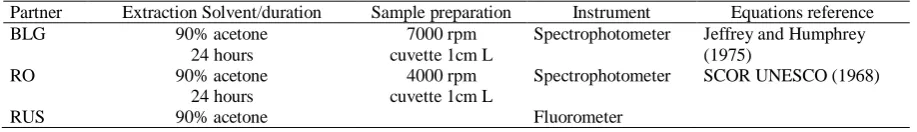
Table 2. Inventory of in-house methods of chlorophyll a analysis
Partner Extraction Solvent/duration Sample preparation Instrument Equations reference
BLG 90% acetone
24 hours
7000 rpm cuvette 1cm L
Spectrophotometer Jeffrey and Humphrey (1975)
RO 90% acetone
24 hours
4000 rpm cuvette 1cm L
Spectrophotometer SCOR UNESCO (1968)
S. Moncheva et al. / Turk. J. Fish. Aquat. Sci. 12: 417-422 (2012) 419
statistic for checking the homogeneity of the variance between the groups; Bray-Curtis similarity among samples on square root transformed data of taxon species specific abundance and biomass. These methods were applied to BLG, UKR and the RUS data (no replicates by the RO partner).
2) Common statistics employed during phytoplankton ring tests - average±standard deviation (SD) and CV <20% (Rott et al., 2007; Lacouture, 2001; HELCOM, 2003)
Results and Discussion
Comparison of Phytoplankton Numerical Abundance
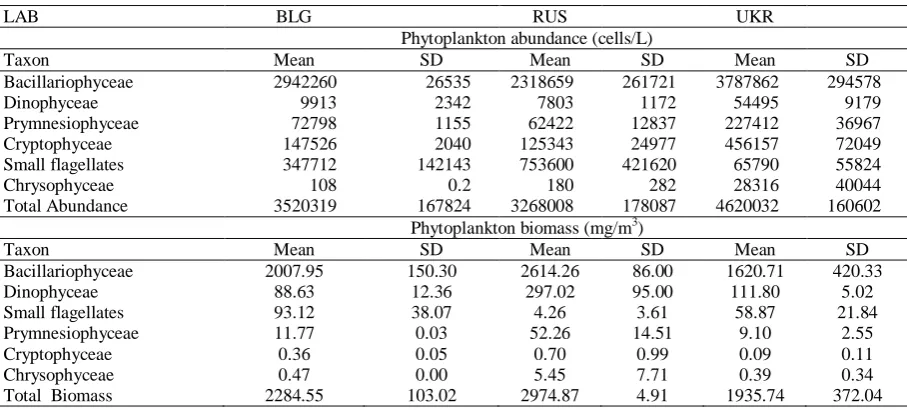
The statistical summary of the results for the total abundance and biomass and major taxonomic classes by the different labs are presented on Table 3.
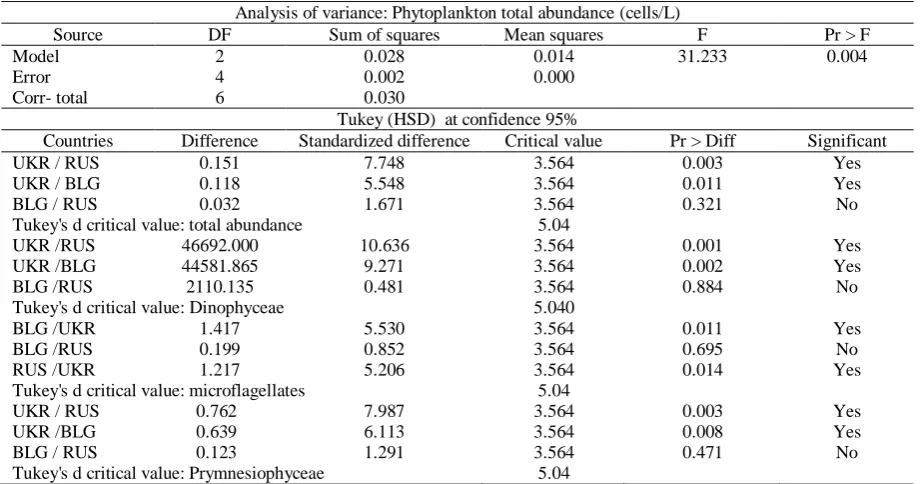
The ANOVA statistics for total abundance show significant differences between the Ukrainian-Bulgarian results, and between the Ukrainian-Russian results, while the difference between Bulgarian and Russian data were not significant (Figure 1 and Table 4). The same stands for the comparison between the abundance of the taxonomic classes Dinophyceae, Small flagellates and Prymnesiophyceae, where the deviations were much higher.
For the remaining taxonomic groups (Bacillariophyceae, Cryptophyceae and Chrysophyceae) as well as for the biomass the ANOVA results could not be considered reliable, since the F statistic value was higher than 0.05 (F>0.05) (results not shown).
Hierarchical clustering based on species specific and total abundance and biomass of the replicates showed high similarity - >85% between Bulgarian and Russian data and between Ukrainian-Bulgarian
and Ukrainian-Russian >75% respectively (Figure 2). The reproducibility of the in-house analysis (CV <20%) for the total numerical abundance and biomass yield very close results both between the replicates and between the different labs (Table 5).
At the level of taxonomic classes the differences among the participating labs were significant, especially critical for Prymnesiophyceae and small flagellates, where also the in-house results show inconsistencies for all partners. Albeit the good agreement between the data among some of the labs this was not systematic for all the taxonomic groups that add further complexity to the comparability of the result.
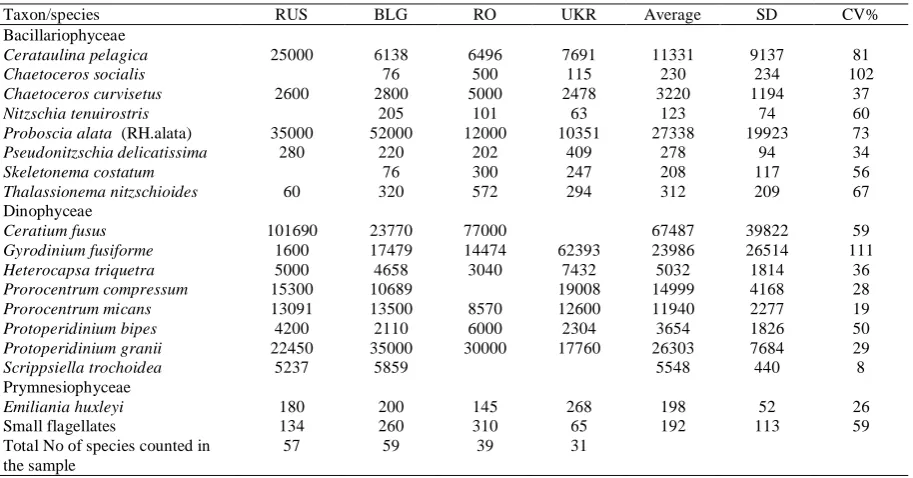
As apparent from the comparative analysis of the common species biovolume used by the participating labs out of 18 species that compose the bulk of the phytoplankton assembly only for 2 species the specific biovolume was similar (CV<20%). Thus for example for the dominant species such as Pseudo-nitzschia delicatissima and Emiliania huxleyi the biovolume varied more than twice (202-409 µm3 and 145-268 µm3 respectively) for other species the differences exceeded 3 fold – Table 6.
Chlorophyll a
The results of chlorophyll a measurements reveal good in-house reproducibility for BLG and RO and higher than 10% difference for RUS lab – Table 7. The difference between the BLG and RO data was within the average ± stdev, the higher deviation observed in the values lower than 1 µg/L, most likely related to the different methodology (spectrophotometry and fluorimetry). Among the higher values as expected the difference was not significant (Table 7).
There are various approaches used during ring
Table 3. Statistical summary of phytoplankton abundance (cells/L) and biomass (mg/m3)
LAB BLG RUS UKR
Phytoplankton abundance (cells/L)
Taxon Mean SD Mean SD Mean SD
Bacillariophyceae 2942260 26535 2318659 261721 3787862 294578
Dinophyceae 9913 2342 7803 1172 54495 9179
Prymnesiophyceae 72798 1155 62422 12837 227412 36967
Cryptophyceae 147526 2040 125343 24977 456157 72049
Small flagellates 347712 142143 753600 421620 65790 55824
Chrysophyceae 108 0.2 180 282 28316 40044
Total Abundance 3520319 167824 3268008 178087 4620032 160602
Phytoplankton biomass (mg/m3)
Taxon Mean SD Mean SD Mean SD
Bacillariophyceae 2007.95 150.30 2614.26 86.00 1620.71 420.33
Dinophyceae 88.63 12.36 297.02 95.00 111.80 5.02
Small flagellates 93.12 38.07 4.26 3.61 58.87 21.84
Prymnesiophyceae 11.77 0.03 52.26 14.51 9.10 2.55
Cryptophyceae 0.36 0.05 0.70 0.99 0.09 0.11
Chrysophyceae 0.47 0.00 5.45 7.71 0.39 0.34
Total Biomass 2284.55 103.02 2974.87 4.91 1935.74 372.04
420 S. Moncheva et al. / Turk. J. Fish. Aquat. Sci. 12: 417-422 (2012)
Phytoplankton Total abundance
0 1000000 2000000 3000000 4000000 5000000
BLG RUS UKR
[c el ls /l ] Average SD Small flagellates 0 200000 400000 600000 800000 1000000 1200000 1400000
BLG RUS UKR
[c el ls /l ] Average SD Dinophyceae 0 10000 20000 30000 40000 50000 60000 70000
BLG RUS UKR
[c el ls /l ] Average SD Prymnesiophyceae 0 50000 100000 150000 200000 250000 300000
BLG RUS UKR
[c el ls /l ] Average SD 0 1000000 2000000 3000000 4000000 5000000
BLG RUS UKR
[c el ls /l ] SD Small flagellates 0 200000 400000 600000 800000 1000000 1200000 1400000
BLG RUS UKR
[c el ls /l ] Average SD Dinophyceae 0 10000 20000 30000 40000 50000 60000 70000
BLG RUS UKR
[c el ls /l ] Average SD Prymnesiophyceae 0 50000 100000 150000 200000 250000 300000
BLG RUS UKR
[c el ls /l ] Average SD
Figure 1. Stock plot of total phytoplankton and selected taxonomic classes abundance [cells/L - average and standard deviation (SD)]; BLG - Bulgaria, RUS – Russia, UKR – Ukraine.
Table 4. Statistical summary of ANOVA and Tukey’s test
Analysis of variance: Phytoplankton total abundance (cells/L)
Source DF Sum of squares Mean squares F Pr > F
Model 2 0.028 0.014 31.233 0.004
Error 4 0.002 0.000
Corr- total 6 0.030
Tukey (HSD) at confidence 95%
Countries Difference Standardized difference Critical value Pr > Diff Significant
UKR / RUS 0.151 7.748 3.564 0.003 Yes
UKR / BLG 0.118 5.548 3.564 0.011 Yes
BLG / RUS 0.032 1.671 3.564 0.321 No
Tukey's d critical value: total abundance 5.04
UKR /RUS 46692.000 10.636 3.564 0.001 Yes
UKR /BLG 44581.865 9.271 3.564 0.002 Yes
BLG /RUS 2110.135 0.481 3.564 0.884 No
Tukey's d critical value: Dinophyceae 5.040
BLG /UKR 1.417 5.530 3.564 0.011 Yes
BLG /RUS 0.199 0.852 3.564 0.695 No
RUS /UKR 1.217 5.206 3.564 0.014 Yes
Tukey's d critical value: microflagellates 5.04
UKR / RUS 0.762 7.987 3.564 0.003 Yes
UKR /BLG 0.639 6.113 3.564 0.008 Yes
BLG / RUS 0.123 1.291 3.564 0.471 No
Tukey's d critical value: Prymnesiophyceae 5.04
S. Moncheva et al. / Turk. J. Fish. Aquat. Sci. 12: 417-422 (2012) 421
tests and intercalibration exercises to measure comparability/uncertainty of data. Uncertainty of a final result encompasses the uncertainties of the whole measurement process (sampling, sub-sampling, homogeneity, identification, quantification etc.). In
biological methods it should be taken into consideration that uncertainties are sometimes qualitative in nature (misidentification) and difficult to combine with other uncertainties into a final one. Often the absolute statistical limits are difficult to
Table 5. Average taxonomic classes abundance (cells/L) and biomass (mg/m3) and CV (%) by partners
Phytoplankton Abundance (cells/L)– CV% Phytoplankton Biomass (mg/m3) – CV% LAB Total N Bac Din Prymn microfl Total B Bac Din Prymn microfl
BLG 4.8 7 23.6 11.0 40.9 19.2 7.5 13.9 8.5 40.9
RUS 5.4 11.3 15.0 22.6 55.9 4.5 25.9 4.5 28.0 37.1
UKR 3.5 7.8 16.8 15.7 84.9 0.2 3.3 32.0 27.8 84.7
All 17.7 20.0 93.1 45.5 117.4 19.5 22.0 54.2 101.6 114.7
Table 6. Common phytoplankton species biovolume (µm3) used by the different participants
Taxon/species RUS BLG RO UKR Average SD CV%
Bacillariophyceae
Cerataulina pelagica 25000 6138 6496 7691 11331 9137 81
Chaetoceros socialis 76 500 115 230 234 102
Chaetoceros curvisetus 2600 2800 5000 2478 3220 1194 37
Nitzschia tenuirostris 205 101 63 123 74 60
Proboscia alata (RH.alata) 35000 52000 12000 10351 27338 19923 73 Pseudonitzschia delicatissima 280 220 202 409 278 94 34
Skeletonema costatum 76 300 247 208 117 56
Thalassionema nitzschioides 60 320 572 294 312 209 67 Dinophyceae
Ceratium fusus 101690 23770 77000 67487 39822 59 Gyrodinium fusiforme 1600 17479 14474 62393 23986 26514 111 Heterocapsa triquetra 5000 4658 3040 7432 5032 1814 36 Prorocentrum compressum 15300 10689 19008 14999 4168 28 Prorocentrum micans 13091 13500 8570 12600 11940 2277 19 Protoperidinium bipes 4200 2110 6000 2304 3654 1826 50 Protoperidinium granii 22450 35000 30000 17760 26303 7684 29
Scrippsiella trochoidea 5237 5859 5548 440 8
Prymnesiophyceae
Emiliania huxleyi 180 200 145 268 198 52 26
Small flagellates 134 260 310 65 192 113 59
Total No of species counted in the sample
57 59 39 31
Table 7. Chlorophyll a (µg/L) data statistical summary
Station BLG RO RUS
1 7.53 8.08 7.53
1 7.13 7.85 6.11
1 7.97 10.19 7.92
Average 7.54 8.70 7.19
SD 0.42 1.29 0.95
CV% 5.6 14.8 13.3
2 0.61 0.68 0.46
2 0.61 0.72 0.59
2 0.61 0.68 0.38
Average 0.61 0.69 0.48
SD 0.00 0.02 0.15
CV% 0.00 3.06 30.41
3 6.33 6.24 4.18
3 6.32 6.29 3.82
3 6.86 6.84 4.71
Average 6.50 6.46 4.24
SD 0.31 0.33 0.45
422
assess, particularly when no standards or other reference methods exist. Obviously sophisticated statistical methods are not applicable to phytoplankton data, mainly due to the lower precision of microscopic analysis (HELCOM, 2003). Yet statistically valid targets for cell counts are still a major subject of standardization (European Commission, 2006). A 20% difference between the replicates analyzed by one and the same counter is considered acceptable measure of intra - laboratory reproducibility fitting also the null hypothesis for the differences among the participating labs (Rott et al., 2007), in other cases a confidence level within the average ± stdev, or a CV <20% was recommended (Lacouture, R., 2001) or observations that were outside the 90% confidence limit, were interpreted as outliers (Vuorio et al., 2010). In any case as suggested by Vuorio et al. (2007) the mean value obtained in inter-laboratory studies organized among proficient laboratories could be adopted as practical limits.
Conclusions
The results reported here reveal that for the total phytoplankton abundance the results between Bulgaria, Russia and Romania could be considered comparable at CV <20% while with Ukrainian lab at CV between 25-30%. For the total phytoplankton biomass there is a good agreement between Romania and Ukraine, about 20% difference between Bulgaria and all other labs and a 30% difference between Russia, Romania and Ukraine that should be taken into consideration if the data should be combined in a single data set. At the level of taxonomic classes the differences were substantial especially for Prymnesiophyceae and Small flagellates, e.g. these data should be treated with caution.
The result underline the importance of counting chamber and sub-sample volume accounting for the degree of species detection and the unification of species specific biovolume estimation for achieving comparable biomass results.
Furthermore a good knowledge of phytoplankton taxonomy is essential in order to correctly identify species; therefore in addition to the technical performance of phytoplankton enumeration ring-test for species identification would also prove necessary.
As a follow-up under FP7 Project UP-Grade Black Sea SCENE a taxonomically up-dated Black Sea phytoplankton species check - list with agreed geometric formulas has been developed and an automated system for biovolume calculation and phytoplankton data-base is in progress http://phyto.bss.ibss.org.ua/wiki/List_checked. A QC/QA guidelines were produced (Moncheva, 2010) that altogether offer opportunities for progress towards increasing the accuracy of phytoplankton measurements in the Black Sea region.
Acknowledgements
The research was partly supported by FP6 SESAME Project” Southern European Seas: Assessing and Modelling Ecosystem changes”, Contract No 036949 and FP7 UP-GRADE Black Sea SCENE Project” UP-GRADE Black Sea Scientific Network”, Contract No 226592
References
European Commission (EC) 2006. BS EN 15204: Water quality - Guidance standard on the enumeration of phytoplankton using inverted microscopy (Utermöhl technique): Brussels, 46 pp.
Jeffrey, S.W. and Humphrey, G.F. 1975. New Spectrophotometric equations for determining chlorophylls a, b, c1 and c2 in higher plants, algae, and natural phytoplankton. Biochem. Physiol. Planz., 167: 191-194.
Lacouture R.V. 2001. Quality Assurance Documentation Plan for the Phytoplankton Component of the Chesapeake Bay Water Quality Monitoring Program. The Academy of Natural Sciences’ Estuarine Research Centre, Maryland, 39 pp
Menden-Deuer, S. and Lessard, E.J. 2000. Carbon to volume relationships for dinoflagellates, diatoms and other protist plankton Limnol. Oceanogr., 45(3): 569– 579.
Moncheva, S. and Par, B. 2005 (updated-2010). Manual for Phytoplankton Sampling and Analysis in the Black Sea, GEF/UNDP Black Sea Ecosystem Recovery Project (BSERP)-RER/01/G33/A/1G/31, EC, FP7, Upgrade Black Sea Scene Project, Istanbul, 67 pp. Moncheva S. 2010. Guidelines for QC/QA of Biological
Data-Phytoplankton. Black Sea Commission/Upgrade Black Sea Scene Project, GA 226592, EC, FP7, http://documents.blacksea-commission.org/
Downloads/Guidlines-Phytoplankton-QC-QA.pdf (accessed February, 04, 2012) 18 pp.
Report of the ICES/OSPAR/HELCOM 2006. Steering Group on Quality Assurance of Biological measurements (STGQAB) ICES CM 2006/ACME:04. HELCOM 2003. Report on the HELCOM phytoplankton intercalibration. HELCOM Phytoplankton Expert Group
Rott, E., Salmaso, N. and Hoehn, E. 2007. Quality control of Utermohl-based phytoplankton counting and biovolume estimates-an easy task or a Gordian knot? Hydrobiologia, 578: 141–146
DOI 10.1007/s10750-006-0440-5
UNESCO, 1966. Determinations of photosynthetic pigments in seawater, Rep. SCOR/UNESCO WG 17, UNESCO Monogr. Oceanogr. Methodol., 1, Paris Vuorio, K., Lepistö, L. and Holopainen, A.L. 2007.
Intercalibrations of freshwater phytoplankton analysis. Boreal Environment Research, 12: 561-569