MURDOCH RESEARCH REPOSITORY
This is the author’s final version of the work, as accepted for publication following
peer review but without the publisher’s layout or pagination.
The definitive version is available at
Lee, K., Murray, D., Goodfield, D. and Anda, M. (2012)
Experiences and issues for environmental science sensor
network deployments. In: 6th IEEE International Conference on
Digital Ecosystem Technologies - Complex Environment
Engineering, 18 - 20 June, Campione d'Italia, Italy.
Copyright © 2012 IEEE
Personal use of this material is permitted. However, permission to reprint/republish
this material for advertising or promotional purposes or for creating new collective
Experiences and Issues for Environmental
Engineering Sensor Network Deployments
Kevin Lee
1, David Murray
1, David Goodfield
2, Martin Anda
21
School of Information Technology, Murdoch University,
Murdoch 6150, Western Australia, Australia
{
Kevin.Lee, D.Murray
}
@murdoch.edu.au
1
School of Environmental Science, Murdoch University,
Murdoch 6150, Western Australia, Australia
{
D.Goodfield, M.Anda
}
@murdoch.edu.au
Abstract—Sensor network research is a large and growing area of academic effort, examining technological and deployment is-sues in the area of environmental monitoring. These technologies are used by environmental engineers and scientists to monitor a multiplicity of environments and services, and, specific to this paper, energy and water supplied to the built environment. Although the technology is developed by Computer Science specialists, the use and deployment is traditionally performed by environmental engineers. This paper examines deployment from the perspectives of environmental engineers and scientists and asks what computer scientists can do to improve the process. The paper uses a case study to demonstrate the agile operation of WSNs within the Cloud Computing infrastructure, and thus the demand-driven, collaboration-intense paradigm of Digital Ecosystems in Complex Environments.
I. INTRODUCTION
Sensor Networks allow data to be collected from the physical world from a range of locations. This can include environmental data such as temperature, water consumption and waste, energy use, and any system requiring monitoring or measurement. The operation of these systems usually begins with sensors collecting data. This data is then transmitted to a gateway and from there to a back-end system for analysis. This aggregation of data and analysis on the back end can be used in applications such as, environmental monitoring [1], medical computing [2] and industrial automation [3].
Environmental Engineers are major users of sensor network technologies, as their domain is specifically about observing the environment. Subsequently, Environmental Engineers use sensors to observe the environment in order to design systems for the built environment. There are a large number of sensors and sensor networks that can measure the environment at points in time or over periods of observation. Temperature or air flow can be measured to observe buildings, water flow can be used to study the flow or flooding of rivers [4], measures of toxic gases in the air can be used to observe pollution levels and observing water movement can be used to model oil spills [5].
The development of cutting edge sensor network technolo-gies is primarily the domain of commercial and academic computer scientists. The sensor network side of this includes the development of low-cost sensors and low-power radios [6], special purpose Operating Systems such as TinyOS [7] and Contiki [8] and networking technologies including 6Low-PAN [9] and uIPv6 [10]. There is also development in spe-cialized middleware technologies such as OpenCOM [11], NesC [12], LooCI [13] allowing applications to be built efficiently, and high level application paradigms such as Kairos [14] and TinyDB [15].
There is currently a disconnect between Environmental Sci-entist’s and Computer SciSci-entist’s sensor network deployments. This is most obvious when these state-of-the-art technologies are not currently used by those performing deployments out-side the domain of Computer Science. Environmental Engi-neering sensor network deployments generally use commercial off the shelf technologies. This research demonstrates that these solutions do not take advantage of the miniaturization, reduced cost, increased deployability and increased energy efficiency of modern Computer Science approaches.
The paper attempts to identify the major areas of envi-ronmental science sensor network deployment that can be improved with the help of state-of-the-art Computer Science technologies. It highlights the range of advances in Sensor Networks that can be applied to Environmental Science de-ployments and how to improve them. It analyses Environmen-tal Engineering and Computer Science sensor network deploy-ments with a hope to stimulate discussion and interdisciplinary links between the two research areas.
II. BACKGROUND
There is active and ongoing research into the technologies and deployment of Sensor Networks. The goal of Wireless Sensor Network (WSN) research is to create low cost, low power, robust, self organizing networks. These attributes share many similarities with the Digital Ecosystem paradigm. These networks should be able to sense environmental conditions and transmit them for storage and processing. When deployed, the network should dynamically form links and routes to gateway devices. In the case of device failure, the network should be robust and automatically reorganize. Devices should require as little power as possible. As the size of solar, battery and electronics components are linked with the cost of each device, reducing power consumption is the primary goal of WSN research. Eventually, WSN nodes should be cheap enough to be considered consumable/expendable.
The research aims of power and cost reduction for WSN nodes cover a huge area within distributed systems research. It is, however, important to remain mindful that the use of wireless sensor networks is interdisciplinary, particularly with their broad application by Environmental Engineers and Scientists. WSNs are designed to provide structural monitoring of: building/equipment, health-care, energy. Perhaps one of the most broad applications is environmental monitoring of air, land and water. Clearly the most widely and keenly discussed applications are not in the domain of distributed systems or computer science. Many of the users of these networks will be technical specialists in non IT areas. This research examines a sensor network being used for environmental science research for measuring water and energy use in a specific built envi-ronment. It shows that the users of sensor networks are using off the shelf solutions that provide significantly less than the original design goals envisaged by wireless sensor networks.
Fault tolerance in Wireless Sensor Networks is provided through two mechanisms. Firstly, the cost of WSN devices means that devices can be destroyed or damaged without affecting the accuracy of data collection. Secondly, a large amount of effort [16], [17] in distributed systems research has focused on highly fault tolerant network stacks. WSN routing protocols are designed with fault tolerance and self-forming characteristics as primary goals which ensures that the failure of nodes will not alter the performance of the networks.
As distributed wireless sensor devices are numerous, there is a large amount of duplicated data and a large number of devices. The large number of sensor types now available allows the sensing of environmental characteristics that were previously infeasible to measure. On a very broad level, the large number of devices permit more location specific statistics. For example, the measurement of power usage of a building could be moved from a per building level, to a per office level. The measurement of harmful containments in the air can transition from a city-level to street level statistics.
In modern market based economies, services such as elec-tricity, water, gas are paid for on a usage basis, Australia has moved towards paying for carbon emissions on a production
basis [18]. Measuring and monitoring usage is clearly a prerequisite for reduction or more efficient use. The distributed nature of cheap, low cost sensor networks may be fundamental to achieving this, particularly in the area of carbon emissions. Another new application of small and low powered WSNs is the collection of physiological data. Stress levels, dehydration and exhaustion levels can all be approximated through the collection of physiological data. The constant and continuous measurement and analysis of such data could have a range of benefits. Exhausted or dehydrated workers in dangerous areas could be more easily identified. The detection of health problems could be hastened through continual monitoring of both healthy and unhealthy people. Visits to the doctor could include an analysis of the past years physiological data, as opposed to an analysis of a once off heart and lung check.
III. ENVIRONMENTALENGINEERINGSENSORNETWORKS
A. Overview
This Section describes the experiences of Environmental Engineers in the deployment of sensor networks for reducing carbon emissions.
B. Environmental Engineers and Scientists Sensors use The Environmental Science field depends heavily on sensor networks for measuring and monitoring a large range activities and systems. Response to global climate change requires the detailed monitoring and measurement of the many sources of carbon emissions from, for example, fossil fuelled energy production to the indirect emissions of landfill. Measurement is an essential prerequisite to reduction, evident in the statement “You can’t manage what you don’t measure.”
The built environment, generally regarded as responsible for 40% of global carbon emissions[19], is one example where de-ployment of sensors, to measure all direct and indirect sources of carbon emissions, is fundamental to the decision-making and management. This requires the full life cycle of buildings, from cradle to grave, including construction, operation and demolition. Materials, food, transport and other services are supplied to the built environment all have attributable carbon emissions. The sensors required to measure this, and to provide a fully integrated management system to effect a change response is a challenge. All too often improvements are lost due not providing the right information to management, in a form that can be appropriately acted upon and integrated within a smart, effective management and control system. The use of cheap distributed sensors and response equipment is essential to achieving effective results.
Environmental monitoring is increasingly being performed within buildings. In new commercial buildings, monitoring and control systems are, as a rule, included as a necessary part of the construction, however, in residential construction most such systems are generally retrofitted. In both cases the monitoring would include: water supply, use and disposal; and power use in Heating, Ventilation and Air Conditioning (HVAC).
Environmental Scientists use WSNs to observe and monitor phenomena in the natural environment. Building Scientists use WSNs to observe, monitor and control HVAC as well as energy and water systems in the built environment. Environ-mental Engineers use the data collected from natural and built environments to simulate and model systems for supporting human life and industry. Subsequently, Environmental Engi-neers will use WSNs for monitoring, control and evaluation of these systems during commissioning and ongoing operation in order to implement improvements in the future based on this new feedback data.
WSNs are paramount in buildings, precincts and industrial areas as the onward march to sustainability demands more complex integrated systems. These systems are now emerging as smart grids, distributed and embedded renewable energy generation, water harvesting and waste-water recycling, solid and liquid waste resource recovery reprocessing and distribu-tion back into energy and manufacturing complexes. Accord-ingly, they require monitoring, control and feedback beyond current Supervisory Control and Data Acquisition (SCADA) systems. WSNs support water, energy, waste, shelter, transport and food production systems and are able to provide the much needed real-time, interactive feedback required by Environ-mental Engineers for systems design and modelling.
C. Case Study: Carbon Neutral or Low Energy Village Infras-tructure Development
1) The Scenario: The reduction of carbon emissions from the full life cycle of the built environment is the subject of much research. A case study of an Australian mine site accom-modation village has been selected. The village can be treated as a gated community where all inputs and outputs can be measured, including carbon emissions of services installation and construction, village operational energy, to final energy required for demolition. The data obtained provides metrics for reduction on a wider scale and in alternative urban scenarios. Calculation of the carbon intensity, or carbon footprint, of the village is at the heart of this case study and measurement with the aid of a network of sensors has proven to be invaluable. Data collection at the time of writing is still in progress, as is the preliminary analysis, but it has become clear that closer collaboration with the IT Scientists could well have reduced the cost of deployment considerably, provided a broader data set and been more efficiently installed.
2) Technical: Water, in the mining village context, is expen-sive to manufacture in a reverse osmosis plant, and to monitor its use and disposal is essential, both in terms of the water use itself and the energy required to manufacture and pump it.
Electric power is manufactured by the mining company using a combination of diesel and gas turbines. Close monitoring of the major power circuits is also an essential prerequisite to effect meaningful changes in power management.
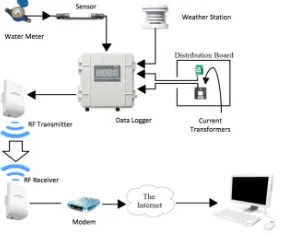
Fig. 1. Architecture of the Sensor Deployment at Mine Site Village
Commercial off-the-shelf sensors and data loggers were se-lected and deployed with the assistance of electrical engineers during the construction of the village; architecture in Figure 1, photos in Figure 2. Every 5 minutes, the sensors measure and transmit data via wired Ethernet to the data logger. The logger is connected by wired Ethernet to a radio transmitter which transmits periodically (once an hour) to a receiver connected to a modem. The data then travels via the Internet to be stored on the logger manufacturer’s facility, accessible via an IP address provided to the user.
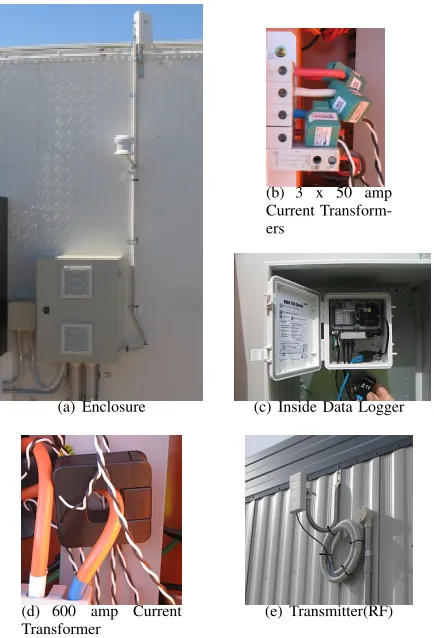
The current transformers in Figures 2(b) and 2(d) record the current applied to that specific circuit and via formula converted to a voltage stored in a csv. Excel spreadsheet file. All water data is recorded in volumes and using the pump specifications this can be converted to energy used. Hence the operational energy of all the monitored circuits within the village can be measured and studied. The load profiles of the energy consumed within are now available to support appropriate change for improved power management in the future. The affordability, reliability, flexibility, and accessibility of the installed monitoring system is, therefore, of paramount importance.
D. Summary
(a) Enclosure
(b) 3 x 50 amp Current Transform-ers
(c) Inside Data Logger
(d) 600 amp Current
Transformer
(e) Transmitter(RF)
Fig. 2. Sensor Deployment at Mine Site Village
Change comes with financial cost and the industry is fo-cused on maintaining and maximising its shareholder benefits. This reinforces the need for collaborations between Environ-mental and Computer Scientists in developing a) cost-effective ways of monitoring the built environment and b) smart ways of responding with environmental engineering solutions.
IV. COMPUTERSCIENCEAPPROACHES
A. Overview
Better communication between environmental engineers and computer scientists could lead to better outcomes for both groups. Environmental engineers would get more sophisticated products, capable of fine grained statistics at reduced cost. Computer science researchers would gain more application focus and fruitful research directions. This section discusses relevant technological advances, introduces a research WSN and discusses on how state-of-the-art WSN techniques may benefit environmental engineers.
B. Technologies
There is a rapid and ongoing improvement in the technolo-gies that support the deployment of sensor networks driven by new applications, mass production, miniaturisation and a de-sire for power reduction in a wide range of technologies. This has led to the development of modern compact sensors, low-power wireless networking, low low-power sensors and middleware
technologies. These, combined with advances in computing such as web services and Cloud Computing, enable advances in the area of sensor networks. The following discuss the most important areas of development.
802.15.4 was created specifically for the purpose of low power, low cost, wireless sensor networks. It can operate in unlicensed bands in the 2.4 GHz or 900 MHz band, offering data rates of approx 250 Kb/s. The amount of power consumed by the radio largely depends on the transmit power used. 802.15.4 radios can transmit using 1mW to 100mW of power. This can offer ranges from a few meters to 100 meters depending on required range. The goal of 6LowPAN is to provide Internet (IPv6) connectivity to very low power devices. It includes many important features such as including header compression, address auto-configuration. Autoconf enables nodes to obtain the network prefix from the network sink. Unique addresses by using 802.14.5 64 bit EUI.
Microcontroller technologies and especially low power, lim-ited resource microcontrollers have advanced rapidly in recent years. The Atmel AVR family of microprocessors in particular offer low power, low cost devices which can easily interface with a range of analogue and digital sensors.
Cloud Computing is the provision of generic computing services over the Internet. The fundamental characteristics of Cloud Computing include abstracted or virtualized resources, elastic resource capacity, programmable self-service interface and a pay-per-use pricing model. These characteristics make Cloud Computing attractive for providing processing and storage capability for sensor network deployments.
C. Architecture
To evaluate cutting-edge technologies that can be used to improve environmental engineering sensor network deploy-ments, an experimental Wireless Sensor Network Research platform was designed. This architecture uses the Atmel Ravens as WSN devices (See Figure 3(a)) which are prototype devices with power circuitry, ADCs and two low-power mi-crocontrollers. The Contiki embedded Operating System was used on the device with the Atmel ATmega1284P chip was used for the sensing, processing and transmission of data.
The Atmel Ravens use 802.15.4 and 6LoWPAN to obtain connectivity to the local edge node (See Figure 3(b)). This edge node was an AMD 500 MHz Geode embedded machine, which has 256 MB of RAM and runs the Voyage Linux OS from solid-state memory. It connects the Sensor network to the Internet using WiFi. This edge node receives the sensor nodes transmissions via its 802.15.4 interface and then inserts them into the MySQL database located in the cloud via a local WiFi access point. The use of a Cloud service to store the sensor data enables the data to be stored, retrieved and analysed by the users of the system.
(a) Flexible Generic Environ-mental Node
(b) Figure Generic Edge Node
Fig. 3. Flexible WSN Sensor and Edge Gateway
by EC2. A single instance of this AMI was instantiated on a standard machine type m1.large which has 4 64-bit EC2 Computer Units and 7.5GB of memory. No location preference was given for this or any of the EC2 instances used to ensure the availability of resources. Amazon CloudWatch was turned on to enable the collection of statistics from the instance.
D. Evaluation
This architecture is a typical modern approach to building and deploying sensor networks. This approach is application and sensor agnostic, deployable in a range of scenarios. En-vironmental sensor networks have to deal with large changes in data frequency depending on the environmental conditions. The technological improvements in terms of using lower power devices is a part of the general improvements in tech-nology. The other major difference with this approach is the use of Cloud Computing services as a backend for the sensor network. As such, it is important to evaluate if the Cloud can effectively load-balance when subjected to dynamic loads. The Amazon EC2 AutoScaling service was configured to increase or descrease the number of EC2 instances depending on the CPU utilization of the service. To simulate load, the HTTP load testing and benchmarking tool Siege (version 2.69) was used to provide a constant measured load. Siege can be configured to perform a set amount of concurrent requests to a server on a target machine. For this experiment, applied load was simulated by using HTTP requests to generate server-side computation. These loads were directed at the DNS of the load-balancer, which forwards the requests to EC2 instances. The load applied started at the level of 10 concurrent requests per second, then increased every 10 minutes over 80 minutes. The level of the load applied, the actual CPU usage on each instance, the number of instances available and transaction statistics were recorded. Figure 4 illustrates the number of Amazon compute units that are available at any point during the experiment. It shows that as load was increased (left y-axis), the number of instances made available (right y-axis) by the Auto Scaling service also increased to handle the load. The results show that, after the initial excessive load was applied, there was always enough capacity
Fig. 4. Number of Available Amazon Compute Units with Increasing Load Applied being Applied
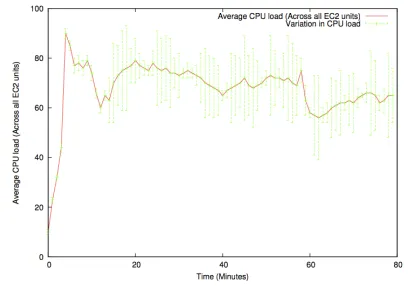
Fig. 5. Average CPU Usage on all amazon compute units over time
available for the load applied. Furthermore, the increase in resource availability closely matches that of the applied load. Figure 5 illustrates the average CPU usage on virtual machines as the load was increased. It shows that, after the initial increase in load, the auto scaling service successfully maintain balanced CPU usage across all available instances. The variance bars in Figure 5 show the fluctuating load between instances. The load balancer periodically increases and decreases load to different compute units.
This experiment illustrates that Cloud Computing services can be used to provide computation to support dynamic load in scenarios such as those used to process data collected by sen-sor networks. Furthermore, obtaining, configuring and utilising these resources is simple, straightforward and relatively cheap. Using standard web technologies and open pricing makes this a viable for accessing computation resources.
E. Benefits of the IT WSN approach
Another benefit is the flexibility that the cloud can provide through on-demand storage and computation. This can have two benefits. Firstly, computing power does not have to be purchased, but instead can be rented and expanded as required. Secondly, if the application being monitoring has dynamic computing requirements, the cloud may be the only feasible approach [20]. For example, under regular conditions, data may be stored normally. However, under an active flood, tsunami, or fire, the computational demands required may dramatically increase. These increase may be in terms of computation and analysis of data but also access volume re-quirements. The Cloud has the ability to expand computational capacity and bandwidth on a “pay for usage” basis.
F. Summary
This section has discussed the Computer Science approach to building sensor networks and tried to show how mod-ern state-of-the-art technologies apply. The typical goals of the domain are reduced size, cost, form-factor and energy consumption. It is hoped that improvements in solar panels, batteries, radio design and manufacturing will help facilitate this. Energy use can be heavily affected by network protocols such as routing, IPv6 addressing and transport layer design.
The Computer Science research deployment presents many benefits over commercial off the shelf solutions but many challenges still remain. At a higher level, access to storage, programming paradigms, and embedded operating systems all require further research. Despite a large body of research attempting to address these issues, it has not translated through to real world deployments. The discussed environmental sen-sor networks monitoring carbon footprints, have shown that common of the shelf technologies are significantly more primitive than simulated research might suggest. Furthermore, actual WSN testbeds, created by distributed systems specialists are lacking. There is currently a disconnect between what simulations claim are possible and what actual equipment can do.
V. CONCLUSIONS
This paper has discussed the issue of the interaction be-tween Environmental Engineers and Computer Scientists in the context of Environmental Sensor Networks. It has high-lighted the disconnect between the technologies being de-ployed by Environmental Engineers and the Computer Science researchers that develop the technologies. It has illustrated, through deployment case studies, the differences between practical deployment and research developments. It is hoped that highlighting these issues might aid in the collaboration between Environmental Engineers and Computer Science re-searchers in order to substantially improve the situation.
ACKNOWLEDGMENT
The authors would like to acknowledge the support of Ama-zon Web Services for providing Cloud Computing resources under their AWS in Education research grant scheme.
REFERENCES
[1] D. Hughes, P. Greenwood, G. Coulson, G. Blair, F. Pappenberger, P. Smith, and K. Beven. An experiment with reflective middleware to support grid-based flood monitoring. InConcurrency and Computation: Practice and Experience, vol. 20, no 11, November 2007, pp 1303-1316. [2] Stankovic J. A., Cao Q., Doan T., Fang L., He Z., Kiran R., Lin S., Son S., Stoleru R., and Wood A. Wireless sensor networks for in-home healthcare: Potential and challenges. Inin proc. of Workshop on High Confidence Medical Devices Software and Systems (HCMDSS), 2005. [3] Pohl A., Krumm H., Holland F., Stewing F. J., and Lueck I.
Service-orientation and flexible service binding in distributed automation and control systems, 2008.
[4] Paul Smith, Danny Hughes, Keith J. Beven, Philip Cross, Wlodek Tych, Geoff Coulson, and Gordon Blair. Towards the provision of site specific flood warnings using wireless sensor networks. In Meteorological Applications, Special Issue: Flood Forecasting and Warning, volume 16, number 1, pages 57–64, 2009.
[5] Faith Singer-Villalobos. Scientists produce 3-d models of bp oil spill in gulf of mexico using ranger supercomputer, univeristy of texas, http://www.utexas.edu/news/2010/06/03/tacc ranger oil spill/. June 2010.
[6] Alan Mainwaring, David Culler, Joseph Polastre, Robert Szewczyk, and John Anderson. Wireless sensor networks for habitat monitoring. In 1st ACM international workshop on Wireless sensor networks and applications, pages 88–97. ACM, 2002.
[7] Philip Levis, Sam Madden, Joseph Polastre, Robert Szewczyk, Alec Woo, David Gay, Jason Hill, Matt Welsh, Eric Brewer, and David Culler. Tinyos: An operating system for sensor networks. Inin Ambient Intelligence. Springer Verlag, 2004.
[8] A. Dunkels, B. Gr¨onvall, and T. Voigt. Contiki - a lightweight and flexible operating system for tiny networked sensors. InWorkshop on Embedded Networked Sensors, Tampa, Florida, USA, November 2004. [9] Jonathan W. Hui and David E. Culler. Extending ip to low-power, wireless personal area networks. Internet Computing, IEEE, 12(4):37– 45, July-Aug. 2008.
[10] Dogan Yazar and Adam Dunkels. Efficient Application Integration in IP-based Sensor Networks. InProceedings of ACM BuildSys 2009, the First ACM Workshop On Embedded Sensing Systems For Energy-Efficiency In Buildings, Berkeley, CA, USA, November 2009.
[11] G. Coulson, G. Blair, P. Grace, F. Taiani, A. Joolia, K. Lee, and J. Ueyama. A generic component model for building systems software. InACM Transactions on Computer Systems, Vol. 26, No. 1, 2008. [12] David Gay, Philip Levis, Robert von Behren, Matt Welsh, and Eric
Brewer. The nesc language: A holistic approach to networked embedded systems. In ACM SIGPLAN conference on Programming language design and implementation, pages 1–11. ACM, 2003.
[13] D. Hughes, K. Thoelen, W. Horre, N. Matthys, S. Michiels, C. Huygens, and W. Joosen. Looci: A loosely-coupled component infrastructure for networked embedded systems. In7th International Conference on Advances in Mobile Computing & Multimedia, Dec, 2008.
[14] Ramakrishna Gummadi et al. Kairos: a macro-programming system for wireless sensor networks. In Proceedings of the twentieth ACM symposium on Operating systems principles, pages 1–2, 2005. [15] Samuel R. Madden, Michael J. Franklin, Joseph M. Hellerstein, and
Wei Hong. Tinydb: an acquisitional query processing system for sensor networks. ACM Trans. Database Syst., 30(1):122–173, 2005. [16] Jinran Chen, Shubha Kher, and Arun Somani. Distributed fault detection
of wireless sensor networks. InProceedings of the 2006 workshop on Dependability issues in wireless ad hoc networks and sensor networks, DIWANS ’06, pages 65–72, New York, NY, USA, 2006. ACM. [17] Hai Liu, Amiya Nayak, and Ivan Stojmenovi. Fault-tolerant
algo-rithms/protocols in wireless sensor networks. In Guide to Wireless Sensor Networks, Computer Communications and Networks, pages 261– 291. Springer London, 2009.
[18] Commonwealth Government of Australia. Clean energy act and subse-quent amendments. 2011.
[19] UNEP. Common carbon metric: for measuring energy use & reporting greenhouse gas emissions from building operations. a United Nations Environment Program Sustainable Building Climate Initiative, 2009. [20] K. Lee, D. Murray, D. Hughes, and W. Joosen. Extending sensor