The Thirty-Third AAAI Conference on Artificial Intelligence (AAAI-19)
Text Assisted Insight Ranking Using Context-Aware Memory Network
Qi Zeng,
1∗Liangchen Luo,
2∗Wenhao Huang,
3†Yang Tang
21Stony Brook University2Peking University3Shanghai Discovering Investment 1[email protected]2{luolc,tangyang ty}@pku.edu.cn
Abstract
Extracting valuable facts or informative summaries from multi-dimensional tables, i.e. insight mining, is an impor-tant task in data analysis and business intelligence. However, ranking the importance of insights remains a challenging and unexplored task. The main challenge is that explicitly scoring an insight or giving it a rank requires a thorough understand-ing of the tables and costs a lot of manual efforts, which leads to the lack of available training data for the insight ranking problem. In this paper, we propose an insight ranking model that consists of two parts: A neural ranking model explores the data characteristics, such as the header semantics and the data statistical features, and a memory network model intro-duces table structure and context information into the ranking process. We also build a dataset with text assistance. Exper-imental results show that our approach largely improves the ranking precision as reported in multi evaluation metrics.
Introduction
Automatically extracting useful and appealing insights, i.e. the data mining results, from a multi-dimensional table is a challenging yet important task in the areas of Business In-telligence (BI), Data Mining, Table-to-Text Generation, etc. For example, we can derive the insight ”Sales of Brand A is increasing year over year while sales of Brand B is decreas-ing from 2015 to 2017 in China” from a multi-dimensional car sales table. In this work, insight is defined as a data structure that includes subspace, type, significance value, and description. It can be described in any forms for dif-ferent applications. In the whole process of automatic busi-ness data analysis, generating abundant insights from multi-dimensional structured data can be accomplished with elab-orate predefined rules, while modeling their usefulness or interestingness and ranking the top ones are much more dif-ficult. Handcrafted ranking rules are less efficient and can-not cover every possible situation, and therefore a learning method for insight ranking is worth studying.
∗
Equal contribution.
†
This work was initiated and completed at the Software Ana-lytics group of Microsoft Research Asia when the third author was full-time employee researcher and all the other authors were re-search interns of the group.
Copyright c⃝2019, Association for the Advancement of Artificial Intelligence (www.aaai.org). All rights reserved.
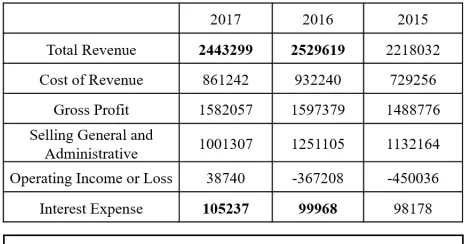
Figure 1: Example of a table and its corresponding descrip-tion text in an annual report.
Previously effort has been made to explore how to extract insights according to its statistical significance score (Tang et al. 2017). However, statistical significance has some lim-itation in insight importance ranking. First, as its scoring method suggests, it neglects the semantics of the data (such as the horizontal and vertical headers in the bi-dimensional table), which is proved to greatly contribute to the impor-tance of data in our later experiments. As a result, insights that have a higher preference in real-world data are possi-ble to get less attention. For example, in financial reports a statistically significant increase of “Operating Income” usu-ally enjoys less popularity than that of a more common item “Total Revenue”, as shown in Figure 1, but is possible to get a higher statistical significance score. Besides, the signifi-cance values of insights in different types are incomparable. It is inaccurate to rank an insight of trend (shape insight) and an insight of outliers (point insight) according to their significant values since the two significant values have their own statistical meanings under different statistical hypothe-sis and measurements. Also, the statistical analyhypothe-sis method is unsuited for small tables since it requires a minimum num-ber of data points to calculate the statistical significance.
knowl-edge and a thorough understanding of the table and context which is difficult and time-consuming. To address this prob-lem, we take advantage of the human written table descrip-tions and analytical text, and use the text as ”weak supervi-sion” signals to learn an insight ranking model. Such texts involve latent prior common knowledge and domain knowl-edge and provide valuable information on what insights are more important and are more likely to be mentioned. To our best knowledge, this is the first work to explore the ranking problem of the insights with the assistance of text.
The importance of an insight can be measured in many di-mensions. We find that the semantics information of insights contributes to its importance measuring. The advantage of introducing it into the ranking model is that it provides the meaning to a cell of number, and the context of the data ap-plication. Moreover, it breaks the limitation to table struc-ture, as tables in any form and of any size can be universally represented as a list of labels and values. Inspired by this, in this paper we focus on ranking the insights by capturing both the semantic features and statistical characteristics of the data. In addition, the global table context, such as table structure and the relationship among all the insights, should also be taken into consideration. For example, a year-over-year decreasing insight is more valuable than an increasing insight when all the other data are of increasing trends.
The challenges are three-fold. First, despite its prospect, there is no existing available dataset and no annotated insight importance labels for ranking models. Second, it is hard to model the interestingness of insights as it can be measured in many dimensions. Both the content relevance and the sta-tistical significance of insight need exploration. Third, the comparison or ranking process among insights should be done in groups. For a fair comparison, insights within one ta-ble should be compared in one group since they are closely related inherently. Therefore, the table context needs to be introduced as external information to enable the comparison of relative interestingness values in a ranking model.
To overcome the above limitations, we present a text-assisted ranking model with header semantics and a global context-aware memory component. We estimate the impor-tance of an insight according to its probability of being in-terpreted in the description text and feed the score into the ranking model. The ranking model consists of two parts. The neural ranking model explores the data characteristics, such as its semantics and statistics information simultane-ously. The key-value memory network model introduces ta-ble structure information into the ranking process. The ex-periment results on two datasets demonstrate that our model achieves significant progress compared with baselines.
In summary, our contributions are as follows:
• We formally formulate the problem of text assisted insight ranking, which has not been fully investigated yet.
• We construct a new financial dataset, in which we labeled the insight importance with text assistance.
• We propose a context-aware memory network to model the importance of insights. The experimental results on two datasets show that our approach significantly outper-forms the baseline methods.
Related Work
Insight Ranking
Earlier works have explored the insight importance evalua-tion problem. Notice that the insight has different names in different studies. A broader definition of the interestingness of insights, or data mining results, is conciseness, coverage, reliability, peculiarity, diversity, novelty, surprisingness, util-ity, and actionability (Geng and Hamilton 2006).
Tang et al. (2017) proposes that the insight score should be applicable to and fair across different types of insight. The insight score function in their paper measures the mar-ket share and the p-value based uncommonness significance score. In their work, different insights follow different dis-tribution and have different null hypothesis. We argue that such statistical methods do not satisfy the comparability re-quirement of insight importance score.
Demiralp et al. (2017) also uses predefined strength met-rics for each kind of insights, such as the Pearson corre-lation coefficient for linear recorre-lationship insight, the num-ber of outliers for outliers insight, and standardized skew-ness coefficient for skew insight. More previous works in data exploration and data mining areas measure the in-sight importance by how surprising that value is different from the expectation (Wu, Sismanis, and Reinwald 2007; Sarawagi, Agrawal, and Megiddo 1998). User preference is also taken into account in the area of interactive data explo-ration (Wasay, Athanassoulis, and Idreos 2015; Dimitriadou, Papaemmanouil, and Diao 2016; C¸ etintemel et al. 2013). Different from their work, we introduce header semantics and table context into the insight ranking process.
In the task of table-to-text generation in Natural Lan-guage Processing (NLP), the generation process is divided into three modules, content planning, sentence planning, and surface realization (Sha et al. 2018; Lebret, Grangier, and Auli 2016; Mei, Bansal, and Walter 2016; Liu et al. 2018). Similar to our insight ranking problem, the content planning module is required to decide which parts of the input table should be paid attention to. The difference is that the selec-tion process is not explicitly formulated as a ranking prob-lem that assigns each candidate a significance score.
Learning to Rank
The aforementioned insight importance ranking methods are mostly based on handcrafted rules, different from which our approach applies the “learning to rank” method in machine learning.
the evaluation metrics of the ranking results. The list-wise method scores the candidates within a list together and di-rectly optimizes the evaluation metrics (Pareek and Raviku-mar 2014; Cao et al. 2007; Burges, Ragno, and Le 2006; Xu and Li 2007; Taylor et al. 2008; Burges 2010).
Problem Formulation
Insight
DEFINITION1 (MULTI-DIMENSIONALTABLE).A multi dimensional table is defined as the set of data cells, i.e.
T = ⟨C1,· · ·, Cc⟩. Each data cell Ci is represented as Ci=
⟨
Dim1,· · ·, Dimd, V al⟩
, whereDimiis one
dimen-sion in a table,dis the total number of dimensions in a table, andV alis the value.
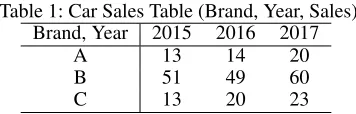
For example, table 1 is a bi-dimensional table with di-mensionBrandandYear. For the cell in the up left corner,
C1=⟨
Dim1=A, Dim2= 2015, V al= 13⟩ .
Table 1: Car Sales Table (Brand, Year, Sales) Brand, Year 2015 2016 2017
A 13 14 20
B 51 49 60
C 13 20 23
DEFINITION2 (SUBSPACE). Asubspaceis defined as a set of cells thatS =⟨C1,· · · , Cn⟩, in which at least one
dimension of the cells in the subset is the same:
∀S=⟨C1,· · ·, Cn⟩,∃ks.t.Dimk1=· · ·=Dim k n, (1)
wherenis the number of cells in the subspace, andDimk i is
thek-th dimension in each cellCi.
In table 1, a subspaceS=⟨C1, C2, C3⟩consists of:
C1=⟨Dim1=A, Dim2= 2015, V al= 13⟩
C2=⟨Dim1=A, Dim2= 2016, V al= 14⟩
C3=⟨
Dim1=A, Dim2= 2017, V al= 20⟩ (2)
where the cells share the same dimensionDim1 =A. The
subspace is usually formed when we fixed some dimensions of the table and enumerate the combination of other chosen dimensions. The subspace usually has a particular meaning when selected. In the example, the subspaceSrepresents the sales of Brand A over years.
For each subspace, we can perform statistical test with specific hypothesis. The hypothesis is defined by insight typeTwhich includes summary statistics, correlations, out-liers, empirical distributions, density functions, clusters, and so on (Demiralp et al. 2017). Under the statistical hypoth-esis of insight type T, we can calculate the statistical sig-nificance valueV. If the significance value exceeds a pre-defined threshold, it is considered as an informative obser-vation from the table, and we can generate adescriptionD
from the header semantics for each dimension using some predefined templates, such as “Sales of A is increasing from 2015 to 2017.” in the example subspace we give in table 1.
Formally, we define the above elements as the insight:
Table 2: Example of an insight
Subspace <A,2015>,<A,2016>,<A,2017> Insight Type Tread Increasing
Significance Value 0.5
Description Sales of A is increasing year over year.
DEFINITION 3 (INSIGHT). An insight Ii is defined as
four partsIi= (Si, Ti, Vi, Di), whereSiis the subspace,Ti
is the insight type,Viis the significance value, andDiis the
corresponding description.
Table 2 is an example of an insight extracted from Table 1.
Text-Assisted Insight Ranking
From a multi-dimensional table, we can derive a great many insights as informative observations especially when the ta-ble has many dimensions. However, people will only pay at-tention to several important insights, which requires insight ranking. As introduced, it is difficult to explicitly calculate the importance of an insight directly. And human written ta-ble description and analysis text provide valuata-ble informa-tion about what insights are more likely to be worth analyz-ing and which are not.
In this study, we use the assistance of the description text corresponding to a table. Suppose the description is a set of sentences ⟨s1, s2,· · · , sm⟩. For each insight Ii, we can
calculate the similarity between the descriptionDifrom the
insight and each sentence in the text by a similarity func-tion Sim(Di, sj), and find the most similar sentence sk.
When the similarity score is higher than a certain thresh-old, we can assume that human writer does mention that insight in the text, and correspondingly, the similar human written sentence is an expression of the insight. As a re-sult, the semantic similarity score Sim(Di, sk) represents
the possibility of an insight’s being mentioned in the text, which further represents its importance or interestingness. The similaritySim(Di, sk)can be seen as a ”week
super-vision” of how likely the insight will be interpreted by peo-ple in the corresponding text. Therefore, given an insight set
I =⟨I1, I2,· · ·, In⟩, we can get the rank of those insights
by the similarity score as⟨R1, R2,· · ·, Rn⟩.
DEFINITION4 (INSIGHTRANKING).Given a set of in-sightsIfrom a table, we learn aranking functionF
F:Ii→Rˆi
s.t.min
n
∑
i=1
L(Ri−Rˆi)
(3)
whereRˆiis the rank of insightifrom the ranking function,
andLis a list-wise loss function.
In order to compare all the insights from the same table together, we build our ranking function according to the list-wise ranking method in (Cao et al. 2007).
Model
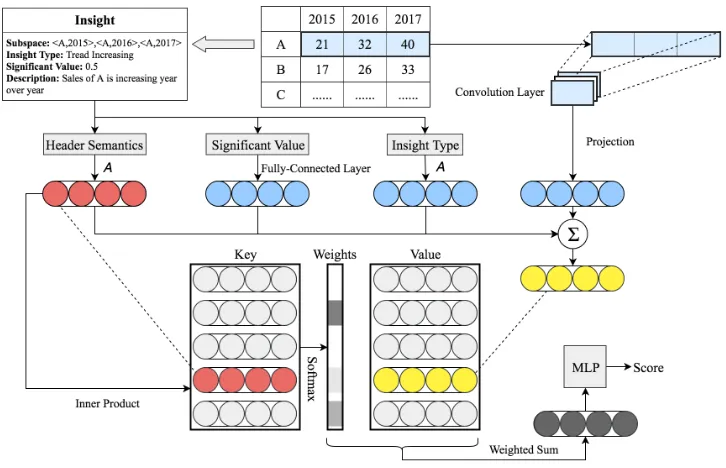
Figure 2: Framework of the proposed ranking model.
statistic information and subspace, and assigns importance scores to each insight. Additionally, the key-value memory network model introduces other insights within one group, namely the table context, into the ranking process.
Insight Representation
We represent the insight with a vector of fixed sized. Four kinds of insight features are encoded in different ways into vectors with the same vector lengthd.
Significance valuefsig:The significant score is
embed-ded into a vector with a fully-connected layer.
Insight Typeftype:We treat each insight type as a
spe-cial word token and encode them using the same embedding matrixAused in header semantics representation.
Subspacefsubspace: The cells in a subspace is
consid-ered as a sequence of continuous cell values along with their shared dimension. The sequenceC is then processed by a single-layer CNN to form the subspace representation. The CNN regardsCas an input channel, and alternates convolu-tion operaconvolu-tion.
Suppose thatz(f) denotes the output of feature maps of channel-f. On the convolution layer, we employ a 1D con-volution operation with a window sizer, and definez(f)as:
z(f)=σ(
r
∑
t=0
Wt(f)·Ct+b(f)), (4)
whereσ(·)is a tanh,W(f) ∈ ℜrandb(f)are parameters.
The output of the feature maps are projected to a vector
fsubspaceof dimensiondwith a linear transformation.
Semanticsfsemantics:The semantics of an insight is
ex-pressed as the concatenation of all headers of the cells in a insight subspace, which produces a sequence of word tokens
x= [w1,· · · , wh], (5)
wherehis the length of the headers. Then the distributed se-mantics representationsis defined as a bag-of-words using the embedding matrixA:
fsemantics=AΦ(x), (6)
whereΦ(·)maps the tokens to a bag of dimensionV (the vocabulary size), andAis ad×V matrix.
Finally, the feature of an insight is represented by sum-ming up the four features:
I=fsig+ftype+fsubspace+fsemantics. (7)
Key-Value Memory Network
Our intuition is to introduce the table context such as table structure and the relations between insights in the same table into the ranking model. We represent the table as a set of insights extracted from the table.
Since the insights are not naturally expressed as sorted se-quence, a memory-like framework is more appropriate than structure-sensitive models such as RNN and CNN. Assum-ing that relation between insights can be revealed by their header semantics, we apply a key-value memory network (KV-MemNN) (Miller et al. 2016) to search semantically similar insights for each insight candidate.
We define the memory slots as a vector of pairs
m= [(s1, I1),· · ·,(sM, IM)], (8)
where there are M related insights, Ik is the k-th insight
andsk is the semantic vector of insightIk. We denote the
semantic of current insight as queryq. The key addressing and reading of the memory involves the following two steps. Key Addressing:During addressing, we perform a self-attention operation by computing the inner product between
qand the memory keys followed by a softmax:
which yields a vector of attention weights over the semantics of related insights.
Value Reading: In the reading step, the values of the memories (insight representations) are read by taking their weighted sum using the addressing attentions, and the mem-ory output vectorois returned as:
o=∑
k
αkIk, (10)
The final insight representation o will be an input of the ranking model described in the next section.
Since the representation of the insight itself is also con-tained in the memory, it will definitely produce very high attention to address the insight self. We do not concatenate the output of the memory with other feature vectors as the other memory network often does.
Ranking Model
The model is implemented as a multi-layer perceptron (MLP) which receives insight representations and outputs the ranking scores of the insights.
The model is trained by minimizing the L2 lossJ(γ)of the output scores and the similarity scores of the insights:
scorem= MLP(o),
J(γ) = 1
2∥scorem−scores∥
2 2,
(11)
where scorem and scores are the model outputs and
ground-truth scores, respectively. We apply the list-wise ap-proach and sums up the total losses of the insights in the same table, as the total loss relies on the table context. For the baseline models without the memory network, we apply the point-wise approach and calculate the L2 loss for each insight as a training sample.
Dataset
Financial Report Dataset
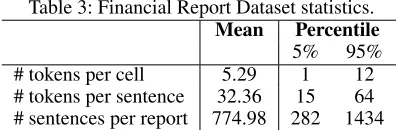
The financial report dataset is built upon the public annual and quarterly reports from United States Securities and Ex-change Commission1. The dataset contains in total 5,670 re-ports and 49,129 tables from 2,762 companies. Table 3 sum-marizes the data statistics. In the experiment, we randomly split the dataset into training, validation, and test sets con-sisting of 60%, 20%, and 20% summaries, respectively.
We filtered the sentences out that are less than 50 charac-ters or 10 words, and those do not include any numbers or keywords. Year information is substituted with “this year”, “last year”, and so on. More detailed date information is deleted as we only consider annual report. Special tokens are also processed to avoid noise.
SBNation Dataset
To validate the generality of our model, we also evaluate the effectiveness of our model on SBNation Dataset from (Wiseman, Shieber, and Rush 2017). This dataset consists
1
https://www.sec.gov/edgar/searchedgar/companysearch.html
Table 3: Financial Report Dataset statistics. Mean Percentile
5% 95% # tokens per cell 5.29 1 12 # tokens per sentence 32.36 15 64 # sentences per report 774.98 282 1434
of 10,903 human-written NBA basketball game summaries aligned with their corresponding box-scores and line-scores. We randomly split the dataset into training, validation, and test sets consisting of 60%, 20%, and 20% summaries.
Insight Extraction
We defined two representative types of insight in this work: • Point insight:we measure how outstanding the data point
is among all the data points in the subspace.
• Shape insight (trend): we detect the rising or falling trend among a series of data points.
In the financial dataset, the “point” is defined as the change ratio of one item from the current year to last year in the point insight. The “trend” is defined as the increasing or decreasing trend year-over-year in the shape insight.
In the SBNation dataset, we only extract the point insight. The “point” is defined as the one of the game statistic such as scores, rebounds and assistants of a player.
The significance score of each insight type is calculated with the same approach described in (Tang et al. 2017).
Similarity Function
We propose two similarity functions here, Sims and
Sims+h, and select the better one by human evaluation.
First, we count same words in the insight descriptiondi
and the human written sentencesj:
Sims(di, sj) =
Count2(di, sj)
|di| · |sj|
(12)
whereCount(di, sj)is the count of same words,| ∗ |
repre-sents the length of∗.
To assign more weights to the words in the headers, we calculate the similarity of a headerhiand a sentencesj:
Simh(hi, sj) =
Count(hi, sj)
|hi|
· Count(hi, sj) maxn
k=1{Count(hk, sj)}
(13) where Count(hi,sj)
|hi| represents the percentage of the number
of words matched in the header, and Count(hi,sj) maxn
i=1{Count(hk,sj)}is
the normalization factor.
We add the similarity of headers to the similarity of sen-tences to construct the second similarity function:
Sims+h(·) =α1Simsent(·) +α2Simh(·) (14)
whereα1andα2are the weights. In this paper, we set them
both to0.5.
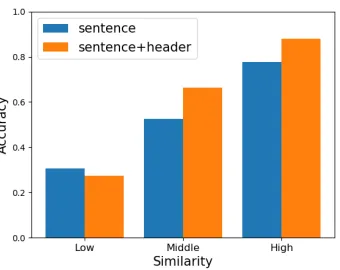
Figure 3: Accuracy of the text assistance method.
Text Assistance
To test the effectiveness of the text assistance method, we randomly sample 4,000 pairs of insights and their most sim-ilar sentences in the reports, and ask 10 human annotators who are familiar with financial reports to label whether the pairs are of the same meaning. The evaluation data is equally split into three groups according to their similarity scores.
As shown in figure 3, for both similarity functions, the higher similarity is the higher accuracy of their having the same meaning is. Therefore we can use the similarity score as the ground truth of the insight importance.
In addition, we find that Sims+h performs better than
Sims. It obtains nearly90% accuracy for the high
similar-ity group. The reason is thatSims+hemphasizes the
head-ers explicitly compared to theSims. For the low similarity
group, the accuracy of the similarity function with headers is lower than that with sentences, which indicates that the similarity function with headers is more distinguishable.
According to the human evaluation, in the later experi-ments we will useSims+has the similarity function.
Experiment
Experiment Settings
Based on the performance on the validation set, we set the embedding size to64for the baseline methods and the pro-posed model. The vocabulary sizes in the financial report dataset and the SBNation dataset are 8,409 and 900, respec-tively.
The parameters are updated by Adam algorithm (Kingma and Ba 2014) on a single 1080 Ti GPU and initialized by sampling from the uniform distribution ([−0.1,0.1]). The initial learning rate is0.0003. The model is trained in mini-batches with a batch size of1.
Evaluation Metrics
We report the ranking accuracy in three evaluation metrics: Mean Average Precision(mAP)@k, Normalized Discounted Cumulative Gain(NDCG)@k, and Precision@k.
Comparing Methods
We first compare three significant score calculation meth-ods. The detailed calculation methods follow the definition
of point insight and shape insight in (Tang et al. 2017).
• Sigtablecalculates the significance from the data
distri-butions in one table. It represents the insight importance when the insights are compared to other insights in the same table.
• Sigdatasetcalculates the significance from the data
dis-tributions in all tables. We assume that all tables are in-herently related to each other.
• Sigclusterfirst clusters the subspaces of all the insights
in the dataset using the word embedding of the headers, then calculate the significance score of the data distribu-tions in one cluster. We employ the K-Means method for clustering, andkis set to7for the best performance.
We also implement the Text Assisted Ranking (TAR) model with different components.
• T ARcnn adds the CNN to capture more statistical
fea-tures in addition to the basic insight significance and in-sight type features.
• T ARsemantics adds the table header as semantics
in-formation to the input in addition to theT ARcnn.
• T ARmemory adds the memory component to the
T ARsemanticsto introduce the table context and
rela-tions among the insights.
Experiment Results and Analysis
Financial Report Dataset Evaluation results on financial report dataset are shown in Table 4. In general, our pro-posed method achieves the best overall performance, which demonstrates its ability to fully explore the insight charac-teristics and modeling the insight importance.
We first compare the three baseline methods, Sigtable, SigdatasetandSigcluster, which calculate the significance
scores in different ways. The performance of Sigdatasetis
slightly better than that of Sigtable, as the former method
calculate the significance with a much larger space of data points. The comparison result also supports our assump-tion that the statistical significance score method does not suit for small tables, as the significance score is unreliable while there are only very few insights from a table. The cluster method Sigcluster achieves the best result, which
demonstrates the importance of the header semantics since it is the clustering rule. According to the result, we use the
Sigclusteras significance score in theT ARmodels.
A series of incremental experiments are conducted to evaluate the contributions of the key components in our pro-posed model. Three versions ofT AR model in incremen-tal sequence, T ARcnn, T ARsemantics and T ARmemory,
are provided. T ARcnn is a basic version that explores
the insight type, the significance score and the subspace of insights. By introducing the subspace information, the
T ARcnn model is exposed to more available information
on the statistical data distribution instead of a single signifi-cance score, and slightly improves the ranking performance. Comparing to the gap betweenT ARcnn andSigcluster,
the improvement between T ARcnn and T ARsemantics is
Table 4: Evaluation results on financial report dataset.
Precision@1 Precision@3 Precision@5 mAP@3 mAP@5 NDCG@3 NDCG@5
Sigtable 0.098 0.246 0.399 0.474 0.624 0.646 0.688
Sigdataset 0.107 0.249 0.408 0.473 0.621 0.649 0.692
Sigcluster 0.110 0.261 0.416 0.481 0.632 0.658 0.703
T ARcnn 0.118 0.278 0.444 0.525 0.686 0.738 0.757
T ARsemantics 0.162 0.411 0.605 0.668 0.756 0.799 0.815
T ARmemory 0.170 0.425 0.626 0.684 0.772 0.812 0.829
Table 5: Human evaluation of top-k Precision. Precision@1 Precision@3 Precision@5
Sigcluster 0.727 0.629 0.540
T ARmemory 0.886 0.813 0.745
Table 6: Top-k Precision on SBNation dataset. Precision@1 Precision@3
Sigcluster 0.503 0.513
T ARsemantics 0.788 0.754
T ARmemory 0.797 0.759
an important factor when we determine the importance value of an insight. Explicitly introducing the semantics largely enriches the insight representation space and improve the ranking performance significantly.
TheT ARmemorymodel, the complete version of our
pro-posed model, achieves the best performance in all evaluation metrics. Compared with T ARsemantics, the T ARmemory
introduces the related insight information within one group for comparison. The result supports our assumption that global table context and grouped insight relationship make a contribution to the process of insight ranking.
Human Evaluation We randomly sample 400 tables and ask the human experts to determine if the top-k insights and their most similar descriptions in the report are of the same meanings. The result in Table 5 implies that the recommen-dations of the insights according to our ranking model are of high accuracy and reliability.
SBNation Dataset The experimental result on SBNation dataset is shown in Table 6. Different from the annual fi-nancial report dataset, the description in SBNation is much more rigid and lacks variation. Therefore we consider la-bel matched sentences as the target, and mark insight im-portance as 0-or-1, either relevant or irrelevant, rather than continuous 0-to-1 values. NDCG and mAP cannot adapt to such labels in ranking problems. The valuekin Precision@k is set to 1 and 3, as the tables in SBNation are relatively smaller and most of them contain only 3 to 4 insights. Simi-lar to the results in financial report dataset, theT ARmemory
achieves the best performance.
Case Study
We present a ranking result example in Table 7. It consists of the top5insights in10insight candidates from one table.
Table 7: Case Study
Insight Descriptions Gold TAR
Collaboration and license revenue was 71.7 1 2 million for the year ended, an increase of
58.7 million compared to the year ended.
General and administrative expenses were 2 4 27.8 million for the year ended, an increase
of 18.8 million compared to the year ended.
Research and development expenses were 3 1 58.6 million for the year ended, an increase
of 35.1 million compared to the year ended.
We had 111 full-time employees including 4 9 82 employees engaged in development.
The net valuation allowance increased by 5 3 4.9 million and 0.6 million respectively.
The Precision@5 is0.8, a relatively high accuracy. The more detailed relative position of the top 5 insights is of less usefulness. Because the target ranking results only represent the probability of the insight’s being in the text, and the im-portance of the top 5 insights are of little distinction.
The reason why the fourth insight is wrongly labeled is that the similarity score is incorrectly calculated and the gold standard is in fact inaccurate. We analyzed the in-sight description and found that the sentence is coincidently matched with a wrong insight because it contains some key-words in the headers and similar numbers. This serves as an example of the optimization direction of the text assisted ap-proach. We would like to solve this problem by introducing the position of the sentence to the text assistance to derive more accurate similarity function.
Conclusion
In this paper, we propose a context-aware memory network to rank the insight importance. The model explores the data characteristics and introduces table structure and semantics information into the ranking process. We construct a finan-cial report dataset, in which the insight interestingness in-ferred from the human written description is used as anno-tated training data. Experimental results show that our ap-proach largely improves the ranking precision.
References
Burges, C. J. C.; Shaked, T.; Renshaw, E.; Lazier, A.; Deeds, M.; Hamilton, N.; and Hullender, G. N. 2005. Learning to rank using gradient descent. InMachine Learning, Proceed-ings of the Twenty-Second International Conference (ICML 2005), Bonn, Germany, August 7-11, 2005, 89–96.
Burges, C. J. C.; Ragno, R.; and Le, Q. V. 2006. Learn-ing to rank with nonsmooth cost functions. InAdvances in Neural Information Processing Systems 19, Proceedings of the Twentieth Annual Conference on Neural Information Processing Systems, Vancouver, British Columbia, Canada, December 4-7, 2006, 193–200.
Burges, C. J. 2010. From ranknet to lambdarank to lamb-damart: An overview.Learning11(23-581):81.
Cao, Z.; Qin, T.; Liu, T.; Tsai, M.; and Li, H. 2007. Learn-ing to rank: from pairwise approach to listwise approach. In
Machine Learning, Proceedings of the Twenty-Fourth Inter-national Conference (ICML 2007), Corvallis, Oregon, USA, June 20-24, 2007, 129–136.
C¸ etintemel, U.; Cherniack, M.; DeBrabant, J.; Diao, Y.; Dimitriadou, K.; Kalinin, A.; Papaemmanouil, O.; and Zdonik, S. B. 2013. Query steering for interactive data exploration. InCIDR 2013, Sixth Biennial Conference on Innovative Data Systems Research, Asilomar, CA, USA, Jan-uary 6-9, 2013, Online Proceedings.
Cossock, D., and Zhang, T. 2006. Subset ranking using regression. InLearning Theory, 19th Annual Conference on Learning Theory, COLT 2006, Pittsburgh, PA, USA, June 22-25, 2006, Proceedings, 605–619.
Demiralp, C¸ .; Haas, P. J.; Parthasarathy, S.; and Pedapati, T. 2017. Foresight: Rapid data exploration through guideposts.
CoRRabs/1709.10513.
Dimitriadou, K.; Papaemmanouil, O.; and Diao, Y. 2016. AIDE: an active learning-based approach for interactive data exploration. IEEE Trans. Knowl. Data Eng.28(11):2842– 2856.
Freund, Y.; Iyer, R. D.; Schapire, R. E.; and Singer, Y. 2003. An efficient boosting algorithm for combining preferences.
Journal of Machine Learning Research4:933–969.
Geng, L., and Hamilton, H. J. 2006. Interestingness measures for data mining: A survey. ACM Comput. Surv.
38(3):9.
Kingma, D. P., and Ba, J. 2014. Adam: A method for stochastic optimization.CoRRabs/1412.6980.
Lebret, R.; Grangier, D.; and Auli, M. 2016. Neural text generation from structured data with application to the biog-raphy domain. 1203–1213.
Li, P.; Burges, C. J. C.; and Wu, Q. 2007. Mcrank: Learn-ing to rank usLearn-ing multiple classification and gradient boost-ing. InAdvances in Neural Information Processing Systems 20, Proceedings of the Twenty-First Annual Conference on Neural Information Processing Systems, Vancouver, British Columbia, Canada, December 3-6, 2007, 897–904. Liu, T.; Wang, K.; Sha, L.; Chang, B.; and Sui, Z. 2018. Table-to-text generation by structure-aware seq2seq learn-ing.
Mei, H.; Bansal, M.; and Walter, M. R. 2016. What to talk about and how? selective generation using lstms with coarse-to-fine alignment. 720–730.
Miller, A. H.; Fisch, A.; Dodge, J.; Karimi, A.; Bordes, A.; and Weston, J. 2016. Key-value memory networks for di-rectly reading documents. InProceedings of the 2016 Con-ference on Empirical Methods in Natural Language Pro-cessing, EMNLP 2016, Austin, Texas, USA, November 1-4, 2016, 1400–1409.
Pareek, H. H., and Ravikumar, P. 2014. A representation theory for ranking functions. InAdvances in Neural Infor-mation Processing Systems 27: Annual Conference on Neu-ral Information Processing Systems 2014, December 8-13 2014, Montreal, Quebec, Canada, 361–369.
Sarawagi, S.; Agrawal, R.; and Megiddo, N. 1998. Discovery-driven exploration of OLAP data cubes. In Ad-vances in Database Technology - EDBT’98, 6th Interna-tional Conference on Extending Database Technology, Va-lencia, Spain, March 23-27, 1998, Proceedings, 168–182. Sha, L.; Mou, L.; Liu, T.; Poupart, P.; Li, S.; Chang, B.; and Sui, Z. 2018. Order-planning neural text generation from structured data.
Tang, B.; Han, S.; Yiu, M. L.; Ding, R.; and Zhang, D. 2017. Extracting top-k insights from multi-dimensional data. In
Proceedings of the 2017 ACM International Conference on Management of Data, SIGMOD Conference 2017, Chicago, IL, USA, May 14-19, 2017, 1509–1524.
Taylor, M. J.; Guiver, J.; Robertson, S.; and Minka, T. 2008. Softrank: optimizing non-smooth rank metrics. In Proceed-ings of the International Conference on Web Search and Web Data Mining, WSDM 2008, Palo Alto, California, USA, February 11-12, 2008, 77–86.
Tsai, M.; Liu, T.; Qin, T.; Chen, H.; and Ma, W. 2007. Frank: a ranking method with fidelity loss. InSIGIR 2007: Proceedings of the 30th Annual International ACM SIGIR Conference on Research and Development in Information Retrieval, Amsterdam, The Netherlands, July 23-27, 2007, 383–390.
Wasay, A.; Athanassoulis, M.; and Idreos, S. 2015. Querios-ity: Automated data exploration. In2015 IEEE International Congress on Big Data, New York City, NY, USA, June 27 -July 2, 2015, 716–719.
Wiseman, S.; Shieber, S. M.; and Rush, A. M. 2017. Chal-lenges in data-to-document generation. In Proceedings of the 2017 Conference on Empirical Methods in Natural Lan-guage Processing, EMNLP 2017, Copenhagen, Denmark, September 9-11, 2017, 2253–2263.
Wu, P.; Sismanis, Y.; and Reinwald, B. 2007. Towards keyword-driven analytical processing. InProceedings of the ACM SIGMOD International Conference on Management of Data, Beijing, China, June 12-14, 2007, 617–628.