Adv. Radio Sci., 4, 73–78, 2006 www.adv-radio-sci.net/4/73/2006/ © Author(s) 2006. This work is licensed under a Creative Commons License.
Advances in
Radio Science
Coherent and non-coherent processing of multiband
radar sensor data
S. Tejero, U. Siart, and J. Detlefsen
Institute for High Frequency Engineering, Technische Universit¨at M¨unchen, D-80290 M¨unchen, Munich, Germany
Abstract. Increasing resolution is an attractive goal for all types of radar sensor applications. Obtaining high radar res-olution is strongly related to the signal bandwidth which can be used. The currently available frequency bands however, restrict the available bandwidth and consequently the achiev-able range resolution. As nowadays more sensors become available e.g. on automotive platforms, methods of combin-ing sensor information stemmcombin-ing from sensors operatcombin-ing in different and not necessarily overlapping frequency bands are of concern. It will be shown that it is possible to derive benefit from perceiving the same radar scenery with two or more sensors in distinct frequency bands. Beyond ordinary sensor fusion methods, radar information can be combined more effectively if one compensates for the lack of mutual coherence, thus taking advantage of phase information.
At high frequencies, complex scatterers can be approxi-mately modeled as a group of single scattering centers with constant delay and slowly varying amplitude, i.e. a set of complex exponentials buried in noise. The eigenanalysis al-gorithms are well known for their capability to better resolve complex exponentials as compared to the classical spectral analysis methods. These methods exploit the statistical prop-erties of those signals to estimate their frequencies. Here, two main approaches to extend the statistical analysis for the case of data collected at two different subbands are pre-sented. One method relies on the use of the band gap in-formation (and therefore, coherent data collection is needed) and achieves an increased resolution capability compared with the single-band case. On the other hand, the second ap-proach does not use the band gap information and represents a robust way to process radar data collected with incoherent sensors. Combining the information obtained with these two approaches a robust estimator of the target locations with in-creased resolution can be built.
Correspondence to: S. Tejero ([email protected])
1 Introduction
Increasing resolution is an attractive goal for all types of radar sensor applications. Obtaining high radar resolution is strongly related to the signal bandwidth which can be used. The currently available frequency bands however, restrict the available bandwidth and consequently the achievable range resolution. As nowadays more sensors become available e.g. on automotive platforms, methods of combining sensor in-formation stemming from sensors operating in different and not necessarily overlapping frequency bands are of concern. Beyond ordinary sensor fusion methods, radar information can be combined more effectively if one compensates for the lack of mutual coherence, thus taking advantage of phase in-formation.
In this article, the possibility to obtain a benefit in the radar performance by exploiting the availability of sensors operat-ing at different frequency bands will be analyzed. We will concentrate on the dualband case, i.e. two sensors which ob-serve the same radar scenario from the same aspect angle.
2 Radar signal model
In the common frequency bands for radar systems the tar-gets can be considered to be in the high frequency range, as they usually are greater than a wavelength. Some very popular high frequency approximations for solving scattering problems are the Geometrical Optics (GO) theory and one of its extensions, the Geometrical Theory of Diffraction (GTD) (Hansen, 1981; James, 1986; McNamara et al., 1990). Both approximations are based in the decomposition of a scatterer in a set of individual scattering centers with a specific fre-quency dependence. These scattering centers corresponds to specular reflections, diffraction at wedges or tips or creeping wave terms. Assuming that the high frequency approxima-tion is valid, the radar response of a target or a group of them
74 S. Tejero et al.: Coherent and non-coherent processing of multiband radar sensor data can be represented as a sum of individual scattering centers
with constant delay:
X(t )= P X
p=1
Apδ(t−τp) (1)
where each Dirac’s delta represents a scattering center at dis-tancec0τi/2 with amplitudeαi. In the high-frequency range this model is valid for a wide frequency band, so that the expression for the frequency domain results in
x(f )= P X
p=1
Apej2πf τp. (2)
This radar response is sampled by a system working at a fre-quency bandBland can be expressed as:
xl[n] = P X
p=1
Apzkp0l+n= P X
p=1
aplzpn (3)
where
zp =ej p p =1ωτp apl =Apej ω0lτp
andτp is the round trip time,1ωthe angular frequency in-crement andω0l is the angular start frequency for bandBl.
3 Radar signal processing
Analyzing Eqs. (2) and (3) it can be noted that the radar prob-lem of finding the position of the scattering centers in the frequency radar response is equivalent to the estimation of the frequencies of complex exponentials in a time domain signal or the angles of the poleszp. Therefore, spectral or frequency estimation algorithms can be applied. In this pa-per, the dualband analysis is based on the Multiple Signal Classification (MUSIC) algorithm, but the results can be ex-tended to other parametrized spectral estimation techniques, like Autoregressive (AR) algorithms, as well.
3.1 Single-band MUSIC
A short review of the MUSIC algorithm for a single-band dataset is given here, further information can be found in the literature (Marple, 1987; Schmidt, 1986). Assume the radar frequency response of Eq. (3) is received in the pres-ence of complex white Gaussian Noise (CWGN)w[n]in the frequency bandB
y[n] = P X
p=1
apznp+w[n], n=0, . . . , N−1
y[n] =x[n] +w[n]. (4)
With the samples of the data sequencex[n], the so called data matrix X of orderL–equal to the data matrix in the AR covariance method– can be built and decomposed into the matrices B and C:
X=
x[L−1] x[L−2] · · · x[0]
x[L] x[L−1] · · · x[1]
..
. ... . .. ... x[N−1]x[N−2] · · ·x[N−L]
=B·C (5)
B=
a1zL1−1 a2z2L−1 · · ·aPzLP−1 a1zL1 a2z2L · · · aPzLP
..
. ... . .. ... a1z1N−1a2z2N−1· · ·aPzNP−1
(6)
C=
1z−11· · ·z−1L+1
1z−21· · ·z−2L+1 ..
. ... . .. ...
1z−P1· · ·z−PL+1
(7)
An eigenvalue decomposition is applied to the autocorre-lation-like matrix XHX, so that
XHX=V3VH with (8)
V=
v1[1] v2[1] · · · vL[1] v1[2] v2[2] · · · vL[2]
..
. ... . .. ... v1[L]v2[L] · · ·vL[L]
(9)
3=
λ1 0 · · · 0 0 λ2· · · 0
..
. ... . .. ...
0 0 · · ·λL
(10)
andλk=0 for k=P+1, . . . , L as the matrix XHX is of rankP. It can be shown, that any principal eigenvector vk (k=1, . . . , P) of the matrix XHX is a linear combination of the columns of CH (e.g. Marple, 1987), composed by the signal poles:
CH =
1 1 · · · 1
(z∗1)−1 (z∗2)−1 · · · (z∗P)−1 ..
. ... . .. ... (z∗1)−L+1(z∗2)−L+1· · ·(z∗P)−L+1
Therefore, the columns of CH are orthogonal to the non-principal eigenvectors vk(k=P+1, . . . , L).
In the presence of noise, the autocorrelation-like matrix of the signal plus noise can be approximated by
YHY≈XHX+σ2I=XHX+ L X
k=1
σ2vkvHk
= P X
k=1
(λk+σ2)vkvHk + L X
k=P+1
S. Tejero et al.: Coherent and non-coherent processing of multiband radar sensor data 75 withσ2 the noise variance. The principal eigenvectors vk
(k=1, . . . , P) expand the signal plus noise subspace and the eigenvectors vk(k=P+1, . . . , L) the noise subspace.
The MUSIC algorithm exploits the orthogonality between the noise subspace eigenvectors vk and the columns of CH, the signal vectors
s(zp)= h
1(zp∗)−1· · ·(z∗p)−L+1 iT
(12)
in different ways. The Spectral MUSIC looks for the peaks in the pseudospectrumX(ej ω)
X(ej ω)= 1
D(ej ω)
= 1
sH(ej ω)PL
k=P+1vkvHk
s(ej ω)
(13)
which are at the signal frequencies and the Root-MUSIC al-gorithm obtains directly the roots of the null spectra polyno-mialD(z):
D(z)= L X
k=P+1
Vk(z)Vk∗(1/z
∗) with (14)
Vk(z)=vk[1] +vk[2]z−1+ · · · +vk[L]z−(L−1) (15)
Next, two possible extensions of this algorithm to the dual-band case are presented.
3.2 Multiband radar signal processing
The radar response is sampled at two different subbandsB1 andB2:
y[n] = P X
p=1
apznp+w[n] with (16)
n= (
N10, . . . , N10+N1−1 forB1
N20, . . . , N20+N2−1 forB2
Two main approaches to treat the dualband case can be iden-tified, the non-coherent approach, where no information on the band gap between the subbands is used and the coherent approach, where the information about the band gap is used in the algorithm.
3.2.1 Non-coherent multiband MUSIC
Using the data of the two subbands, a new data matrix is built by the superposition of the two subband matrices:
Xnc=
X1 X2
where (17)
X1=
x[N10−L1+1] · · · X[N10]
..
. . .. ...
x[N10+N1−1] · · ·x[N10+N1−L1]
(18)
X2=
x[N20−L2+1] · · · X[N20]
..
. . .. ...
x[N20+N2−1] · · ·x[N20+N2−L2]
(19)
and L1=L2=L. As in the single-band case, the matrix Xt ext nccan be decomposed into the product of the matrices Bt ext ncand C, with
Bt ext nc=
B1 B2
(20) and C defined as in Eq. (7). As the matrix C has the same structure as in the single-band case, the same proce-dure can be applied directly. No information of the band gap
N20−N10is used, therefore, no coherence between the two subbands is required.
3.2.2 Coherent multiband MUSIC
To exploit the relative position between the two subbands, a data matrix is built including the band-gap information in its structure.
Xt ext c=X2X1 (21)
where X1 and X2 are defined as in Eqs. (18) and (19),
L1+L2=LandN2−N1=L2−L1. The new data matrix Xt ext c is decomposed as the product of the matrices B and Ct ext c, with B defined as in Eq. (6) and
Ct ext c=
1· · ·z−L2+1
1 z
−1N 1 · · ·z
−1N−L1+1
1
..
. . .. ... ... . .. ...
1· · ·z−L2+1
P z
−1N P · · ·z
−1N−L1+1
P
(22)
with1N=N20−N10+N2−N1.
Comparing the structure of the data matrices for the single-band- X, for the non-coherent dualsingle-band- Xt ext nc and for the coherent dualband-algorithm Xt ext c, can be observed the dif-ference of the approaches for analyzing the data. In the first two approaches, a window of lengthLis moved through the data set to characterize the relation between neighbor data samples with a maximum distanceLbetween them. In the third approach, to build the data matrix Xt ext cthe observation window is split into two sub-windows of lengthL1andL2, each of them containing data from a different subband. This
764 S. Tejero et al.: Coherent and Non-Coherent Processing of Multiband Radar Sensor DataS. Tejero et al.: Coherent and non-coherent processing of multiband radar sensor data
0 1 2 3 4
0 1 2 3 4
Band gap (D/Ni)
Angle distance (
Ω
/Rayleigh)
Fig. 1: Maximum resolvable angle distance using the non-coherent and non-coherent pole combination. Rayleigh angle dis-tance is defined as N2π
1+N2
with the polynomialVk(z)evaluated at the two subbands: Vk(z) = vk[1] +· · ·+vk[L2]z−L2+1+
+vk[L2+ 1]z−∆N+· · ·+vk[L]z−∆N−L1+1 (24) It is clear from the structure of the signal vectorss(zp)or the noise polynomialsVk(z), that the information of the band gap is used and therefore, coherence is required. As the gap information∆Nis included directly in the null-spectra poly-nomial, the number of zeros of polypoly-nomial, i. e. the number of signal poles orthogonal to the noise subspace vectors, in-creases linearly with the band gap. This makes the distinction of the real signal poles from the spurious polynomial zeros difficult.
To overcome this problem, the information of the non-coherent and non-coherent algorithms is combined. Only the ze-ros of the coherent polynomial surrounding the zeze-ros of the incoherent polynomial are analyzed. It is assumed, that the detection of a group of scatterers is achieved with the non-coherent approach, while with the non-coherent approach only an increase of resolution is expected. It may occur that two signal poles are present where the non-coherent approach de-tects only one. Assuming that the coherent polynomial zeros are approximately distributed uniformly along the unit circle, the maximum search distance to avoid spurious zeros is fixed by the total number of zeros, which is approximately equal to∆N. This approach implies a limit in the maximum dis-tance between two poles which can be still resolved with this algorithm as can be seen in Fig. 1.
4 Simulations
The resolution capability of the dualband processing has been assessed by means of simulations. Monte Carlo analy-sis of the probability of resolution, i. e. the frequency of ex-periments for which two targets are resolved over the number of experiments where two targets are present, have been car-ried out. A signal composed by two poles on the unit-circle with angular distance ∆Ω between them and equal ampli-tudeAburied in CWGN has been used as radar signal. The
z1 z2 ˆ z1 ˆ z2 Unit circle (a) Resolved z1 z2 ˆ z1 ˆ z2 Unit circle
(b) Not resolved
Fig. 2: Illustration of the resolution criteria: two targets are said to be resolved if the distances from the estimated poles (zˆp) to the true ones (zp) is lower than the distance between the true positions
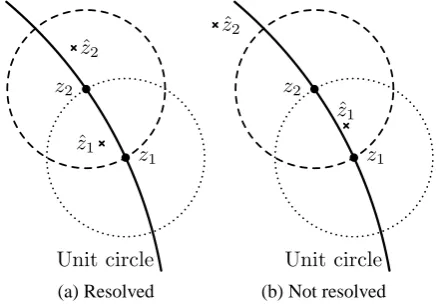
signal is sampled at two subbands with equal number of sam-plesN1=N2= 32and with a variable band gap ofD sam-ples between them. Both dualband root-MUSIC algorithms withL = 8andP = 2have been applied. As the number of expected targetsP is assumed to be known in advance for the algorithm the number of detected targets can not be used as resolution criterion. The definition of resolution proposed here is illustrated in Fig 2, two targets are said to be resolved if the distance between the estimated poles and the true ones is smaller than the distance between the true positions.
In Fig. 3 results of the Monte Carlo analysis for different angular distances between the poles∆Ωand signal to noise ratio, defined as SNR = A2/σ2, are shown. Also several single-band simulations withN =N1+N2= 64have been carried out. The cases with a probability of resolution around 50% have been selected for demonstration.
It can be seen, e. g. Fig 3f or 3g, that the dualband non-coherent approach has resolution performance similar to the single-band case. The non-coherent approach is therefore a robust way to exploit the whole bandwidth of a signal, also if the signal information is split in different, non-adjacent and mutually incoherent subbandsBeq=PB
i.
The coherent approach achieves a higher probability of resolution. For low angle distances,∆Ω<0.5 2π
N1+N2 from
Fig 3a to 3d, the improvement in the dualband coherent al-gorithm increases continuously with the band gap. Also an increase is observed in the dualband non-coherent approach (Fig 3a). For greater pole distances however, the probability of resolution shows a periodic behavior with period≈ 2π
∆Ω. This is again observed in both dualband approaches. The origin of this periodicity effect will be subject of further in-vestigations.
5 Summary and Outlook
A signal model for the multiband radar response based on GO and GTD has been presented. Based on this model, it can be seen that the range estimation using frequency-domain
Fig. 1. Maximum resolvable angle distance using the non-coherent and coherent pole combination. Rayleigh angle distance is defined asN2π
1+N2.
window analyzes the relation between the neighbor samples in the same subband and the samples of the other subband.
Now, the noise subspace eigenvectors vk are orthogonal to the columns of CHt ext c, which are composed by the signal poles evaluated at the two subbands simultaneously
s(zp)= h
1· · ·(z∗p)−L2+1(z∗ p)
−1N· · ·(z∗ p)
−1N−L1+1iT(23)
The pole vectors which are orthogonal to the noise sub-space, are identified again with two main procedures. The spectral MUSIC algorithm looks for the peaks in the pseu-dospectrumX(ej ω)
X(ej ω)= 1
D(ej ω)=
1 sH(ej ω)PL
k=P+1vkvHk
s(ej ω) and the root-MUSIC obtains the roots of the null spectra polynomialD(z)
D(z)= L X
k=P+1
Vk(z)Vk∗(1/z ∗
)
with the polynomialVk(z)evaluated at the two subbands: Vk(z)=vk[1] + · · · +vk[L2]z−L2+1
+vk[L2+1]z−1N+ · · · +vk[L]z−1N−L1+1 (24) It is clear from the structure of the signal vectorss(zp)or the noise polynomialsVk(z), that the information of the band gap is used and therefore, coherence is required. As the gap information1Nis included directly in the null-spectra poly-nomial, the number of zeros of polypoly-nomial, i.e. the number of signal poles orthogonal to the noise subspace vectors, in-creases linearly with the band gap. This makes the distinction of the real signal poles from the spurious polynomial zeros difficult.
To overcome this problem, the information of the non-coherent and non-coherent algorithms is combined. Only the ze-ros of the coherent polynomial surrounding the zeze-ros of the
4 S. Tejero et al.: Coherent and Non-Coherent Processing of Multiband Radar Sensor Data
0 1 2 3 4
0 1 2 3 4
Band gap (D/Ni)
Angle distance (
Ω
/Rayleigh)
Fig. 1: Maximum resolvable angle distance using the non-coherent and non-coherent pole combination. Rayleigh angle dis-tance is defined as N2π
1+N2
with the polynomialVk(z)evaluated at the two subbands:
Vk(z) = vk[1] +· · ·+vk[L2]z−L2+1+
+vk[L2+ 1]z−∆N+· · ·+vk[L]z−∆N−L1+1
(24) It is clear from the structure of the signal vectorss(zp)or
the noise polynomialsVk(z), that the information of the band
gap is used and therefore, coherence is required. As the gap information∆Nis included directly in the null-spectra poly-nomial, the number of zeros of polypoly-nomial, i. e. the number of signal poles orthogonal to the noise subspace vectors, in-creases linearly with the band gap. This makes the distinction of the real signal poles from the spurious polynomial zeros difficult.
To overcome this problem, the information of the non-coherent and non-coherent algorithms is combined. Only the ze-ros of the coherent polynomial surrounding the zeze-ros of the incoherent polynomial are analyzed. It is assumed, that the detection of a group of scatterers is achieved with the non-coherent approach, while with the non-coherent approach only an increase of resolution is expected. It may occur that two signal poles are present where the non-coherent approach de-tects only one. Assuming that the coherent polynomial zeros are approximately distributed uniformly along the unit circle, the maximum search distance to avoid spurious zeros is fixed by the total number of zeros, which is approximately equal to∆N. This approach implies a limit in the maximum dis-tance between two poles which can be still resolved with this algorithm as can be seen in Fig. 1.
4 Simulations
The resolution capability of the dualband processing has been assessed by means of simulations. Monte Carlo analy-sis of the probability of resolution, i. e. the frequency of ex-periments for which two targets are resolved over the number of experiments where two targets are present, have been car-ried out. A signal composed by two poles on the unit-circle
z1 z2 ˆ z1 ˆ z2 Unit circle (a) Resolved z1 z2 ˆ z1 ˆ z2 Unit circle
(b) Not resolved
Fig. 2: Illustration of the resolution criteria: two targets are said to be resolved if the distances from the estimated poles (zˆp) to the true ones (zp) is lower than the distance between
the true positions
signal is sampled at two subbands with equal number of sam-plesN1 =N2= 32and with a variable band gap ofD
sam-ples between them. Both dualband root-MUSIC algorithms withL = 8andP = 2have been applied. As the number of expected targetsP is assumed to be known in advance for the algorithm the number of detected targets can not be used as resolution criterion. The definition of resolution proposed here is illustrated in Fig 2, two targets are said to be resolved if the distance between the estimated poles and the true ones is smaller than the distance between the true positions.
In Fig. 3 results of the Monte Carlo analysis for different angular distances between the poles∆Ωand signal to noise ratio, defined as SNR = A2/σ2, are shown. Also several
single-band simulations withN =N1+N2= 64have been
carried out. The cases with a probability of resolution around 50% have been selected for demonstration.
It can be seen, e. g. Fig 3f or 3g, that the dualband non-coherent approach has resolution performance similar to the single-band case. The non-coherent approach is therefore a robust way to exploit the whole bandwidth of a signal, also if the signal information is split in different, non-adjacent and mutually incoherent subbandsBeq=PB
i.
The coherent approach achieves a higher probability of resolution. For low angle distances,∆Ω< 0.5 2π
N1+N2 from
Fig 3a to 3d, the improvement in the dualband coherent al-gorithm increases continuously with the band gap. Also an increase is observed in the dualband non-coherent approach (Fig 3a). For greater pole distances however, the probability of resolution shows a periodic behavior with period≈ 2π
∆Ω.
This is again observed in both dualband approaches. The origin of this periodicity effect will be subject of further in-vestigations.
5 Summary and Outlook
A signal model for the multiband radar response based on
Fig. 2. Illustration of the resolution criteria: two targets are said to be resolved if the distances from the estimated poles (zˆp) to the true
ones (zp) is lower than the distance between the true positions.
incoherent polynomial are analyzed. It is assumed, that the detection of a group of scatterers is achieved with the non-coherent approach, while with the non-coherent approach only an increase of resolution is expected. It may occur that two signal poles are present where the non-coherent approach de-tects only one. Assuming that the coherent polynomial zeros are approximately distributed uniformly along the unit circle, the maximum search distance to avoid spurious zeros is fixed by the total number of zeros, which is approximately equal to1N. This approach implies a limit in the maximum dis-tance between two poles which can be still resolved with this algorithm as can be seen in Fig. 1.
4 Simulations
The resolution capability of the dualband processing has been assessed by means of simulations. Monte Carlo anal-ysis of the probability of resolution, i.e. the frequency of ex-periments for which two targets are resolved over the number of experiments where two targets are present, have been car-ried out. A signal composed by two poles on the unit-circle with angular distance1between them and equal ampli-tudeAburied in CWGN has been used as radar signal. The signal is sampled at two subbands with equal number of sam-plesN1=N2=32 and with a variable band gap ofD sam-ples between them. Both dualband root-MUSIC algorithms withL=8 andP=2 have been applied. As the number of expected targetsP is assumed to be known in advance for the algorithm the number of detected targets can not be used as resolution criterion. The definition of resolution proposed here is illustrated in Fig. 2, two targets are said to be resolved if the distance between the estimated poles and the true ones is smaller than the distance between the true positions.
In Fig. 3 results of the Monte Carlo analysis for different angular distances between the poles1and signal to noise
S. Tejero et al.: Coherent and non-coherent processing of multiband radar sensor data 77
S. Tejero et al.: Coherent and Non-Coherent Processing of Multiband Radar Sensor Data 5
0 20 40 60 80 100 120
0 0.2 0.4 0.6 0.8 1
Band gap
P resol
(a)∆Ω = 0
.15
2π
N1+N2, SNR=30 dB
0 20 40 60 80 100 120
0 0.2 0.4 0.6 0.8 1
Band gap
P resol
(b)∆Ω = 0
.15
2π
N1+N2, SNR=35 dB
0 20 40 60 80 100 120
0 0.2 0.4 0.6 0.8 1
Band gap
P resol
(c)∆Ω = 0
.25
2π
N1+N2, SNR=20 dB
0 20 40 60 80 100 120
0 0.2 0.4 0.6 0.8 1
Band gap
P resol
(d)∆Ω = 0
.25
2π
N1+N2, SNR=25 dB
0 20 40 60 80 100 120
0 0.2 0.4 0.6 0.8 1
Band gap
P resol
(e)∆Ω = 0
.5
2π
N1+N2, SNR=10 dB
0 20 40 60 80 100 120
0 0.2 0.4 0.6 0.8 1
Band gap
P resol
(f)∆Ω = 0
.5
2π
N1+N2, SNR=15 dB
0 20 40 60 80 100 120
0 0.2 0.4 0.6 0.8 1
Band gap
P resol
(g)∆Ω = 0
.75
2π
N1+N2, SNR=15 dB
0 20 40 60 80 100 120
0 0.2 0.4 0.6 0.8 1
Band gap
P resol
(h)∆Ω = 1
.00
2π
N1+N2, SNR=0 dB
Fig. 3: Probability of resolution Monte Carlo analysis. Radar signal composed by two poles on the unit-circle with angular distance between them of ∆Ω, sampled at two subbands with N1 = N2 = 32 and with a band gap between them ofD
samples. Applied algorithms: Dualband root-MUSIC non-coherent (solid line), coherent (dashed line) withL= 8andP = 2
and single-band (×) withN =N1+N2= 64. The resolution event is defined as in Fig 2
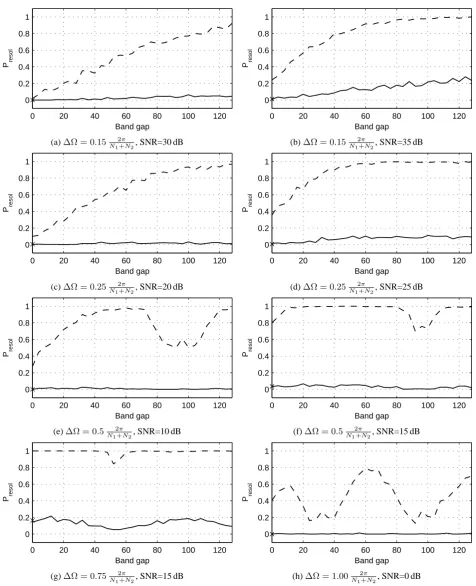
Fig. 3. Probability of resolution Monte Carlo analysis. Radar signal composed by two poles on the unit-circle with angular distance between them of1, sampled at two subbands withN1=N2=32 and with a band gap between them ofDsamples. Applied algorithms: Dualband
root-MUSIC non-coherent (solid line), coherent (dashed line) withL=8 andP=2 and single-band (×) withN=N1+N2=64. The resolution event is defined as in Fig. 2.
78 S. Tejero et al.: Coherent and non-coherent processing of multiband radar sensor data ratio, defined as SNR=A2/σ2, are shown. Also several
single-band simulations withN=N1+N2=64 have been carried out. The cases with a probability of resolution around 50% have been selected for demonstration.
It can be seen, e.g. Figs. 3f or 3g, that the dualband non-coherent approach has resolution performance similar to the single-band case. The non-coherent approach is therefore a robust way to exploit the whole bandwidth of a signal, also if the signal information is split in different, non-adjacent and mutually incoherent subbandsBeq=PBi.
The coherent approach achieves a higher probability of resolution. For low angle distances,1 <0.5N2π
1+N2 from
Figs. 3a to 3d, the improvement in the dualband coherent al-gorithm increases continuously with the band gap. Also an increase is observed in the dualband non-coherent approach (Fig. 3a). For greater pole distances however, the probability of resolution shows a periodic behavior with period≈ 2π
1. This is again observed in both dualband approaches. The origin of this periodicity effect will be subject of further in-vestigations.
5 Summary and outlook
A signal model for the multiband radar response based on GO and GTD has been presented. Based on this model, it can be seen that the range estimation using frequency-domain radar information is analog to the spectral or frequency es-timation techniques for time-domain signals. The MUSIC algorithm for spectral estimation has been extended to
ob-tain two ways to process the multiband case: non-coherent and coherent. The non-coherent algorithm does not require coherency between the subbands. It does not use the band gap information and the resolution performance is similar to the single-band case using the sum of the bandwidths. It is therefore a robust approach to exploit the total bandwidth of a signal, also if the signal information is split in different, non-adjacent and mutually incoherent subbands. The coherent algorithm exploits the band gap information and therefore, coherent data sets are required. An increase in the resolu-tion performance compared to the non-coherent algorithm is achieved. Also a periodic effect with period ≈ 2π
1 for 1 >0.5N2π
1+N2 has been observed, which will be subject
of further investigations.
References
Hansen, R. C.: Geometric Theory of Diffraction, IEEE Press, New York, 1981.
James, G. L.: Geometrical Theory of Diffraction for Electromag-netic Waves, Peter Peregrinus, Stevenage, Herts, England, re-vised third edn., 1986.
Marple, S.: Digital Spectral Analysis, Prentice Hall, Englewood Cliffs, New Jersey, 1987.
McNamara, D. A., Pistorius, C., and Malherbe, J.: Introduction to the Uniform Geometrical Theory of Diffraction, Artech House, Boston London, 1990.