Zukow W, Popadynets’ OO, Gozhenko AI, Popovych IL. Interindividual differences in parameters of the EEG and HRV in the humans with various levels of the entropy of EEG, HRV, immunocytogram and leukocytogram. Journal of Education, Health and Sport. 2019;9(7):448-466. eISNN 2391-8306. DOI http://dx.doi.org/10.5281/zenodo.3361498
http://ojs.ukw.edu.pl/index.php/johs/article/view/72 33
The journal has had 5 points in Ministry of Science and Higher Education parametric evaluation. § 8. 2) and § 12. 1. 2) 22.02.2019. © The Authors 2019;
This article is published with open access at Licensee Open Journal Systems of Kazimierz Wielki University in Bydgoszcz, Poland
Open Access. This article is distributed under the terms of the Creative Commons Attribution Noncommercial License which permits any noncommercial use, distribution, and reproduction in any medium, provided the original author (s) and source are credited. This is an open access article licensed under the terms of the Creative Commons Attribution Non commercial license Share alike.
(http://creativecommons.org/licenses/by-nc-sa/4.0/) which permits unrestricted, non commercial use, distribution and reproduction in any medium, provided the work is properly cited. The authors declare that there is no conflict of interests regarding the publication of this paper.
Received: 05.07.2019. Revised: 25.07.2019. Accepted: 31.07.2019.
Interindividual differences in parameters of the EEG and HRV in the humans with various levels of the entropy of EEG, HRV, immunocytogram and leukocytogram
W Zukow1, OO Popadynets’2, AI Gozhenko2, IL Popovych3 1Nicolaus Copernicus University, Torun, Poland [email protected]
2State Enterprise Ukrainian Research Institute for Medicine of Transport, Ministry of Health of Ukraine, Odesa, Ukraine [email protected]
3OO Bohomolets’ Institute of Physiology, Kyїv, Ukraine [email protected]
Abstract
we have discovered previously are quantitatively and qualitatively distinct from each other by at least 37 amplitude-frequency and spectral parameters of EEG as well as of HRV.
Keywords: EEG, HRV, Entropy, Correlations, Women and Man.
INTRODUCTION
Previously, we have shown that in patients with chronic pyelonephritis and cholecystitis in remission as well as without clinical diagnose but with dysfunction of neuro-endocrine-immune complex and metabolism entropy of the relative (normalized) parameters of the HRV and SPD of loci of EEG significantly correlate with the entropy and parameters of immunity, which testifies to their modulating regulatory effects [11].
Individual analysis revealed that the entropy of HRV and SPD of loci of EEG as well as Immunocytogram (ICG) and Leukocytogram (LCG) is characterized by considerable variability. The method of cluster analysis was the distribution of the observed contingent into groups that are homogeneous in terms of entropy [12].
Z-scores of entropy of SPD in loci of EEG as well as of HRV, LCG and ICG in members of various clusters are rendered in Fig. 1.
-3.0 -2.5 -2.0 -1.5 -1.0 -0.5 0.0 0.5 1.0
F3 F4 F7 F8 O2 O1 T4 FP1 C4 T3 T5 T6 FP2 C3 P3 P4 HRV ICG LCG
E
n
tr
o
p
y,
Z
[image:2.612.74.566.348.526.2]II(61) I(8) III(9) IV(24)
Fig. 1. Z-scores (M±SE) of entropy of SPD in loci of EEG as well as of HRV, LCG and ICG in members of various clusters [12]
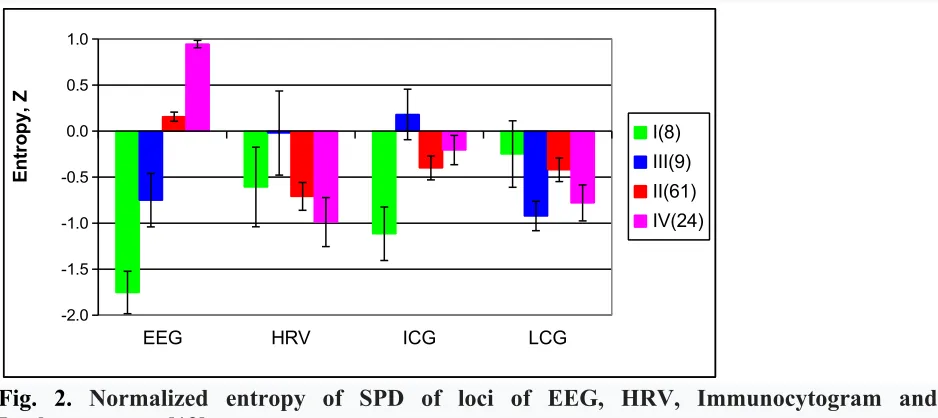
It turned out that in members of the major second cluster, the entropy of EEG, HRV, ICG and LCG varies within the normal range (-0,5σ ÷ +0,5σ). The members of the next largest fourth cluster are characterized by a moderately increased entropy of the SPD of EEG in combination with the normal entropy of the ICG and the moderately reduced entropy of HRV and LCG. The most stringent were the members of two minor clusters. In particular, members of the third
ICG. The entropy of other EEG loci as well as of HRV and LCG is within the normal range. The average normalized values of the entropy of the SPD of the EEG, HRV, ICG and LCG are shown in figure 3. As we see, the characteristic features of the image of the members of the first cluster are expressed negentropy of the EEG in general, moderate negentropy of the ICG, lower boundary level of the entropy of the HRV, and the normal level of entropy of the LCG. Members of the third cluster are characterized by moderate negentropy of EEG and LCG in combination with normal levels of entropy of the HRV and ICG. Instead, the members of the fourth cluster are characterized by increased entropy of the EEG, coupled with a reduced entropy of HRV and LCG at normal levels of entropy of the ICG. However, for the vast majority of people who make up the second cluster, the normal entropy of all analyzed information systems is typical.
-2.0 -1.5 -1.0 -0.5 0.0 0.5 1.0
EEG HRV ICG LCG
E
n
tr
o
p
y,
Z
I(8) III(9) II(61) IV(24)
Fig. 2. Normalized entropy of SPD of loci of EEG, HRV, Immunocytogram and Leukocytogram [12]
The purpose of this study is to identify the spectral parameters and indices of HRV, the amplitude-frequency and spectral parameters of the rhythms of EEG as well as the indices of asymmetry and lateralization of rhythms, which together are four clusters of entropy significantly different from each other.
MATERIAL AND METHODS
The object of observation were 37 men and 14 women aged 23-76 years old, who came to the spa Truskavets’ (Ukraine) for the treatment of chronic pyelonephritis and cholecystitis in remission as well as without clinical diagnose but with dysfunction of neuro-endocrine-immune complex and metabolism. The survey was conducted twice, before and after balneotherapy.
[image:3.612.72.541.235.444.2]Simultaneosly we recorded EEG (hardware-software complex “NeuroCom Standard”, KhAI Medica, Kharkiv, Ukraine) monopolar in 16 loci (Fp1, Fp2, F3, F4, F7, F8, C3, C4, T3, T4, P3, P4, T5, T6, O1, O2) by 10-20 international system, with the reference electrodes A and Ref on the tassels of ears. Among the options considered the average EEG amplitude (μV), average frequency (Hz), frequency deviation (Hz), index (%), coefficient of asymmetry (%) as well as absolute (μV2/Hz) and relative (%) spectral power density (SPD) in the standard frequency bands:
β (35÷13 Hz), α (13÷8 Hz), θ (8÷4 Hz) and δ (4÷0,5 Hz) in all loci, according to the instructions of the device.
In addition, calculated Laterality Index (LI) for SPD each Rhythm using formula [8]: LI, % = Σ [200•(Right – Left)/(Right + Left)]/8
We calculated also for HRV and each locus EEG the Entropy (h) of normalized SPD using formula CE Shannon [13,18,27]:
hHRV = - [SPDHF•log2SPDHF+SPDLF•log2SPDLF+SPDVLF•log2SPDVLF+SPDULF•log2SPDULF]/log24;
hEEG = - [SPDα•log2SPDα+SPDβ•log2SPDβ+SPDθ•log2SPDθ+SPDδ•log2SPDδ]/log24
Results processed using the software package "Statistica 5.5".
RESULTS AND DISCUSSION
As a result of screening relationships between the normalized (as Z-score) EEG entropy levels on the one hand, and the EEG and HRV parameters and indices on the other, three pairs of quasi-mirror patterns were detected.
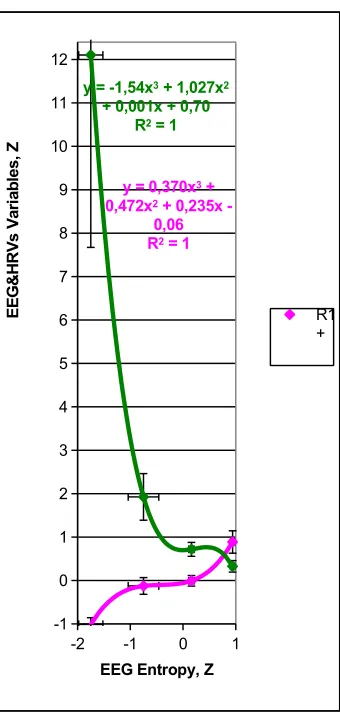
The direct pattern of the first pair (Fig. 3) demonstrates that in subjects with very significantly negentropy the relative SPD of θ-rhythm in loci T6, F7, T4, P4, F4 and absolute SPD in last locus as well as the Frequency of β-rhythm and SP of VLF band of HRV are significantly lower than normal. Both moderately reduced and normal entropies are accompanied by quasi-normal levels of the EEG and HRV parameters listed, but increased entropy is associated with significantly higher than normal EEG and HRV parameters (actual and normalized parameter levels see Table 1 and 4 respectively).
y = 0,370x3 +
0,472x2 + 0,235x -
0,06 R2 = 1
y = -1,54x3 + 1,027x2
+ 0,001x + 0,70
R2 = 1
-1 0 1 2 3 4 5 6 7 8 9 10 11 12
-2 -1 0 1
E
E
G
&
H
R
V
s
V
ar
ia
b
le
s,
Z
EEG Entropy, Z
[image:5.612.75.245.68.425.2]R1 +
Fig. 3. The first pair of EEG&HRV parameter patterns at different EEG entropy levels
The patterns of the second pair are parabolas (Fig. 4), which are usually referred to as straight or inverted letter U. They display extreme levels of EEG & HRV parameters in individuals with moderate negentropy. In particular, the inverse pattern reflects significantly increased levels of SPD of δ-rhythm in loci C4, F3 and F4 as well as its Index and Asymmetry as well as Index and Asymmetry of β-rhythm and Asymmetry of α-rhythm. This is accompanied by an increased SP of ULF band of HRV. Expressed negentropy is accompanied by upper-boundary levels of these parameters, and normal and elevated entropy are quite normal levels.
y = -0,431x3 - 0,124x2 + 0,828x - 0,01 R2 = 1
y = 0,748x3 + 0,396x2 - 1,558x + 0,62
R2 = 1
-0.8 -0.4 0.0 0.4 0.8 1.2 1.6
-2 -1.6 -1.2 -0.8 -0.4 0 0.4 0.8
E
E
G
&
H
R
V
V
ar
ia
b
le
s,
Z
EEG Entropy, Z
[image:6.612.74.411.70.304.2]R2 +
Fig. 4. The second pair of EEG&HRV parameter patterns at different EEG entropy levels
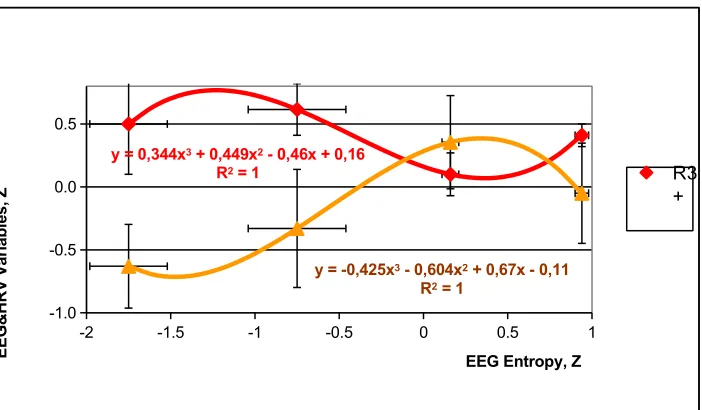
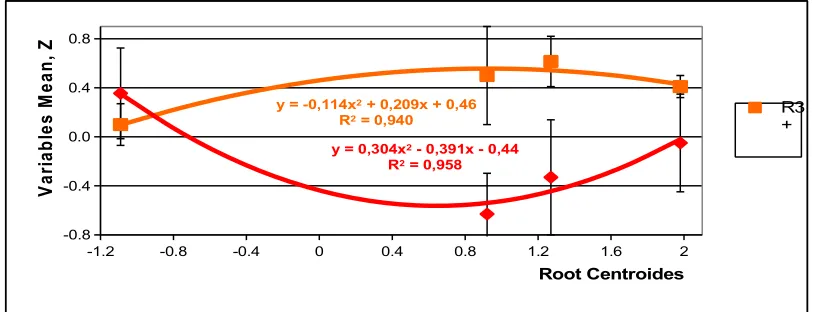
The patterns of the third pair are sinusoids (Fig. 4). The first reflects the situation in which individuals with normal entropy levels have normal levels of SPD of α-rhythm in loci O2 and Fp2 in combination with elevated levels of SP of HF and LF bands of HRV. In persons with high entropy, these parameters are moderately reduced or increased to a lesser degree, respectively, and negentropy is accompanied by a deeper decrease in EEG parameters in combination with normal HRV levels. The other pattern reflects the combination of normal entropy with the normal levels of Frequency of α-rhythm and Sympathetic tone, while the deviation of the entropy level in one direction or another is accompanied by a moderate increase in both.
y = 0,344x3 + 0,449x2 - 0,46x + 0,16
R2 = 1
y = -0,425x3 - 0,604x2 + 0,67x - 0,11
R2 = 1
-1.0 -0.5 0.0 0.5
-2 -1.5 -1 -0.5 0 0.5 1
E
E
G
&
H
R
V
V
ar
ia
b
le
s,
Z
EEG Entropy, Z
R3 +
[image:6.612.81.432.454.659.2]Particular attention should be paid to the analysis of patterns of Laterality of rhythms. As we can see in Fig. 6, pronounced negentropy is associated with pronounced left-sided Laterality of θ-and α-rhythms θ-and moderately Laterality of δ-θ-and β-rhythms, which comes to naught in individuals with both normal and increased entropy. However, in subjects with moderate negentropy, there is still a tendency for left-sided lateralization of θ-and δ-rhythms, while β-rhythm tends to show right-sided lateralization.
-1.5 -1 -0.5 0 0.5
-2 -1.5 -1 -0.5 0 0.5 1
L
at
er
al
it
y,
Z
EEG Entropy
[image:7.612.73.442.165.351.2]Theta Delta Beta Alpha
Fig. 6. EEG rhythm lateralization at different EEG entropy levels
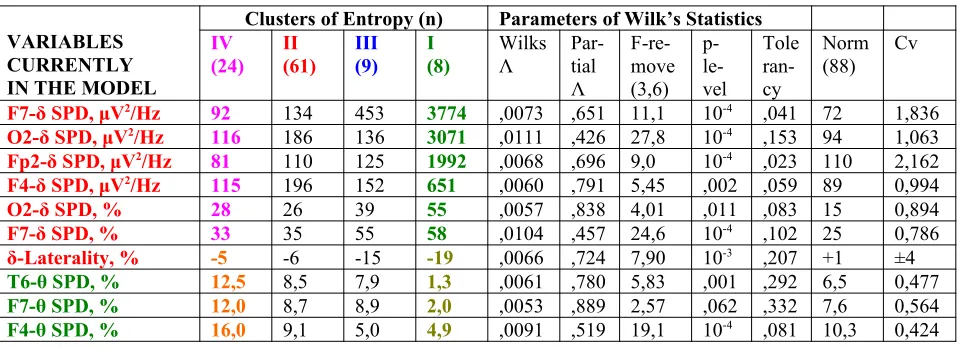
According to the results of the discriminant analysis (method forward stepwise [6]), only 37 parameters were identified as characteristic of the entropy clusters, 11 of which relate to delta rhythm, 8 to theta rhythm, 8 to beta rhythm and 4 to alpha rhythm of EEG, 6 more represent HRV. The other 16 EEG&HRV parameters considered were not included in the discriminant model (Tables 1 and 2).
Table 1. Discriminant Function Analysis Summary for EEGs and HRVs Variables as well as their actual Norm and Coefficients of Variability
Step 37, N of vars in model: 37; Grouping: 4 grps; Wilks' Λ: 0,0047; approx. F(111)=8,4; p<10-6
VARIABLES CURRENTLY IN THE MODEL
Clusters of Entropy (n) Parameters of Wilk’s Statistics
IV
(24) II(61) III(9) I(8) WilksΛ Par-tial Λ
F-re-move (3,6)
p- le-vel
Tole ran-cy
Norm
(88) Cv
F7-δ SPD, μV2/Hz 92 134 453 3774 ,0073 ,651 11,1 10-4 ,041 72 1,836
O2-δ SPD, μV2/Hz 116 186 136 3071 ,0111 ,426 27,8 10-4 ,153 94 1,063
Fp2-δ SPD, μV2/Hz 81 110 125 1992 ,0068 ,696 9,0 10-4 ,023 110 2,162
F4-δ SPD, μV2/Hz 115 196 152 651 ,0060 ,791 5,45 ,002 ,059 89 0,994
O2-δ SPD, % 28 26 39 55 ,0057 ,838 4,01 ,011 ,083 15 0,894
F7-δ SPD, % 33 35 55 58 ,0104 ,457 24,6 10-4 ,102 25 0,786
δ-Laterality, % -5 -6 -15 -19 ,0066 ,724 7,90 10-3 ,207 +1 ±4
T6-θ SPD, % 12,5 8,5 7,9 1,3 ,0061 ,780 5,83 ,001 ,292 6,5 0,477
F7-θ SPD, % 12,0 8,7 8,9 2,0 ,0053 ,889 2,57 ,062 ,332 7,6 0,564
[image:7.612.73.553.521.695.2]T4-θ SPD, % 13,1 7,9 9,5 4,2 ,0058 ,824 4,41 ,007 ,200 8,7 0,463
F4-θ SPD, μV2/Hz 76 40 31 29 ,0064 ,741 7,23 10-3 ,054 39 0,630
VLF HRV SP, msec2 1865 1229 1163 795 ,0053 ,899 2,32 ,084 ,446 1397 0,578
C4-δ SPD, % 30 31 61 31 ,0050 ,943 1,26 ,296 ,081 22 0,525
F3-δ SPD, % 34 34 64 39 ,0050 ,949 1,11 ,353 ,053 23 0,692
F4-δ SPD, % 30 37 60 43 ,0060 ,796 5,28 ,003 ,071 23 0,606
δ-Index, % 28 67 99 72 ,0061 ,784 5,69 ,002 ,437 50 0,868
ULF HRV SP, % 3,4 4,0 11,2 5,5 ,0061 ,782 5,75 ,002 ,596 4,3 0,926
α-Asymmetry, % 20 19 35 20 ,0057 ,833 4,16 ,009 ,383 17 0,590
β-Index, % 92,0 91,9 96,4 95,1 ,0060 ,797 5,26 ,003 ,423 87,9 0,197
T3-β SPD, % 32 29 15 16 ,0055 ,862 3,32 ,025 ,262 34 0,509
F3-β SPD, % 25,1 22,0 11,4 26,5 ,0057 ,831 4,20 ,009 ,073 26,3 0,609
C4-β SPD, % 26,1 23,4 14,1 24,9 ,0063 ,755 6,70 10-3 ,086 27,4 0,583
Fp1-β SPD, μV2/Hz 75 66 43 103 ,0054 ,886 2,66 ,056 ,192 66,5 0,484
F4-β SPD, μV2/Hz 91 78 57 83 ,0054 ,877 2,91 ,042 ,142 76 0,443
T6-β SPD, μV2/Hz 78 76 47 133 ,0063 ,753 6,77 10-3 ,376 92,5 0,839
T5-β SPD, % 30 27 19 22 ,0051 ,931 1,54 ,214 ,174 37 0,618
Fp2-θ SPD, μV2/Hz 43 27 16 51 ,0058 ,822 4,46 ,007 ,089 22 0,631
P3-θ SPD, μV2/Hz 59 59 24 78 ,0059 ,811 4,83 ,004 ,173 39 0,715
θ-Frequency, Hz 6,0 6,4 5,2 5,7 ,0053 ,895 2,41 ,075 ,315 6,5 0,188
(VLF+LF)/HF 17 12,2 11,9 16,5 ,0053 ,891 2,54 ,065 ,162 7,5 0,506
LF/HF 5,35 4,80 4,35 6,10 ,0055 ,869 3,12 ,032 ,163 2,76 0,675
O2-α SPD, % 35 50 27 26 ,0065 ,730 7,63 10-3 ,060 54,5 0,453
Fp2-α SPD, % 28 35 20 16 ,0060 ,792 5,42 ,002 ,122 40 0,492
HF HRV SP, msec2 481 596 279 318 ,0053 ,894 2,44 ,073 ,110 347 1,358
LF HRV SP, msec2 953 1089 954 623 ,0052 ,917 1,86 ,146 ,122 640 0,529
α-Frequency, Hz 10,8 10,4 10,7 10,5 ,0055 ,867 3,17 ,031 ,385 10,4 0,069
VARIABLES CURRENTLY NOT IN THE MODEL
IV
(24) II(61) III(9) I(8) WilksΛ Par-tial Λ
F to enter p-
le-vel Tole ran-cy
Norm
(88) Cv
δ-Amplitude, μV 15,0 19,7 28,9 59,8 ,005 ,977 ,49 ,691 ,126 13,3 0,442
β-Frequency, Hz 19,0 17,7 18,0 15,5 ,005 ,959 ,87 ,463 ,413 19,2 0,179
P4-θ SPD, % 12,8 7,5 7,8 5,5 ,005 ,984 ,33 ,804 ,249 7,1 0,425
θ-Laterality, % -11 -15 -21 -37 ,005 ,962 ,79 ,502 ,204 -5 ±3
α-Laterality, % -11 -11 -5 -28 ,005 ,974 ,79 ,706 ,259 -2 ±2
ULF HRV SP, msec2 98 151 218 152 ,005 ,978 ,47 ,706 ,259 122 1,021
C4-δ SPD, μV2/Hz 126 163 443 315 ,005 ,974 ,55 ,649 ,153 87 0,792
β-Asymmetry, % 20,7 23,0 29,3 21,3 ,005 ,962 ,79 ,706 ,259 19,8 0,717
β-Laterality, % -14 -12 +2 -15 ,005 ,953 1,00 ,502 ,204 -8 ±3
δ-Asymmetry, % 34 49 65 33 ,005 ,968 ,67 ,575 ,183 33 0,812
P4-α SPD, μV2/Hz 157 350 92 319 ,005 ,953 1,00 ,399 ,166 341 1,013
α-Amplitude, μV 13,8 20,7 11,3 21,1 ,005 ,961 ,83 ,481 ,101 22,1 0,657
θ-Amplitude, μV 9,8 8,5 7,7 9,4 ,005 ,955 ,96 ,399 ,166 7,2 0,315
T6-θ SPD, μV2/Hz 38 28 16 26 ,005 ,955 ,96 ,419 ,214 17 0,642
β-Amplitude, μV 12,7 12,4 11,0 14,3 ,005 ,959 ,88 ,458 ,190 13,6 0,313
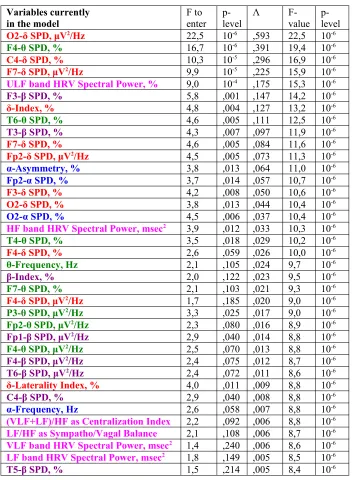
Table 2. Summary of Stepwise Analysis for EEGs and HRVs Variables. The variables are ranked by criterion Lambda
Variables currently
in the model F to enter p-level Λ F-value p-level
O2-δ SPD, μV2/Hz 22,5 10-6 ,593 22,5 10-6
F4-θ SPD, % 16,7 10-6 ,391 19,4 10-6
C4-δ SPD, % 10,3 10-5 ,296 16,9 10-6
F7-δ SPD, μV2/Hz 9,9 10-5 ,225 15,9 10-6
ULF band HRV Spectral Power, % 9,0 10-4 ,175 15,3 10-6
F3-β SPD, % 5,8 ,001 ,147 14,2 10-6
δ-Index, % 4,8 ,004 ,127 13,2 10-6
T6-θ SPD, % 4,6 ,005 ,111 12,5 10-6
T3-β SPD, % 4,3 ,007 ,097 11,9 10-6
F7-δ SPD, % 4,6 ,005 ,084 11,6 10-6
Fp2-δ SPD, μV2/Hz 4,5 ,005 ,073 11,3 10-6
α-Asymmetry, % 3,8 ,013 ,064 11,0 10-6
Fp2-α SPD, % 3,7 ,014 ,057 10,7 10-6
F3-δ SPD, % 4,2 ,008 ,050 10,6 10-6
O2-δ SPD, % 3,8 ,013 ,044 10,4 10-6
O2-α SPD, % 4,5 ,006 ,037 10,4 10-6
HF band HRV Spectral Power, msec2 3,9 ,012 ,033 10,3 10-6
T4-θ SPD, % 3,5 ,018 ,029 10,2 10-6
F4-δ SPD, % 2,6 ,059 ,026 10,0 10-6
θ-Frequency, Hz 2,1 ,105 ,024 9,7 10-6
β-Index, % 2,0 ,122 ,023 9,5 10-6
F7-θ SPD, % 2,1 ,103 ,021 9,3 10-6
F4-δ SPD, μV2/Hz 1,7 ,185 ,020 9,0 10-6
P3-θ SPD, μV2/Hz 3,3 ,025 ,017 9,0 10-6
Fp2-θ SPD, μV2/Hz 2,3 ,080 ,016 8,9 10-6
Fp1-β SPD, μV2/Hz 2,9 ,040 ,014 8,8 10-6
F4-θ SPD, μV2/Hz 2,5 ,070 ,013 8,8 10-6
F4-β SPD, μV2/Hz 2,4 ,075 ,012 8,7 10-6
T6-β SPD, μV2/Hz 2,4 ,072 ,011 8,6 10-6
δ-Laterality Index, % 4,0 ,011 ,009 8,8 10-6
C4-β SPD, % 2,9 ,040 ,008 8,8 10-6
α-Frequency, Hz 2,6 ,058 ,007 8,8 10-6
(VLF+LF)/HF as Centralization Index 2,2 ,092 ,006 8,8 10-6
LF/HF as Sympatho/Vagal Balance 2,1 ,108 ,006 8,7 10-6
VLF band HRV Spectral Power, msec2 1,4 ,240 ,006 8,6 10-6
LF band HRV Spectral Power, msec2 1,8 ,149 ,005 8,5 10-6
T5-β SPD, % 1,5 ,214 ,005 8,4 10-6
Next, the 37-dimensional space of discriminant variables transforms into 3-dimensional space of a canonical discriminant functions (canonical roots), which are a linear combination of discriminant variables. The discriminating (differentiating) ability of the root characterizes the canonical correlation coefficient (r*) as a measure of connection, the degree of dependence between groups (clusters) and a discriminant function. It is for Root 1 0,958 (Wilks' Λ=0,005; χ2
(Wilks' Λ=0,343; χ2
(35)=86; p<10-5). The first root contains 61,8% of discriminative opportunities,
the second is 27,6% and the third only 10,6%.
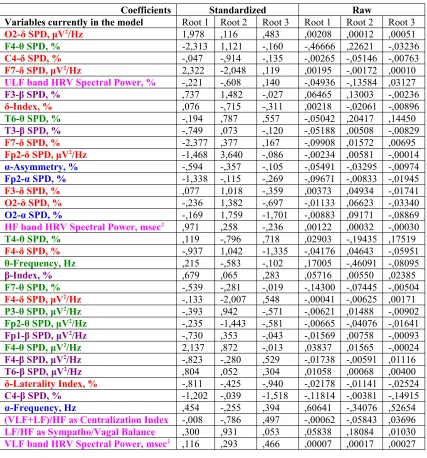
Table 3 presents raw (actual) and standardized (normalized) coefficients for discriminant variables. The raw coefficient gives information on the absolute contribution of this variable to the value of the discriminative function, whereas standardized coefficients represent the relative
contribution of a variable independent of the unit of measurement. They make it possible to identify those variables that make the largest contribution to the discriminatory function value.
[image:10.612.72.499.240.698.2]The calculation of the discriminant root values for each person as the sum of the products of raw coefficients to the individual values of discriminant variables together with the constant enables the visualization of each patient in the information space of the roots (Figs. 7 and 10).
Table 3. Standardized and Raw Coefficients and Constants for Canonical Variables
Coefficients Standardized Raw
Variables currently in the model Root 1 Root 2 Root 3 Root 1 Root 2 Root 3
O2-δ SPD, μV2/Hz 1,978 ,116 ,483 ,00208 ,00012 ,00051
F4-θ SPD, % -2,313 1,121 -,160 -,46666 ,22621 -,03236
C4-δ SPD, % -,047 -,914 -,135 -,00265 -,05146 -,00763
F7-δ SPD, μV2/Hz 2,322 -2,048 ,119 ,00195 -,00172 ,00010
ULF band HRV Spectral Power, % -,221 -,608 ,140 -,04936 -,13584 ,03127
F3-β SPD, % ,737 1,482 -,027 ,06465 ,13003 -,00236
δ-Index, % ,076 -,715 -,311 ,00218 -,02061 -,00896
T6-θ SPD, % -,194 ,787 ,557 -,05042 ,20417 ,14450
T3-β SPD, % -,749 ,073 -,120 -,05188 ,00508 -,00829
F7-δ SPD, % -2,377 ,377 ,167 -,09908 ,01572 ,00695
Fp2-δ SPD, μV2/Hz -1,468 3,640 -,086 -,00234 ,00581 -,00014
α-Asymmetry, % -,594 -,357 -,105 -,05491 -,03295 -,00974
Fp2-α SPD, % -1,338 -,115 -,269 -,09671 -,00833 -,01945
F3-δ SPD, % ,077 1,018 -,359 ,00373 ,04934 -,01741
O2-δ SPD, % -,236 1,382 -,697 -,01133 ,06623 -,03340
O2-α SPD, % -,169 1,759 -1,701 -,00883 ,09171 -,08869
HF band HRV Spectral Power, msec2 ,971 ,258 -,236 ,00122 ,00032 -,00030
T4-θ SPD, % ,119 -,796 ,718 ,02903 -,19435 ,17519
F4-δ SPD, % -,937 1,042 -1,335 -,04176 ,04643 -,05951
θ-Frequency, Hz ,215 -,583 -,102 ,17005 -,46091 -,08095
β-Index, % ,679 ,065 ,283 ,05716 ,00550 ,02385
F7-θ SPD, % -,539 -,281 -,019 -,14300 -,07445 -,00504
F4-δ SPD, μV2/Hz -,133 -2,007 ,548 -,00041 -,00625 ,00171
P3-θ SPD, μV2/Hz -,393 ,942 -,571 -,00621 ,01488 -,00902
Fp2-θ SPD, μV2/Hz -,235 -1,443 -,581 -,00665 -,04076 -,01641
Fp1-β SPD, μV2/Hz -,730 ,353 -,043 -,01569 ,00758 -,00093
F4-θ SPD, μV2/Hz 2,137 ,872 -,013 ,03837 ,01565 -,00024
F4-β SPD, μV2/Hz -,823 -,280 ,529 -,01738 -,00591 ,01116
T6-β SPD, μV2/Hz ,804 ,052 ,304 ,01058 ,00068 ,00400
δ-Laterality Index, % -,811 -,425 -,940 -,02178 -,01141 -,02524
C4-β SPD, % -1,202 -,039 -1,518 -,11814 -,00381 -,14915
α-Frequency, Hz ,454 -,255 ,394 ,60641 -,34076 ,52654
(VLF+LF)/HF as Centralization Index -,008 -,786 ,497 -,00062 -,05843 ,03696
LF/HF as Sympatho/Vagal Balance ,300 ,931 ,053 ,05838 ,18084 ,01030
LF band HRV Spectral Power, msec2 -,778 -,300 -,256 -,00054 -,00021 -,00018
T5-β SPD, % -,414 ,508 ,200 -,02571 ,03154 ,01240
Constants 5,753 -5,076 ,883
Eigenvalues 11,122 4,961 1,917
Cumulative Properties ,618 ,894 1,000
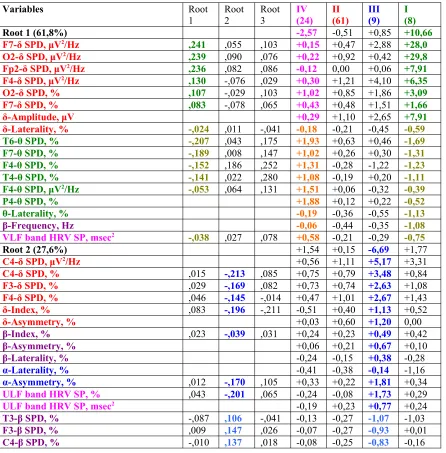
[image:11.612.72.498.72.133.2]Table 4 presents the full structural coefficients, that is, the coefficients of correlation between the discriminant root and variables. The structural coefficient shows how closely variable and discriminant functions are related, that is, what is the fate of information about the discriminant function (root) contained in this variable. There are also average values (centroides) of Roots and Z-scores of Variables.
Table 4. Correlations Variables-Canonical Roots, Means of Roots and Z-scores of Variables
Variables Root
1 Root 2 Root 3 IV(24) II(61) III(9) I(8)
Root 1 (61,8%) -2,57 -0,51 +0,85 +10,66
F7-δ SPD, μV2/Hz ,241 ,055 ,103 +0,15 +0,47 +2,88 +28,0
O2-δ SPD, μV2/Hz ,239 ,090 ,076 +0,22 +0,92 +0,42 +29,8
Fp2-δ SPD, μV2/Hz ,236 ,082 ,086 -0,12 0,00 +0,06 +7,91
F4-δ SPD, μV2/Hz ,130 -,076 ,029 +0,30 +1,21 +4,10 +6,35
O2-δ SPD, % ,107 -,029 ,103 +1,02 +0,85 +1,86 +3,09
F7-δ SPD, % ,083 -,078 ,065 +0,43 +0,48 +1,51 +1,66
δ-Amplitude, μV +0,29 +1,10 +2,65 +7,91
δ-Laterality, % -,024 ,011 -,041 -0,18 -0,21 -0,45 -0,59
T6-θ SPD, % -,207 ,043 ,175 +1,93 +0,63 +0,46 -1,69
F7-θ SPD, % -,189 ,008 ,147 +1,02 +0,26 +0,30 -1,31
F4-θ SPD, % -,152 ,186 ,252 +1,31 -0,28 -1,22 -1,23
T4-θ SPD, % -,141 ,022 ,280 +1,08 -0,19 +0,20 -1,11
F4-θ SPD, μV2/Hz -,053 ,064 ,131 +1,51 +0,06 -0,32 -0,39
P4-θ SPD, % +1,88 +0,12 +0,22 -0,52
θ-Laterality, % -0,19 -0,36 -0,55 -1,13
β-Frequency, Hz -0,06 -0,44 -0,35 -1,08
VLF band HRV SP, msec2 -,038 ,027 ,078 +0,58 -0,21 -0,29 -0,75
Root 2 (27,6%) +1,54 +0,15 -6,69 +1,77
C4-δ SPD, μV2/Hz +0,56 +1,11 +5,17 +3,31
C4-δ SPD, % ,015 -,213 ,085 +0,75 +0,79 +3,48 +0,84
F3-δ SPD, % ,029 -,169 ,082 +0,73 +0,74 +2,63 +1,08
F4-δ SPD, % ,046 -,145 -,014 +0,47 +1,01 +2,67 +1,43
δ-Index, % ,083 -,196 -,211 -0,51 +0,40 +1,13 +0,52
δ-Asymmetry, % +0,03 +0,60 +1,20 0,00
β-Index, % ,023 -,039 ,031 +0,24 +0,23 +0,49 +0,42
β-Asymmetry, % +0,06 +0,21 +0,67 +0,10
β-Laterality, % -0,24 -0,15 +0,38 -0,28
α-Laterality, % -0,41 -0,38 -0,14 -1,16
α-Asymmetry, % ,012 -,170 ,105 +0,33 +0,22 +1,81 +0,34
ULF band HRV SP, % ,043 -,201 ,065 -0,24 -0,08 +1,73 +0,29
ULF band HRV SP, msec2 -0,19 +0,23 +0,77 +0,24
T3-β SPD, % -,087 ,106 -,041 -0,13 -0,27 -1,07 -1,03
F3-β SPD, % ,009 ,147 ,026 -0,07 -0,27 -0,93 +0,01
[image:11.612.74.520.242.695.2]T5-β SPD, % -,038 ,063 ,006 -0,31 -0,44 -0,77 -0,67
Fp1-β SPD, μV2/Hz ,048 ,098 ,045 +0,26 -0,02 -0,71 +1,14
F4-β SPD, μV2/Hz -,010 ,079 ,044 +0,44 +0,05 -0,57 +0,21
T6-β SPD, μV2/Hz ,054 ,070 ,010 -0,19 -0,22 -0,58 +0,52
β-Amplitude, μV -0,22 -0,28 -0,61 +0,16
α-Amplitude, μV -0,57 -0,10 -0,74 -0,07
P4-α SPD, μV2/Hz -0,53 +0,03 -0,72 +0,06
θ-Frequency, Hz -,029 ,072 -,134 -0,46 -0,15 -1,07 -0,69
Fp2-θ SPD, μV2/Hz ,022 ,093 ,108 +1,53 +0,39 -0,43 +2,05
P3-θ SPD, μV2/Hz ,020 ,076 -,018 +0,71 +0,71 -0,53 +1,38
T6-θ SPD, μV2/Hz +1,82 +0,94 -0,16 +1,03
θ-Amplitude, μV +1,15 +0,56 +0,23 +0,98
(VLF+LF)/HF as Centralization Index ,003 ,038 ,093 +2,25 +1,63 +1,59 +2,20
LF/HF as Sympatho/Vagal Balance ,011 ,026 ,029 +1,49 +1,22 +1,21 +2,63
Root 3 (10,6%) +1,98 -1,09 +1,27 +0,92
O2-α SPD, % -,062 ,049 -,273 -0,77 -0,20 -1,10 -1,17
Fp2-α SPD, % -,084 ,049 -,230 -0,63 -0,24 -1,00 -1,24
HF band HRV SP, msec2 -,019 ,029 -,067 +0,28 +0,53 -0,14 -0,06
LF band HRV SP, msec2 -,018 -,004 -,037 +0,92 +1,33 +0,92 -0,05
100•LF/(LF+HF), % +0,32 +0,27 +0,82 +0,90
α-Frequency, Hz -,017 -,009 ,155 +0,50 -0,07 +0,41 +0,10
The localization of the members of the first cluster along the first root axis (Figs. 7 and 8) in the extreme right (positive) zone (centroide: +10,66) reflects drastically increased parameters of EEG which are related to the root positively as well as maximum decreased parameters of EEG&HRV which are related to the root negatively (Table 4). Instead, the fourth cluster has an extreme left (negative) zone (centroide: -2,57), which reflects the minimum/maximum levels of these parameters. The members of the other two clusters occupy an intermediate position and their projections on the axis are mixed. Nevertheless, the positive value of the centroid of the third cluster (+0,85) reflects the higher level of the parameters than in members of the second cluster (centroide: -0,51).
Instead, along the second root axis, members of the third cluster (centroide: -6,69) are clearly separated from the members of both the second and two other clusters whose projections on the axis are mixed (centroides: +1,54; +0,15 and +1,77 for IV, II and I cluster respectively). This disposition reflects the maximum values for EEG&HRV parameters, which are related to the root
negatively, while the minimum values for parameters which is related to the root positively,
while these parameters do not differ significantly from the members of other clusters (Table 4 and Fig. 8).
The separation of the members of the second cluster from the others occurs along the axis of the third root (Table 4, Figs. 10 and 11). The lowest position of its centroid (-1,09) reflects maximum for contingent levels of parameters of EEG&HRV which are related to the root
III I IV II
Root EEG&HRV 1 (61,8%)
R oo t E E G & H R V 2 ( 27 ,6 % ) -9 -8 -7 -6 -5 -4 -3 -2 -1 0 1 2 3 4
[image:13.612.75.541.71.322.2]-4 -3 -2 -1 0 1 2 3 4 5 6 7 8 9 10 11 12
Fig. 7. Individual values of the first and second roots of the EEG&HRV of the members of the four clusters
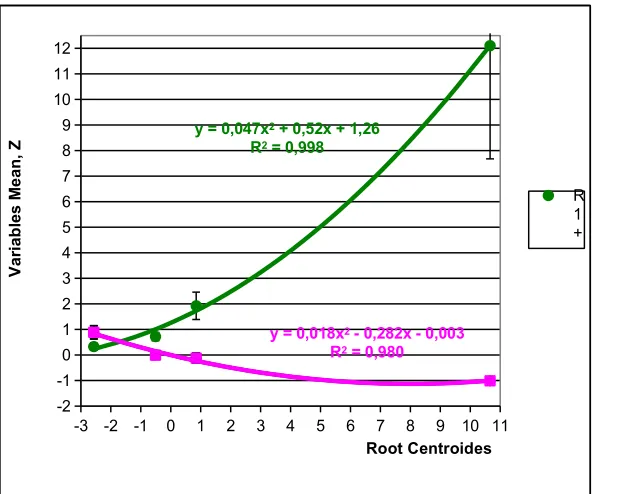
y = 0,018x2 - 0,282x - 0,003
R2 = 0,980
y = 0,047x2 + 0,52x + 1,26
R2 = 0,998
-2 -1 0 1 2 3 4 5 6 7 8 9 10 11 12
-3 -2 -1 0 1 2 3 4 5 6 7 8 9 10 11
V ar ia b le s M e an , Z Root Centroides R 1 +
[image:13.612.74.383.372.619.2]y = 0,0118x2 + 0,168x + 0,08
R2 = 0,987
y = 0,0152x2 + 0,186x + 0,17
R2 = 0,984
-0.5 0.0 0.5 1.0 1.5
-7 -6.5 -6 -5.5 -5 -4.5 -4 -3.5 -3 -2.5 -2 -1.5 -1 -0.5 0 0.5 1 1.5 2
[image:14.612.75.537.76.207.2]V ar ia b le s M ea n , Z Root Centroides R 2 +
Fig. 9. Normalized values (Z±SE) of EEG&HRV parameters condensed in the second root that correlate with it positively or negatively
III I IV II Root EEG&HRV 1 (61,8%)
R oo t E E G & H R V 3 ( 10 ,6 % ) -4 -3 -2 -1 0 1 2 3 4
[image:14.612.71.567.254.447.2]-4 -3 -2 -1 0 1 2 3 4 5 6 7 8 9 10 11 12
Fig. 10. Individual values of the first and third roots of the EEG&HRV of the members of the four clusters
y = -0,114x2 + 0,209x + 0,46 R2 = 0,940
y = 0,304x2 - 0,391x - 0,44 R2 = 0,958
-0.8 -0.4 0.0 0.4 0.8
-1.2 -0.8 -0.4 0 0.4 0.8 1.2 1.6 2
V ar ia b le s M ea n , Z Root Centroides R3 +
[image:14.612.71.486.496.652.2]In general, all four EEG&HRV clusters on the planes of three roots are quite clearly delineated, which is documented by calculating the Mahalanobis distances (Table 5).
Table 5. Squared Mahalanobis Distances between EEG&HRV Clusters and F-values
(df=37,6; for all p<10-6)
Clusters III I IV II
III 0 175 83 56
I 11,2 0 183 137
IV 8,4 16,8 0 16
II 6,8 14,7 4,6 0
The same discriminant parameters can be used to identify (classify) the belonging of one or another person to one or another cluster. This purpose of discriminant analysis is realized with the help of classifying (discriminant) functions (Table 6). These functions are special linear combinations that maximize differences between groups and minimize dispersion within groups. The coefficients of the classifying functions are not standardized, therefore they are not interpreted. An object belongs to a group with the maximum value of a function calculated by summing the products of the values of the variables by the coefficients of the classifying functions plus the constant.
Table 6. Coefficients and Constants for Classification Functions of EEG&HRV Clusters
CLUSTERS III I IV II
Variables currently in the model p=,088 p=,078 p=,235 p=,598
O2-δ SPD, μV2/Hz -,0024 ,0188 -,0081 -,0056
F4-θ SPD, % 3,2303 ,5799 6,6657 5,4926
C4-δ SPD, % -,9456 -1,4043 -1,3655 -1,2759
F7-δ SPD, μV2/Hz ,0049 ,0094 -,0159 -,0098
ULF band HRV Spectral Power, % ,4455 -1,1989 -,4813 -,4897
F3-β SPD, % 2,9908 4,7258 3,8381 3,7972
δ-Index, % ,0774 -,0724 -,1061 -,0454
T6-θ SPD, % -,6276 ,5547 1,3285 ,4972
T3-β SPD, % ,4068 -,0561 ,6202 ,5321
F7-δ SPD, % ,4226 -,4183 ,8960 ,6494
Fp2-δ SPD, μV2/Hz -,0466 -,0204 ,0091 -,0034
α-Asymmetry, % ,6653 -,1485 ,5750 ,5380
Fp2-α SPD, % 2,1118 1,1000 2,3603 2,2332
F3-δ SPD, % 2,4689 2,9290 2,8498 2,8422
O2-δ SPD, % 1,2255 1,6866 1,7855 1,7728
O2-α SPD, % 1,0700 1,7906 1,7917 1,9184
HF band HRV Spectral Power, msec2 -,0064 ,0084 -,0081 -,0051
T4-θ SPD, % 3,0162 1,5949 1,4425 1,2344
F4-δ SPD, % ,1915 ,1958 ,6741 ,7065
θ-Frequency, Hz 14,95 12,75 10,52 11,76
β-Index, % ,5922 1,1909 ,4589 ,4953
F7-θ SPD, % 1,8221 -,2082 1,6951 1,5206
F4-δ SPD, μV2/Hz ,0905 ,0329 ,0416 ,0442
P3-θ SPD, μV2/Hz ,0128 ,0811 ,1501 ,1444
[image:15.612.73.433.359.690.2]Fp1-β SPD, μV2/Hz -,1760 -,2654 -,0606 -,1005
F4-θ SPD, μV2/Hz -,6814 -,1726 -,6840 -,6263
F4-β SPD, μV2/Hz ,2714 ,0470 ,2902 ,2285
T6-β SPD, μV2/Hz -,0743 ,0339 -,1020 -,0935
δ-Laterality, % ,1901 -,1112 ,1527 ,2014
C4-β SPD, % ,0960 -1,0422 ,3624 ,5833
α-Frequency, Hz 32,03 34,90 27,52 27,62
(VLF+LF)/HF as Centralization Index ,1443 -,3692 -,3081 -,3416
LF/HF as Sympatho/Vagal Balance 1,0620 3,1609 2,3579 2,1946
VLF band HRV Spectral Power, msec2 -,0031 -,0011 -,0017 -,0026
LF band HRV Spectral Power, msec2 ,0061 -,0008 ,0061 ,0058
T5-β SPD, % ,2135 ,2239 ,5699 ,4352
Constants -455,7 -477,9 -498,5 -475,7
In this case, we can retrospectively recognize members of third and first clusters
[image:16.612.71.442.70.232.2]unmistakably, the second cluster is classified with one mistake, and only the fourth cluster with three errors. Overall classification accuracy is 96,1% (Table 7).
Table 7. Classification Matrix for EEG&HRV Clusters
Rows: Observed classifications; Columns: Predicted classifications
Clusters III I IV II
Clusters % correct p=,088 p=,078 p=,235 p=,598
III 100 9 0 0 0
I 100 0 8 0 0
IV 87,5 0 0 21 3
II 98,4 0 0 1 60
Total 96,1 9 8 22 63
Thus, quantitatively and qualitatively distinct from each other, the clusters of entropy of SPD of EEG that we have detected clearly differ from each other in at least 37 amplitude-frequency and spectral parameters of EEG as well as HRV, the information of which is condensed in three discriminant roots. Significantly, each root contains information about HRV parameters, which is quite expected in the light of their previously found links with the electrical and morpho-functional correlates of activity of cortex and subcortical structures [3,4,7,9,10,14-16,19-26].
Unfortunately, our device does not have the option "Tomography", so we can only assume that loci C3 and C4 projected hippocampus, and loci T3 and T4 reflect the activity of the amygdala [17]. It is more likely that the frontal loci record the activity of anterior cingulate [3] as well as orbito-frontal cortex. It is shown that the cortical thickness of an area within these regions is positively correlated with two HRV markers of parasympathetic activity both HF [7,25] and RMSSD [26].
YY Tang et al. [20] analysed the correlation between the changes in frontal midline θ power (related to generators in the anterior cingulate cortex [3]) and HFnu HRV. After 5 days of integrative body-mind training correlations between HFnu and Fz-θ, FCz-θ as well as Cz-θ were significantly positive. Previously we [15] also found correlations between HFnu and F4-θ and P4-θ, between HF% and Fp1-θ and P4-θ also between RMSSD and P4-θ.
stress, accompanied by higher relative SPD Fz-θ, Pz-θ and Cz-θ, lower fronto-central relative β power and higher θ/β ratio. It is also perfectly consistent with our [15] data on a negative correlation LFnu, LF% and LF/HF with F4-θ, P4-θ, F7-θ, F8-θ and positive correlation with F7-β and F8-β - on the one hand, and a positive correlation HF% with Fp1-θ and P4-θ and negative with P4-β - on the other side.
As the discussion on the neural correlates of LF, VLF and ULF bands of HRV continues, we consider it appropriate to provide our own data on their relationship. We found that the commonly recognized vagus markers HF and RMSSD, closely correlating with each other (r=0,93) and moderately negative with the sympathetic markers LFnu (-0,47 and -0,55) as well as LF/HF (-0,35 and -0,44), correlate positively strongly with LF (0,83 and 0,77) and medially with VLF (0,44 and 0,57) as well as ULF (0,47 and 0,45), then there are no correlation of these HRV bands with sympathetic markers (r=-0.18÷-0.08). Therefore, in our study, the LF band reflects the vagal tone definitely, which was maximal in individuals with normal entropy.
ACKNOWLEDGMENT
We express sincere gratitude to administration of JSC “Truskavets’kurort” and “Truskavets’ SPA” as well as clinical sanatorium “Moldova” for help in conducting this investigation.
ACCORDANCE TO ETHICS STANDARDS
Tests in patients are conducted in accordance with positions of Helsinki Declaration 1975, revised and complemented in 2002, and directive of National Committee on ethics of scientific researches. During realization of tests from all participants the informed consent is got and used all measures for providing of anonymity of participants.
For all authors any conflict of interests is absent.
References
1. Baevskiy RM, Ivanov GG. Heart Rate Variability: theoretical aspects and possibilities of clinical application [in Russian]. Ultrazvukovaya i funktsionalnaya diagnostika. 2001; 3: 106-127.
2. Berntson GG, Bigger JT jr, Eckberg DL, Grossman P, Kaufman PG, Malik M, Nagaraja HN, Porges SW, Saul JP, Stone PH, Van der Molen MW. Heart Rate Variability: Origines, methods, and interpretive caveats. Psychophysiology. 1997; 34: 623-648.
3. Cahn BR, Polish J. Psychological bulletin meditation states and traits: EEG, ERP and neuroimaging studies. Psychol. Bull. 2006; 132: 180-211.
4. Critchley HD. Neural mechanisms of autonomic, affective, and cognitive integration. J. Comp. Neurol. 2005; 493: 154-166.
5. Heart Rate Variability. Standards of Measurement, Physiological Interpretation, and Clinical Use. Task Force of ESC and NASPE. Circulation. 1996; 93(5): 1043-1065.
6. Klecka WR. Discriminant Analysis [trans. from English in Russian] (Seventh Printing, 1986). In: Factor, Discriminant and Cluster Analysis. Moskva: Finansy i Statistika; 1989: 78-138.
22(3): 1151-1156.
8. Newberg AB, Alavi A, Baime M, Pourdehnad M, Santanna J, d’Aquili E. The measurement of regional cerebral blood flow during the complex cognitive task of meditation: a preliminary SPECT study. Psychiatry Research: Neuroimaging Section. 2001; 106: 113-122. 9. Ohtake Y, Hamada T, Murata T et al. The assotiation between autonomic response status and the changes in EEG activity during mental arithmetic task. Rinsho Byori. 2007; 55(12): 1075-1079.
10. Oppenheimer SM, Kedem G, Martin WM. Left-insular cortex lesions perturb cardiac autonomic tone in humans. Clin. Auton. Res. 1996; 6: 131-140.
11. Popadynets’ OO, Gozhenko AI, Zukow W, Popovych IL. Relationships between the entropies of EEG, HRV, immunocytogram and leukocytogram. Journal of Education, Health and Sport. 2019; 9(5): 651-666.
12. Popadynets’ OO, Gozhenko AI, Zukow W, Popovych IL. Interpersonal differences between of the entropies of EEG, HRV, immunocytogram and leukocytogram. Journal of Education, Health and Sport. 2019; 9(6): 534-545.
13. Popоvych IL. Information effects of bioactive water Naftyssya in rats: modulation entropic, prevention desynchronizing and limitation of disharmonizing actions water immersion stress for information components of neuro-endocrine-immune system and metabolism, which correlates with gastroprotective effect [in Ukrainian]. Medical Hydrology and Rehabilitation. 2007; 5(3): 50-70.
14. Popovych IL, Kozyavkina OV, Kozyavkina NV, Korolyshyn TA, Lukovych YuS, Barylyak
LG. Correlation between Indices of the Heart Rate Variability and Parameters of Ongoing EEG in Patients Suffering from Chronic Renal Pathology. Neurophysiology. 2014; 46(2): 139-148.
15. Popovych IL, Lukovych YuS, Korolyshyn TA, Barylyak LG, Kovalska LB, Zukow W.
Relationship between the parameters heart rate variability and background EEG activity in healthy men. Journal of Health Sciences. 2013; 3(4): 217-240.
16. Prinsloo GE, Rauch HG, Karpul D, Derman WE. The effect of a Single Session of Short
Duration Heart Rate Variability Biofeedback on EEG: A Pilot Study. Appl. Psychophysiol.
Biofeedback. 2013;38(1): 45-56.
17. Romodanov AP (editor). Postradiation Encephalopathy. Experimental Researches and Clinical Observations [in Ukrainian and Russian]. Kyiv. USRI of Neurosurgery; 1993: 224 p. 18. Shannon CE. Works on the theory of informatics and cybernetics [transl. from English to
Russian]. Moskwa: Inostrannaya literatura; 1963: 329 p.
19. Subhani AR, Likun X, Saeed Malik A. Assotiation of autonomic nervous system and EEG
scalp potential during playing 2D Grand Turismo 5. Conf. Proc. IEEE Eng. Med. Biol. Soc.
2012:3420-3423.
20. Tang YY, Ma Y, Fan Y et al. Central and autonomic nervous system interaction is altered by
short-term meditation. Proc. Natl. Acad. Sci. USA. 2009; 106(22): 8865-8870.
21. Tiinanen S, Määttä A, Silverhuth M. et al. HRV and EEG based indicators of stress in
children with Asperger syndrome in audio-visual stimulus test. Conf. Proc. IEEE Eng. Med.
Biol. Soc. 2011:2021-2024.
22. Tolkunov D, Rubin D, Mujica-Parodi LR. Power spectrum scale invariance quantifies limbic
50(1): 72-82.
23. Vanneste S, De Ridder D. Brain Areas Controlling Heart Rate Variability in Tinnitus and
Tinnitus-Related Distress. PloS ONE. 2013; 8(3): e59728.
24. Wahbeh H, Oken BS. Peak High-Frequency HRV amd Peak Alpha Frequency Higher in
PTSD. Appl. Psychophysiol. Biofeedback. 2013;38(1): 57-69.
25. Winkelmann T, Thayer JF, Pohlak ST, Nees F, Grimm O, Flor H. Structural brain correlates
of heart rate variability in healthy young adult population. Brain Structure and Function. 2017; 222(2): 1061-1068.
26. Yoo HJ, Thayer JF, Greenig S, Lee TH,, Ponzio A, Min J, Sakaki M, Nga L, Mater M,
Koenig J. Brain structural concomitants of resting state heart rate variability in the young and old: evidence from two independent samples. Brain Structure and Function. 2018; 223(2): 727-737.
![Fig. 1. Z-scores (M±SE) of entropy of SPD in loci of EEG as well as of HRV, LCG and ICGin members of various clusters [12]](https://thumb-us.123doks.com/thumbv2/123dok_us/8219283.265328/2.612.74.566.348.526/fig-scores-entropy-spd-icgin-members-various-clusters.webp)