Overview of the Chinese Word Sense Induction Task at CLP2010
Le Sun
Institute of Software
Chinese Academy of
Sciences
[email protected]
Zhenzhong Zhang
Institute of Software, Graduate
University Chinese Academy of
Sciences
[email protected]
Qiang Dong
Canada Keentime Inc.
dongqiang@keenage.
com
Abstract
In this paper, we describe the Chinese word sense induction task at CLP2010. Seventeen teams participated in this task and nineteen system results were submitted. All participant systems are evaluated on a dataset containing 100 target words and 5000 instances using the standard cluster evaluation. We will describe the participating systems and the evaluation results, and then find the most suitable method by comparing the different Chinese word sense induction systems.
1
Introduction
Word Sense Disambiguation (WSD) is an important task in natural language proceeding research and is critical to many applications which require language understanding. In traditional evaluations, the supervised methods usually can achieve a better WSD performance than the unsupervised methods. But the supervised WSD methods have some drawbacks: Firstly, they need large annotated dataset which is expensive to manually annotate (Agirre and Aitor, 2007). Secondly, the supervised WSD methods are based on the “fixed-list of senses” paradigm, i.e., the senses of a target word are represented as a closed list coming from a manually constructed dictionary (Agirre et al., 2006). Such a “Fixed-list of senses” paradigm suffers from the lack of explicit and topic relations between word senses, are usually cannot reflect the exact context of the target word (Veronis, 2004). Furthermore, because the “fixed-list of senses” paradigm make the fix granularity assumption of the senses distinction,
it may not be suitable in different situations (Samuel and Mirella, 2009). Thirdly, since most supervised WSD methods assign senses based on dictionaries or other lexical resources, it will be difficult to adapt them to new domains or languages when such resources are scare (Samuel and Mirella, 2009).
To overcome the deficiencies of the supervised WSD methods, many unsupervised WSD methods have been developed in recent years, which can induce word senses directly from the unannotated dataset, i.e., Word Sense Induction (WSI). In this sense, WSI could be treat as a clustering task, which groups the instances of the target word according to their contextual similarity, with each resulting cluster corresponding to a specific “word sense” or “word use” of the target word (in the task of WSI, the term “word use” is more suitable than “word sense”(Agirre and Aitor, 2007)).
Although traditional clustering techniques can be directly employed in WSI, in recent years some new methods have been proposed to enhance the WSI performance, such as the Bayesian approach (Samuel and Mirella, 2009) and the collocation graph approach (Ioannis and Suresh, 2008). Both the traditional and the new methods can achieve a good performance in the task of English word sense induction. However, the methods work well in English may not be suitable for Chinese due to the difference between Chinese and English. So it is both important and critical to provide a standard testbed for the task of Chinese word sense induction (CWSI), in order to compare the performance of different Chinese WSI methods and find the methods which are suitable for the Chinese word sense induction task.
this task is to provide a standard testbed for Chinese WSI task. By comparing the different Chinese WSI methods, we can find the suitable methods for the Chinese word sense induction task.
This paper is organized as follow. Section 2 describes the evaluation dataset in detail. Section 3 demonstrates the evaluation criteria. Section 3 describes the participated systems and their results. The conclusions are drawn in section 4.
2
Dataset
Two datasets are provided to the participants: the trial dataset and the test dataset.
The trial dataset contains 50 Chinese words, and for each Chinese word, a set of 50 word instances are provided. All word instances are extracted from the Web and the newspapers like the Xinhua newspaper and the Renmin newspaper, and the HowNet senses of target words were manually annotated (Dong). Figure 1 shows an example of the trial data without hand-annotated tag. Figure 2 shows an example of the trial data with hand-annotated tag. In Figure 1, the tag “snum=2” indicates that the target word “杜鹃” has two different senses in this dataset. In each instance, the target word is marked between the tag “<head>” and the tag “</head>”. In Figure 2, all instances between the tag “<sense s=S0>” and the tag “</sense>” are belong to the same sense class.
Figure 1: Example of the trial data without hand-annotated tag.
The case of the test dataset is similar to the trial dataset, but with little different in the number of target words. The test dataset contains 100 target words (22 Chinese words containing one Chinese character and 78 Chinese words
containing two or more Chinese ideographs). Figure 3 shows an example of a system’s output. In Figure 3, the first column represents the identifiers of target word, the second column represents the identifiers of instances, and the third column represents the identifiers of the resulting clusters and their weight (1.0 by default) generated by Chinese WSI systems.
Figure 2: Example of the trial data with hand-annotated tag.
Figure 3: Example of the output format.
3
Evaluation Metric
As described in Section 1, WSI could be conceptualized as a clustering problem. So we can measure the performance of WSI systems using the standard cluster evaluation metrics. As the same as Zhao and Karypis(2005), we use the FScore measure as the primary measure for assessing different WSI methods. The FScore is used in a similar way as at Information Retrieval field.
Let the size of a particular class sr is nr, the
size of a particular cluster hj is nj and the size of
their common instances set is nr,j.,then the
precision can be defined as:
,
( ,r j) r j
j n P s h
n
=
The recall can be defined as:
,
( ,
r j)
r j rn
R s h
n
=
Then FScore of this class and cluster is defined to be:
2 ( , ) ( , )
( , )
( , ) ( , )
r j r j r j
r j r j
P s h R s h F s h
P s h R s h
× ×
=
+
The FScore of a class sr, F(sr), is the maximum
F(sr, hj) value attained by any cluster, and it is
defined as:
( ) max( ( , ))
j
r r j
h
F s = F s h
Finally, the FScore of the entire clustering solution is defined as the weighted average FScore of all class:
1
( ) q
r r
r
n F s FScore
n =
×
=
∑
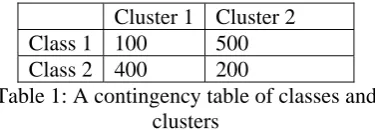
where q is the number of classes and n is the size of the instance set for particular target word. Table 1 shows an example of a contingency table of classes and clusters, which can be used to calculate FScore.
[image:3.595.89.277.479.544.2]Cluster 1 Cluster 2 Class 1 100 500 Class 2 400 200
Table 1: A contingency table of classes and clusters
Using this contingency table, we can calculate the FScore of this example is 0.7483. It is easy to know the FScore of a perfect clustering solution will be equal to one, where each cluster has exactly the same instances as one of the classes, and vice versa. This means that the higher the FScore, the better the clustering performance.
Purity and entropy (Zhao and Karypis, 2005) are also used to measure the performance of the clustering solution. Compared to FScore, they have some disadvantages. FScore uses two complementary concepts, precision and recall, to
assess the quality of a clustering solution. Precision indicates the degree of the instances that make up a cluster, which belong to a single class. On the other hand, recall indicates the degree of the instances that make up a class, which belong to a single cluster. But purity and entropy only consider one factor and discard another. So we use FScore measure to assess a clustering solution.
For the sake of completeness, we also employ the V-Measure to assess different clustering solutions. V-Measure assesses a cluster solution by considering its homogeneity and its completeness (Rosenberg and Hirschberg, 2007). Homogeneity measures the degree that each cluster contains data points which belong to a single Gold Standard class. And completeness measures the degree that each Gold Standard class contains data points assigned to a single cluster (Rosenberg and Hirschberg, 2007). In general, the larger the V-Measure, the better the clustering performance. More details can be referred to (Rosenberg and Hirschberg, 2007).
4
Results
In this section we describe the participant systems and present their results.
Since the size of test data may not be large enough to distinguish word senses, participants were provided the total number of the target word’s senses. And participants were also allowed to use extra resources without hand-annotated.
4.1 Participant teams and systems
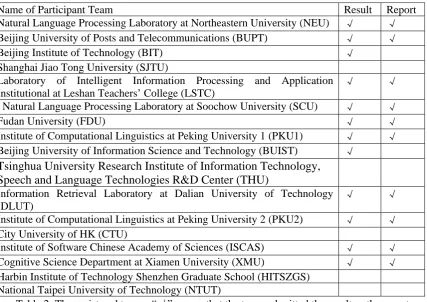
There were 17 teams registered for the WSI task and 12 teams submitted their results. Totally 19 participant system results were submitted (One was submitted after the deadline). 10 teams submitted their technical reports. Table 2 demonstrates the statistics of the participant information.
The methods used by the participated systems were described as follows:
Bottleneck algorithm was used to group instances into clusters.
BUPT: Three clustering algorithms- the k-means algorithm, the Expectation- maximization algorithm and the Locally Adaptive Clustering algorithm were employed to
cluster instances, where all instances were represented using some combined features. In the end the Group-average agglomerative clustering was used to cluster the consensus matrix M, which was obtained from the
Name of Participant Team Result Report
Natural Language Processing Laboratory at Northeastern University (NEU) √ √ Beijing University of Posts and Telecommunications (BUPT) √ √
Beijing Institute of Technology (BIT) √
Shanghai Jiao Tong University (SJTU)
Laboratory of Intelligent Information Processing and Application Institutional at Leshan Teachers’ College (LSTC)
√ √
Natural Language Processing Laboratory at Soochow University (SCU) √ √
Fudan University (FDU) √ √
Institute of Computational Linguistics at Peking University 1 (PKU1) √ √ Beijing University of Information Science and Technology (BUIST) √
Tsinghua University Research Institute of Information Technology,
Speech and Language Technologies R&D Center (THU)
Information Retrieval Laboratory at Dalian University of Technology (DLUT)
√ √
Institute of Computational Linguistics at Peking University 2 (PKU2) √ √ City University of HK (CTU)
Institute of Software Chinese Academy of Sciences (ISCAS) √ √ Cognitive Science Department at Xiamen University (XMU) √ √ Harbin Institute of Technology Shenzhen Graduate School (HITSZGS)
[image:4.595.89.517.158.460.2]National Taipei University of Technology (NTUT)
Table 2: The registered teams. “√” means that the team submitted the result or the report.
adjacency matrices of the individual clusters generated by the three single clustering algorithms mentioned above.
LSTC: This team extracted the five neighbor words and their POSs around the target word as features. Then the k-means algorithm was used to cluster the instances of each target word.
NEU: The “Global collocation” and the “local collocation” were extracted as features. A constraint hierarchical clustering algorithm was used to cluster the instances of each target word.
XMU: The neighbor words of the target word were extracted as features and TongYiCi CiLin1 was employed to measure the similarity between instances. The word instances are
1
http://www.ir‐lab.org/
clustered using the improved hierarchical clustering algorithm based on parts of speech.
DLUT: This team used the information gain to determine the size of the feature window. TongYiCi CiLin was used to solve the data sparseness problem. The word instances are clustered using an improvement k-means algorithm where k-initial centers were selected based on maximum distance.
ISCAS: This team employed k-means
guaranty all participants are under the same conditions.
PKU2: This team used local tokens, local bigram feature and topical feature to represent words as vectors. Spectral clustering method was used to cluster the instances of each target word.
PKU1: This team extracted three types of features to represent instances as feature vectors. Then the clustering was done by using k-means algorithm.
SCU: All words except stop words in instances were extracted to produce the feature vectors, based on which the similarity matrix were generated. After that, the spectral clustering algorithm was applied to group instances into clusters.
4.2 Official Results
In this section we present the official results of the participant systems (ISCAS* was submitted by organizers; BUIST** was submitted after the deadline). We also provide the result of a baseline -- 1c1w, which group all instances of a target word into a single cluster.
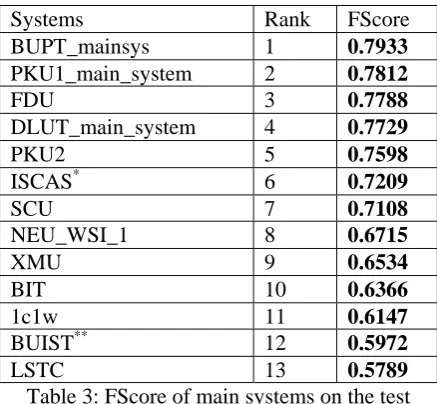
Table 3 shows the FScore of the main systems submitted by participant teams on the test dataset. Table 4 shows the FScore and V-Measure of all participant systems. Systems were ranked according to their FScore.
Systems Rank FScore
BUPT_mainsys 1 0.7933
PKU1_main_system 2 0.7812
FDU 3 0.7788
DLUT_main_system 4 0.7729
PKU2 5 0.7598
ISCAS* 6 0.7209
SCU 7 0.7108
NEU_WSI_1 8 0.6715
XMU 9 0.6534
BIT 10 0.6366
1c1w 11 0.6147
BUIST** 12 0.5972
[image:5.595.302.530.82.397.2]LSTC 13 0.5789
Table 3: FScore of main systems on the test dataset including one baseline -1c1w.
Systems Rank FScore V-
Measure BUPT_mainsys 1 0.7933 0.4628
BUPT_LAC 2 0.7895 0.4538
BUPT_EM 3 0.7855 0.4356
BUPT_kmeans 4 0.7849 0.4472
PKU1_main_system 5 0.7812 0.4300
FDU 6 0.7788 0.4196
DLUT_main_system 7 0.7729 0.5032
PKU1_agglo 8 0.7651 0.4096
PKU2 9 0.7598 0.4078
ISCAS* 10 0.7209 0.3174
SCU 11 0.7108 0.3131
NEU_WSI_1 12 0.6715 0.2331
XMU 13 0.6534 0.1954
NEU_WSI_0 14 0.6520 0.1947
BIT 15 0.6366 0.1713
1c1w 16 0.6147 0.0
DLUT_RUN2 17 0.6067 0.1192
BUIST** 18 0.5972 0.1014
DLUT_RUN3 19 0.5882 0.0906
[image:5.595.71.290.463.665.2]LSTC 20 0.5789 0.0535
Table 4: FScore and V-Measure of all systems, including one baseline.
From the results shown in Table 3 and 4, we can see that:
1) As described in section 4.1, most systems use traditional clustering methods. For example, the teams using the k-means algorithm contain BUPT, LSTC, PKU1, DLUT and ISCAS. The teams using the spectral clustering algorithm contain SCU and PKU2. The team XMU and NEU use hierarchical clustering algorithm. The results shows that if provided with the number of target word senses, traditional methods can achieve a good performance. But we also notice that even the same method can have a different performance. This seems to indicate that features which are predictive of word senses are important to the task of CWSI.
3) The rank of FScore is much the same as that of V-Measure but with little difference. This may be because that the two evaluation measures both assess quality of a clustering solution by considering two different aspects, where precision corresponds to homogeneity and recall corresponds to completeness. But when assessing the quality of a clustering solution, the FScore only considers the contributions from the classes which are most similar to the clusters while the V-Measure considers the contributions from all classes.
Systems Characters Words
BUPT_mainsys 0.6307 0.8392
BUPT_LAC 0.6298 0.8346
BUPT_EM 0.6191 0.8324
BUPT_kmeans 0.6104 0.8341
PKU1_main_system 0.6291 0.8240
FDU 0.6964 0.8020
DLUT_main_system 0.5178 0.8448
PKU1_agglo 0.5946 0.8132
PKU2 0.6157 0.8004
ISCAS* 0.5639 0.7651
SCU 0.5715 0.7501
NEU_WSI_1 0.5786 0.6977
XMU 0.5290 0.6885
NEU_WSI_0 0.5439 0.6825
BIT 0.5328 0.6659
DLUT_RUN2 0.5196 0.6313
BUIST** 0.5022 0.6240
DLUT_RUN3 0.5066 0.6113
LSTC 0.4648 0.6110
1c1w 0.4611 0.6581
Table 5: FScore of all systems on the dataset only containing either single characters or
words respectively.
A Chinese word can be constituted by single or multiple Chinese characters. Senses of Chinese characters are usually determined by the words containing the character. In order to compare the WSI performance on different granularity of words, we add 22 Chinese characters into the test corpus. Table 5 shows the results of the participant systems correspondingly on the corpus which only contains the 22 Chinese characters and the
corpus which only contains the 78 Chinese words.
From Table 5, we can see that:
1) The FScore of systems on the corpus only containing single characters is significantly lower than that on the corpus only containing words. We believe this is because: 1) The Single Chinese characters usually contains more senses than Chinese words; 2) Their senses are not determined directly by their contexts but by the words containing them. Compared to the number of instances, the number of words containing the single character is large. So it is difficult to distinguish different senses of single characters because of the data sparseness.
2) We noticed that all systems outperform the 1c1w baseline on the corpus only containing single characters but there are some systems’ FScore are lower than the baseline on the corpus only containing words. It may be because the large number of characters’ senses and the FScore favored the words which have small number of senses.
5
Conclusions
In this paper we describe the design and the results of CLP2010 back-off task 4-Chinese word sense induction task. 17 teams registered to this task and 12 teams submitted their results. In total there were 19 participant systems (One of them was submitted after the deadline). And 10 teams submitted their technical reports. All systems are evaluated on a corpus containing 100 target words and 5000 instances using FScore measure and V-Measure. Participants are also provided with the number of senses and allowed to use resources without hand-annotated.
target word senses will not be provided and will leave as an open task to the participant systems.
Acknowledgments
This work has been partially funded by National Natural Science Foundation of China under grant #60773027, #60736044 and #90920010 and by “863” Key Projects #2006AA010108, “863” Projects #2008AA01Z145. We would like to thank Dr. Han Xianpei and Zhang Weiru for their detailed comments. We also want to thank the annotators for their hard work on preparing the trial and test dataset.
References
Andrew Rosenberg and Julia Hirschberg. 2007. V-Measure: A conditional entropy-based external cluster evaluation measure. In Proceedings of the 2007 Joint Conference on Empirical Methods in Natural Language Processing and Computational Natural Language Learning (EMNLP-CoNLL), pages 410–420.
Eneko Agirre, David Mart´ınez, Oier L´opez de Lacalle,and Aitor Soroa. 2006. Two graph-based algorithms for state-of-the-art WSD. In Proceedings of the 2006 Conference on Empirical Methods in Natural Language Processing, pages 585–593, Sydney, Australia.
Eneko Agirre and Aitor Soroa. 2007. Semeval-2007 task2: Evaluating word sense induction and discrimination systems. In Proceedings of SemEval-2007. Association for Computational Llinguistics, pages 7-12, Prague.
Ioannis P. Klapaftis and Suresh Manandhar, 2008. Word Sense Induction Using Graphs of Collocations. In Proceeding of the 2008 conference on 18th European Conference on Artificial Intelligence, Pages: 298-302.
Jean. V´eronis. 2004. Hyperlex: lexical cartography for information retrieval. Computer Speech & Language,18(3):223.252.
Samuel Brody and Mirella Lapata, 2009. Bayesian word sense induction. In Proceedings of the 12th Conference of the European Chapter of the Association for Computational Linguistics, pages 103-111, Athens, Greece.
Ying Zhao and George Karypis. 2005. Hierarchical clustering algorithms for document datasets. Data Mining and Knowledge Discovery,10(2):141.168.
Zhendong Dong,