www.ann-geophys.net/24/1429/2006/ © European Geosciences Union 2006
Annales
Geophysicae
Equatorial scintillations in relation to the development of ionization
anomaly
S. Ray1, A. Paul2, and A. DasGupta1,2
1S. K. Mitra Center for Research in Space Enviornment, University of Calcutta, Calcutta, India 2Institute of Radio Physics and Electronics, University of Calcutta, Calcutta, India
Received: 1 September 2005 – Revised: 19 December 2005 – Accepted: 2 February 2006 – Published: 3 July 2006 Part of Special Issue “The 11th International Symposium on Equatorial Aeronomy (ISEA-11), Taipei, May 2005”
Abstract. The irregularities in the electron density distribu-tion of the ionosphere over the equatorial region frequently disrupt space-based communication and navigation links by causing severe amplitude and phase scintillations of signals. Development of a specification and forecast system for scin-tillations is needed in view of the increased reliance on space-based communication and navigation systems, which are vul-nerable to ionospheric scintillations. It has been suggested in recent years that a developed equatorial anomaly in the afternoon hours, with a steep gradient of the F-region ion-ization or Total Electron Content (TEC) in the region be-tween the crest and the trough, may be taken as a precur-sor to scintillations on transionospheric links. Latitudinal gradient of TEC measured using Faraday Rotation technique from LEO NOAA 12/14 transmissions during the afternoon hours at Calcutta shows a highly significant association with L-band scintillations recorded on the INMARSAT link, also from Calcutta, during the equinoxes, August through Octo-ber 2000, and February through April 2001.
The daytime equatorial electrojet is believed to control the development of the equatorial anomaly and plays a cru-cial role in the subsequent development of F-region irreg-ularities in the post-sunset hours. The diurnal maximum and integrated value (integrated from the time of onset of plasma influx to off-equatorial latitudes till local sunset) of the strength of the electrojet in the Indian longitude sector shows a significant association with post-sunset L-band scin-tillations recorded at Calcutta during the two equinoxes men-tioned earlier.
Generation of equatorial irregularities over the magnetic equator in the post-sunset hours is intimately related to the variation of the height of the F-layer around sunset. Ionosonde data from Kodaikanal, a station situated close to the magnetic equator, has been utilized to calculate the vertical drift of the F-layer over the magnetic equator for Correspondence to: A. DasGupta
the period August through October 2000. The post-sunset F-region height rise over the magnetic equator shows a re-markable correspondence with the occurrence of scintilla-tions at Calcutta located near the northern crest of the equa-torial anomaly.
Existence of a flat-topped ionization distribution over the magnetic equator around sunset has been suggested as a pos-sible indication of occurrence of post-sunset scintillations. Width of the latitudinal distribution of ionization obtained from DMSP satellite shows some correspondence with post-sunset L-band scintillations. During the period of observa-tion of the present study (August through October 2000, and February through April 2001), it has been observed that al-though the probability of occurrence of scintillations is high on days with flat-topped ion density variation over the equa-tor, there are cases when no scintillations were observed even when a pronounced flat top variation was recorded.
Keywords. Ionosphere (Equatorial ionosphere; Ionospheric irregularities; Modeling and forecasting)
1 Introduction
1430 S. Ray et al.: Equatorial scintillations in relation to the development of ionization anomaly as irregular features of ionization in the upper atmosphere is
essential.
The Earth’s ionized upper atmosphere often becomes tur-bulent and develops electron density irregularities. In the presence of a relative motion between the satellite, the iono-sphere and the receiver, the received signal exhibits ampli-tude and phase scintillations. Ampliampli-tude scintillations cause signals to fade below the average level. When the depth of fading exceeds the fade margin of a receiver, the signal be-comes buried in noise and signal loss and cycle slips are en-countered. Phase scintillations induce a frequency shift and when this shift exceeds the phase locked loop bandwidth, the signal is lost and the receiver spends valuable time reac-quiring the signal. Overall, in the presence of scintillations, the performance of communication and navigation systems is degraded.
These propagation effects are most severe around the mag-netic equator and the crests of the equatorial anomaly in the early evening hours. The morphology of the equatorial iono-sphere is quite different from that at other latitudes because the magnetic fieldBis nearly parallel to the Earth’s surface. During daytime, the E-region dynamo electric fieldEis east-ward. Due to the “fountain effect”, the resultingE×Bdrift transports F-region plasma upward at the magnetic equator. The uplifted plasma then moves alongBin response to grav-ity and pressure-gradient forces. As a result, the equatorial anomaly is formed with minimum F-region ionization den-sity at the magnetic equator and maxima at the two crests approximately 15◦ to 20◦ in magnetic latitude to the north and south.
Near sunset, plasma densities and dynamo electric fields in the E-region decrease, and the equatorial anomaly begins to weaken. However, at this local time, a dynamo develops in the F-region. Polarization charges within conductivity gradi-ents at the terminator enhance the eastward electric field after sunset. The post-sunset electric field moves the ionospheric plasma upward, allowing the equatorial anomaly crests to in-tensify. After sunset, F-region dynamo currents are no longer subject to the shorting effect of the conducting E-layer to the north and south of the magnetic equator. Polarization fields are thus able to drive the F-layer upwards. Eventually the electric field turns westward, causing plasma to drift down-ward. Just before the reversal at the time of sunset, the field is much enhanced (Rishbeth, 1971). This is called the post-sunset or the pre-reversal enhancement of the eastward elec-tric field. The pre-reversal enhancement holds the key to the formation of irregularities. This causes a rapid uplifting of the F-region, and steepens the bottomside gradient leading to the Rayleigh-Taylor (R-T) instability. Soon after sunset, ver-tical plasma density gradients form in the bottom side of the F layer. The upward density gradient is opposite in direction to the gravitational force. This configuration is R-T unsta-ble and allows plasma density irregularities to form. These irregularities can grow to become large ionospheric deple-tions often called equatorial plasma bubbles. Recent
investi-gations leave open the scientific question of whether an en-hancement in upwardE×Bdrift is necessary and sufficient or simply necessary for creating the ambient conditions con-ducive to scintillation occurrence (Anderson et al., 2004). It is suggested that there exists a “threshold” inE×Bdrift that determines whether subsequent scintillation activity will oc-cur or not. This implies that theE×B drift velocity needs to be above a certain value before bottom-side spread F can percolate upward and form equatorial bubbles, and the ‘seed-ing’ mechanism is always present and all that is required is for theE×B drift velocity to be greater than some critical value.
Development of a specification and forecast methodol-ogy for scintillations is needed in view of the increased re-liance on space-based communication and navigation sys-tems, which are vulnerable to ionospheric scintillations. It has been suggested in recent years that there is a correspon-dence between the development of the electrojet during the daytime and the post-sunset enhancement of the eastward electric field although the physical mechanism connecting the two is not fully clear. The equatorial electrojet controls the development of the equatorial anomaly through the foun-tain effect. Under strong electrojet conditions, the anomaly is developed in the afternoon hours with a steep gradient of the F-region ionization or Total Electron Content (TEC) in the region between the crest and the trough. Thus a measurement of the latitudinal gradient of electron content would provide an indication of the post-sunset eastward electric field en-hancement and could validate the above suggestion. A de-veloped equatorial anomaly in the afternoon hours may then be taken as a precursor to scintillations on transionospheric links (Raghavarao et al., 1988). In the early days of satellite beacon observations, Faraday Rotation measurements with transmissions from Low Earth Orbiting (LEO) satellites have been utilized to show that the TEC exhibits a pronounced lat-itudinal variation similar to that observed with the F-region maximum ionization (NmF2) (Basu and DasGupta., 1967). In recent years however, such measurements have been rare because of non-availability of suitable satellite transmissions. The only available satellites of the NOAA series transmit-ting plane-polarized signals at 136/137 MHz may however be used to study the above latitudinal features for TEC. By com-bining the latitudinal gradient of TEC measured in the region between the trough and the crest of the equatorial anomaly in the local afternoon hours, using transmission from LEO NOAA, with post-sunset equatorial scintillations on geosta-tionary L-band link, both measured at Calcutta situated under the northern crest of the equatorial anomaly, the existence of any correlation between the two phenomena could be exam-ined.
Intensity of scintillations on geostationary links is usually quantified by calculating the S4 index from the carrier
sig-nal. S4 index is defined as the standard deviation of the
fixed ionospheric pierce point, scintillations are observed on the ground diffraction pattern. GPS signals employ spread spectrum technique and the carrier is the product of recon-struction in the receiving equipment. Hence both amplitude and phase scintillations on any GPS link depend on receiver properties. Scintillation indices calculated in this case are different from that on a geostationary link. Furthermore, in-tense scintillations may be observed on a GPS link looking “end-on” through field-aligned bubbles.
The development of the equatorial anomaly is mainly con-trolled by the equatorial electrojet. The strength of the elec-trojet could be measured by the differences between the hourly inequalities (1H) of the horizontal component (H) of the geomagnetic field at a station near the magnetic equator, situated close to the axis of the equatorial electrojet, and an-other station located away from the magnetic equator outside the electrojet region. This prevents any non-ionospheric con-tribution to the magnetic field variation, e.g. magnetospheric contributions.
Enhanced electric field raises the electron density to the topside and reverses the process of normal decay of the anomaly. Sometimes, the post sunset anomaly becomes more developed than the daytime phenomenon. The equatorial anomaly is not confined to the maximum ionization height
hmF2, but extends up to several hundred kilometers in the topside of the ionosphere. The locus of the ionization crests in the topside lies on a field-line. A larger post sunset en-hancement of the eastward electric field may raise the apex of the field line at the equator to heights above the nominal alti-tude of satellites (840 km) like DMSP. As the satellite moves across the equator, the ionization density would then either show a flat top or two crests at off-equatorial latitudes. It has been suggested that an idea about the occurrence of scintilla-tions may be obtained from the latitudinal distribution of ion density by DMSP (Basu et al., 2002).
This paper presents parameters, measured by different techniques, as precursors to post sunset equatorial scintilla-tions on transionospheric geostationary links at a station sit-uated beneath the northern crest of the equatorial anomaly during the maximum of the last solar cycle in 2000–2001. These methods could be summarized as 1) measuring the latitudinal gradient of TEC in the region between the trough and the crest of the equatorial anomaly from the Faraday ro-tation of a plane polarized signal from a low Earth orbiting satellite, 2) calculating the diurnal maximum and integrated value of the strength of the equatorial electrojet in the Indian longitude sector, 3) estimation of the post sunset F-region height rise over the magnetic equator, and 4) determination of the width of the flat top from the latitudinal distribution of ionization density in the topside F-region obtained from satellites like DMSP. A reliable forecast of scintillations in the post-sunset hours at this geophysically sensitive region of the Earth would serve as a benchmark for the International Space Weather program.
2 Data
Transmission from a low Earth orbiting (LEO) satellite is more suitable for studying the latitudinal variation of TEC. The Faraday Rotation of plane polarized VHF signal at 136/137 MHz from the sun-synchronous LEO NOAA 12/14 (altitude: 850 km) recorded at Calcutta (lat: 22.58◦N long: 88.38◦E geographic; dip: 32◦N) during August through Oc-tober 2000 and February through April 2001, both periods of high sunspot numbers, were utilized to obtain a measure of development of the anomaly. The latitudinal gradient of TEC between 15◦–18◦N geographic was routinely scaled from the ascending (south-to-north) orbit of NOAA 12 and NOAA 14 in the afternoon hours (16:30 LT for NOAA 12 and 16:20 LT for NOAA 14). TEC data from NOAA were available for 36 days during August through October 2000 and 42 days in February through April 2001. VHF (FLEETSATCOM, 244 MHz) satellite transmission has been routinely moni-tored from Calcutta since 1980 and L-band (INMARSAT, 1.6 GHz) since 1994 to study the occurrence of scintillations at this station. The receivers were calibrated at least once a week following Basu and Basu (1989). The scintillation data was scaled to obtain Scintillation Index (SI (dB)) and S4
following Whitney et al. (1969). The anomaly gradients cal-culated from NOAA records have been combined with post-sunset equatorial scintillations observed from Calcutta with INMARSAT during the above period to study the existence of any correlation. The intensity of post-sunset L-band scin-tillations was quantified by calculating the 15-min S4index.
Since the VHF scintillation records during the period under consideration were mostly saturated with S4∼1, the
maxi-mum S4(S4max)at L-band for a particular night was used to
study the day-to-day variability of the intensity of scintilla-tions.
Changes in the geomagnetic field H observed at any equa-torial station need not necessarily be changes in electrojet strength. Magnetospheric changes, having a source far away from the Earth, are also recorded. Hence an equatorial station under the electrojet will have about the same magnetospheric contribution as a low latitude station outside the equatorial electrojet influence. On the other hand, the ionospheric ef-fects at these two locations would be different. Thus the subtraction of H values at the low latitude station from the H values at the equatorial station would yield a quantity, which would be free from magnetospheric effects. In the In-dian subcontinent, geomagnetic data from Tirunelveli (lat: 8.67◦N, long: 77.82◦E geographic; dip: 0.5◦N) situated
within the equatorial electrojet and Alibag (lat: 19.00◦N,
long: 72.83◦E geographic; dip: 24.75◦N) outside the torial electrojet were used to obtain an estimate of the equa-torial electrojet. Denoting the hourly inequality of the hori-zontal component of the geomagnetic field at Tirunelveli by
1432 S. Ray et al.: Equatorial scintillations in relation to the development of ionization anomaly
Fig. 1. Map of India showing locations of the stations Calcutta (lat: 22.58◦N long: 88.38◦E geographic; dip: 32◦N), Alibag (lat: 19.00◦N long: 72.83◦E geographic; dip: 24.75◦N), Kodaikanal (lat: 10.23◦N long: 77.47◦E geographic; dip: 1.5◦N) and Tirunelveli (lat: 8.67◦N long: 77.82◦E geographic; dip: 0.5◦N). The location of the magnetic equator and the northern crest of the equatorial anomaly around 30◦N dip are also shown. Dip lines at 10◦intervals from the magnetic equator to 40◦N dip are included. The 350-km subionospheric points of the geostationary satellites FLEETSATCOM (71◦E) (lat: 21.10◦N long: 87.25◦E geographic; dip: 28.65◦N) and INMARSAT (65◦E) (lat: 21.08◦N long: 86.59◦E geographic; dip: 28.74◦N) from Calcutta are indicated by arrows.
85 days during August through October 2000 and 89 days during February through April 2001. Two parameters were used to correlate the strength of the daytime equatorial elec-trojet with post-sunset scintillations at Calcutta. One of them was the diurnal maximum value of the inequality represented by1(HT–HA)maxwhile the other was the integrated value
of the same represented by1(HT–HA)intg. In the second case, the integration was performed from the time of onset of plasma transport from the magnetic equator to off-equatorial latitudes around 08 LT till local sunset.
In order to examine the correspondence between the day-time electron density gradient, post sunset F-region height rise, and generation of ionospheric irregularities, ionosonde data from Kodaikanal (lat: 10.23◦N, long: 77.47◦E
geo-graphic; dip: 1.5◦N), a station situated close to the mag-netic equator, was utilized along with ground-based satel-lite beacon records of Calcutta. During the period August through October 2000, Kodaikanalh0F data was available on 72 days. From theh0F values, the vertical plasma rise velocity was calculated over the interval from local sun-set to 20:00 LT. Because of the longitudinal separation, no
point-to-point correspondence should be expected between the post sunset F-region height rise over Kodaikanal and scin-tillations at Calcutta. However, the general behavior is likely to be more or less the same.
DMSP satellites in sun synchronous polar orbits could measure the latitudinal variation of in-situ ion density at 840 km. The satellite DMSP F13 is in a roughly dawn-dusk orientation covering the magnetic latitude range±30◦once near local sunset at Calcutta. The ion density data from DMSP at 4-s resolution are available at http://cindispace. utdallas.edu/DMSP/. Data was available for 83 days of Au-gust through October 2000 and 79 days of February through April 2001.
3 Results
3.1 Latitudinal gradient of Total Electron Content (TEC) and scintillations
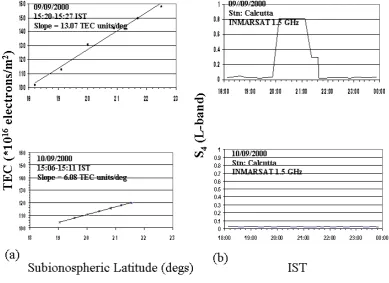
Fig. 2. (a) Latitudinal variation of Equivalent Vertical Total Electron Content (TEC (*1016electrons/m2)) measured from Faraday Rotation data recorded at Calcutta using LEO NOAA14 transmission at 137 MHz on two consecutive days 9 and 10 September 2000. (b) Variation of S4index of L-band scintillations at Calcutta on the above two days during 18:00 IST (=UT+05:30) to midnight.
(lat: 19.00◦N long: 72.83◦E geographic; dip: 24.75◦N),
Kodaikanal (lat: 10.23◦N long: 77.47◦E geographic; dip:
1.5◦N) and Tirunelveli (lat: 8.67◦N long: 77.82◦E
geo-graphic; dip: 0.5◦N) on a map of India along with the mag-netic equator and the northern crest of the equatorial anomaly around 30◦N dip. The 350-km subionospheric points of the geostationary satellites FLEETSATCOM (lat: 21.10◦N long: 87.25◦E geographic; dip: 28.65◦N) and INMARSAT (lat: 21.08◦N long: 86.59◦E geographic; dip: 28.74◦N) from Calcutta are also indicated in this figure.
During the equinoxes August through October 2000, and February through April 2001, VHF scintillations recorded at Calcutta in the post-sunset hours were almost always satu-rated (S4∼1). In this paper, geostationary L-band
scintilla-tions with S4max>0.4 (SI (dB)>8) are considered.
Geosta-tionary L-band scintillations with S4max>0.4 (SI>8 dB)
oc-curred on 33 nights during August through October 2000. The corresponding number for February through April 2001 was 45.
Samples of latitudinal variation of the equivalent vertical TEC measured using the plane-polarized transmission from LEO NOAA 14 on two consecutive days, 9 and 10 September 2000 are plotted in the top and bottom panel of Fig. 2a. The quasi-transverse (QT) propagation condition occurs when the
satellite passes over 28◦–29◦N latitude and the Faraday
rota-tion angle attains a minimum value around those latitudes. To avoid the uncertainties of Faraday rotation in the QT region, the analysis was restricted to latitudes sufficiently south of the QT point. The 15-min S4index for geostationary L-band
scintillations observed at Calcutta on the two days mentioned above is shown in Fig. 2b. It may be observed from the top panel of Fig. 2a that the anomaly was remarkably developed on 9 September 2000 with a slope of 13.1 TEC units/degree. On this day, intense scintillations (L-band S4max∼0.8) were
recorded at Calcutta. On the contrary, no scintillations were observed on 10 September 2000, a day with a much less lati-tudinal gradient of 6.1 TEC units/degree, as evident from the bottom panel of Fig. 2b.
Figures 3a and b show the latitudinal gradients of equiv-alent vertical TEC measured on different days of two equinoxes, August through October 2000, and February through April 2001. The filled-in circles correspond to days with S4max>0.4 at L-band whereas the crosses are for days
with S4max<0.4. The correspondence between a developed
[image:5.595.98.488.77.360.2]1434 S. Ray et al.: Equatorial scintillations in relation to the development of ionization anomaly
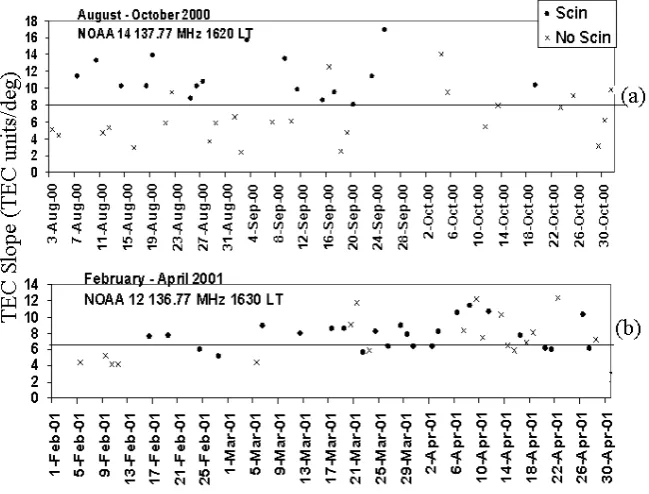
Fig. 3. Latitudinal gradients of Equivalent Vertical TEC (TEC Slope (TEC units/deg)) measured on different days of (a) August through
October 2000 from LEO NOAA14 transmission at Calcutta. A “threshold” value of 8 TEC units/deg of the gradient, indicated by a horizontal line, shows a highly significant association with L-band scintillations (b) February through April 2001 from LEO NOAA12 transmission at Calcutta. A “threshold” value of 6 TEC units/deg of the gradient, indicated by a horizontal line, shows a highly significant association with L-band scintillations. In both figures, the circles correspond to days with L-band scintillations having S4max>0.4 whereas the crosses are for
days with no L-band scintillations. LT=UT+06:00.
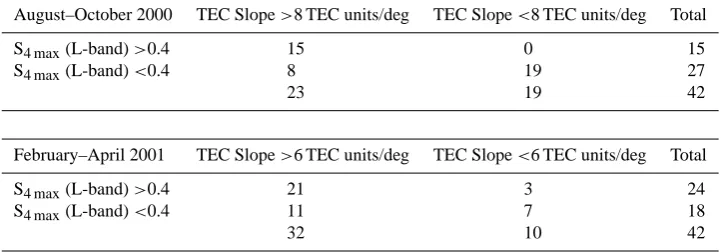
Fig. 4. Variation of maximum S4(S4max)at L-band and latitudinal gradient of Equivalent Vertical TEC (TEC Slope (TEC units/deg))
measured on different days of (a) August through October 2000 from LEO NOAA14 transmission at Calcutta. The “threshold” values of S4max=0.4 and TEC Slope = 8 TEC units/deg for which a highly significant association is obtained are indicated by drawing lines. (b) Febru-ary through April 2001 from LEO NOAA12 transmission at Calcutta. The “threshold” values of S4max=0.4 and TEC Slope = 6 TEC units/deg
[image:6.595.176.430.419.607.2]Table 1. 2×2 contigency table for testing the null hypothesis that a TEC Slope>8 TEC units/deg does not produce S4 maxat L-band>0.4
i.e. the two parameters are not associated. The values shown in this table represents the common volume data of latitudinal gradient of TEC measured from LEO NOAA and S4index for L-band geostationary scintillations.
August–October 2000 TEC Slope>8 TEC units/deg TEC Slope<8 TEC units/deg Total
S4 max(L-band)>0.4 15 0 15
S4 max(L-band)<0.4 8 19 27
23 19 42
February–April 2001 TEC Slope>6 TEC units/deg TEC Slope<6 TEC units/deg Total
S4 max(L-band)>0.4 21 3 24
S4 max(L-band)<0.4 11 7 18
32 10 42
hours around 16:20 LT are more likely to experience intense L-band scintillations in the post-sunset hours. A significant association between the two phenomena was noted at 1% level by performing a chi-square test. Figure 3b shows a threshold value of 6 TEC units/deg for the latitudinal gra-dient of TEC measured from NOAA 12 around 16:30 LT for February through April 2001, corresponding to which a highly significant association was obtained at 1% level with L-band scintillations.
Variation of the anomaly gradients with L-band S4max
dur-ing the two equinoxes under consideration is presented in Figs. 4a and b. On most of the days of August through Oc-tober 2000, when the TEC slope exceeded 8 TEC units/deg, as indicated by the vertical line in Fig. 4a, S4maxat L-band
was greater than 0.4. It has been found that there is a signifi-cant association at 1% level between a steep gradient of ion-ization in the local afternoon hours and post-sunset L-band scintillations. From Fig. 4b, it was found that during Febru-ary through April 2001, the association between a TEC gra-dient in excess of 6 TEC units/deg and L-band S4max>0.4 is
significant at 5% level. However in both equinoxes, there were occasions when a TEC slope greater than the thresh-old does not result in post-sunset L-band scintillations with S4max>0.4.
Table 1 presents a summary of the total number of cases associated with different values of TEC slope and corre-sponding S4maxat L-band, both measured from Calcutta
dur-ing the two equinoxes under consideration. Since there ap-pears to be a threshold value of the TEC slope, the cases are “binned” into two categories, namely, slope >8 TEC units/deg or 6 TEC units/deg, and slope<8 TEC units/deg or 6 TEC units/deg (for August–October 2000 and February– April 2001, respectively). For each of these TEC slope bins, the S4 measurements are placed into two categories, where
S4>0.4 and S4<0.4. The results of “binning” could be seen
in Table 1. During August through October 2000, when the latitudinal gradient of TEC in the afternoon hours was greater
than 8 TEC units/deg, a forecast that the subsequent L-band S4max would be greater than 0.4 was correct on 65% of the
days. However, when the TEC gradient was less than 8 TEC units/deg, a forecast that S4maxat L-band would be less than
0.4 would be correct 100% of the time. For the period Febru-ary through April 2001, when the latitudinal gradient of TEC in the afternoon hours was greater than 6 TEC units/deg, a forecast that post-sunset S4max at L-band would be greater
than 0.4 would be correct 66% of the time. However, when the TEC gradient was less than 6 TEC units/deg, a forecast that S4maxat L-band would be less than 0.4 would be correct
70% of the time. These results suggest that, on a night-to-night basis, it might be possible to forecast scintillation ac-tivity with a two to three hour lead-time. However during the period February through April 2001, the issue for concern is the 30% of “misses” i.e. occurrence of L-band scintillations (with S4max>0.4) with a negative forecast.
1436 S. Ray et al.: Equatorial scintillations in relation to the development of ionization anomaly
Fig. 5. (a) Diurnal variation of the strength of the equatorial electrojet1(HT–HA)(nT) in the Indian longitude sector on two consecutive days, 16 and 17 October 2000. (b) Variation of S4 index of L-band scintillations at Calcutta on the above two days during 18:00 IST
[image:8.595.148.445.70.288.2](=UT+05:30) to midnight.
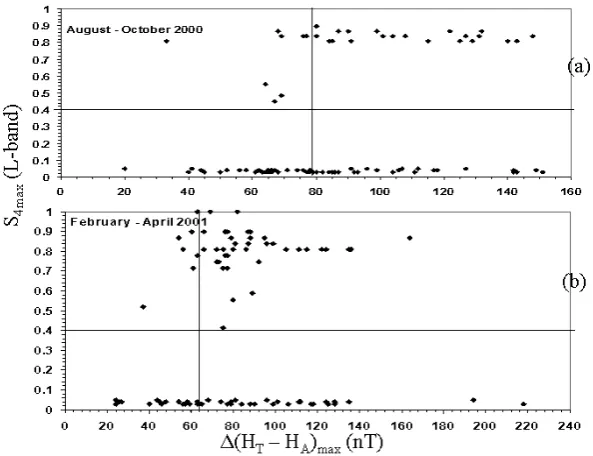
Fig. 6. Variation of maximum S4(S4max)at L-band with diurnal maximum value of1(HT–HA)(1(HT–HA)max(nT)) in the Indian
longi-tude sector measured on different days of (a) August through October 2000. The “threshold” values of S4max=0.4 and1(HT–HA)max=80 nT
for which a highly significant association is obtained are indicated by drawing lines. (b) February through April 2001. The “threshold” values of S4max=0.4 and1(HT–HA)max=65 nT for which a highly significant association is obtained are indicated by drawing lines.
for 16 and 17 October 2000 are given in Fig. 5a. The corresponding S4 indices at L-band for the two nights are
shown in Fig. 5b. On 16 October 20001(HT–HA)maxwas
90 nT while1(HT–HA)intg was 561 nT. Post-sunset scintil-lations at L-band were recorded at Calcutta on that day with
S4max∼0.6. On the other hand, no scintillations were
ob-served on 17 October 2000, a day with1(HT–HA)max=20 nT
and1(HT–HA)intg=133 nT.
Maximum S4 index at L-band on different nights of the
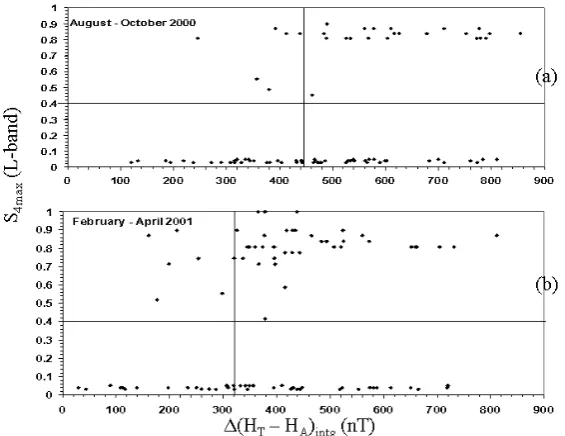
[image:8.595.149.446.348.576.2]Fig. 7. Variation of maximum S4(S4max)at L-band with integrated value of1(HT–HA)[1(HT–HA)I ntg.(nT)) in the Indian longitude sector measured on different days of (a) August through October 2000. The “threshold” values of S4max=0.4 and1(HT–HA)intg.=450 nT
for which a highly significant association is obtained are indicated by drawing lines. (b) February through April 2001. The “threshold” values of S4max=0.4 and1(HT–HA)intg.=320 nT for which a highly significant association is obtained are indicated by drawing lines. In both the
cases, the integration was performed from the time of onset of plasma transport to off-equatorial locations around 08 LT (=UT+06:00) till local sunset.
corresponding diurnal maximum values of 1(HT–HA). A chi-square test was performed between1(HT–HA)max and
the S4maxat L-band for the particular night. It was found that
if a threshold value of1(HT–HA)maxwas set at 80 nT
dur-ing August through October 2000 corresponddur-ing to L-band S4max=0.4, a highly significant association at 1% level was
obtained between the two phenomena. A similar degree of association was found during February through April 2001 if the threshold value of1(HT–HA)maxwas put to 65 nT.
How-ever, the reverse was not always true. It should be noted that these threshold values were selected with the aim of obtain-ing a high degree of association between the diurnal maxi-mum of1(HT–HA)and S4maxat L-band.
The results were put in two categories: 1(HT–HA)max
>80 nT or 65 nT and 1(HT–HA)max<80 nT or 65 nT (for
the two equinoxes under consideration). Following a proce-dure as described for Table 1, it was noted that a maximum value of1(HT–HA)>80 nT during the day results in L-band S4max>0.4 in 46% of the time during August through
Oc-tober 2000. On the other hand,1(HT–HA)max<80 nT
pro-duces S4max at L-band<0.4 in 81% of the time. The
corre-sponding figures for February through April 2001 were 60% and 76% respectively. The percentages of “misses” during these two equinoxes were 19% and 24%, respectively.
A relation between the integrated value of1(HT–HA)and L-band S4maxat Calcutta on different days of August through
October 2000, and February through April 2001 is presented
in Figs. 7a and b. From Fig. 7a, it is seen that1(HT–HA)intg in excess of 450 nT generally results in S4max>0.4. The two
phenomena showed a high degree of association at 1% sig-nificance level during August through October 2000. For the equinox of February through April 2001 (Fig. 6b), the thresh-old value of 320 nT for the integrated value of 1(HT–HA) produces a highly significant association at 1% level with S4max>0.4.
As before, the data was classified into two categories:
1(HT–HA)intg>450 nT or 320 nT and 1(HT–HA)intg
<450 nT or 320 nT (for August–October 2000 and February through April 2001, respectively). During August through October 2000, a forecast that 1(HT–HA)intg>450 nT pro-duces a post-sunset L-band S4max>0.4 was found to be true
46% of the time while1(HT–HA)intg<450 nT produces a subsequent L-band S4max<0.4 on 82% of the time. For
February through April 2001, the corresponding figures were 61% and 75%, respectively. L-band scintillations without a forecast, based on the integrated value of 1(HT–HA), oc-curred 18% and 25% of the time respectively for the above-mentioned two equinoxes.
3.3 Post-sunset F-region height rise over the magnetic equator and scintillations
1438 S. Ray et al.: Equatorial scintillations in relation to the development of ionization anomaly
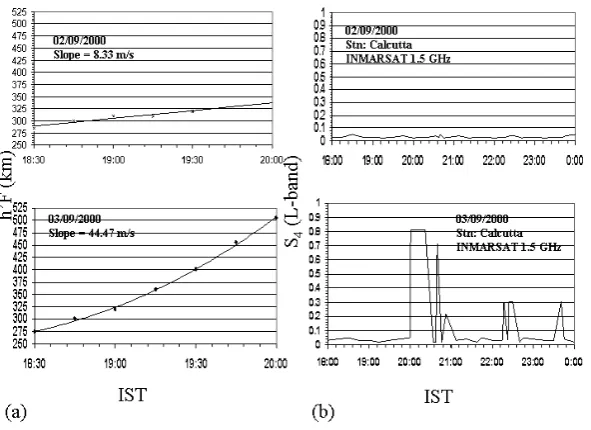
Fig. 8. (a) Vertical drift velocity (h0FSlope (m/s)) of F-region measured at Kodaikanal on two consecutive days 2 and 3 September 2000 in the post-sunset hours till the upward movement stops. (b) Variation of S4index of L-band scintillations at Calcutta on the above two days
[image:10.595.149.445.71.286.2]during 18:00 IST (=UT+05:30) to midnight.
Fig. 9. Variation of maximum S4(S4max)at L-band measured at Calcutta and vertical drift velocity (h0FSlope (m/s)) measured at Kodaikanal
on different days of August through October 2000. The “threshold” values of S4max=0.4 andh0FSlope = 25 m/s for which a highly significant association is obtained are indicated by drawing lines.
1970; Abdu et al., 1981). It was established that a sharp rise of F-region altitude due to the pre-reversal enhancement of the eastward electric field is often followed by the generation of intense irregularities through Rayleigh-Taylor instability mechanism. Samples ofh0F for two days, 2 and 3 September 2000, obtained from the Kodaikanal ionosonde are plotted in Fig. 8a. The corresponding L-band S4 indices measured at
Calcutta are shown in Fig. 8b. The temporal slope ofh0F
(dh0F/dt) was calculated over the time interval from local sunset till the height reaches its maximum value (normally around 20:30 LT). On 2 September 2000, the F-layer height rise was sluggish∼8 m/s corresponding to which no
scintil-lations were observed at Calcutta. On the contrary, dh0F/dt was very sharp next day on 3 September 2000∼44 m/s with S4max∼0.8.
The temporal slope ofh0Fon individual days of August through October 2000 is plotted in Fig. 9 to study the corre-spondence between the post-sunset F-region height rise over the magnetic equator from Kodaikanal and the intensity of post-sunset geostationary L-band scintillations (indicated by the maximum S4index) obtained from the satellite beacon
[image:10.595.153.447.353.499.2]Fig. 10. (a) Variation of ionization distribution with magnetic latitude within±30◦on two days, 30 March 2001 (flat-topped latitudinal distribution) and 1 April 2001 (round-topped latitudinal distribution) measured from DMSP F13 satellite around sunset. (b) Variation of S4
index of L-band scintillations at Calcutta on the above two days during 18:00 IST (=UT+05:30) to midnight.
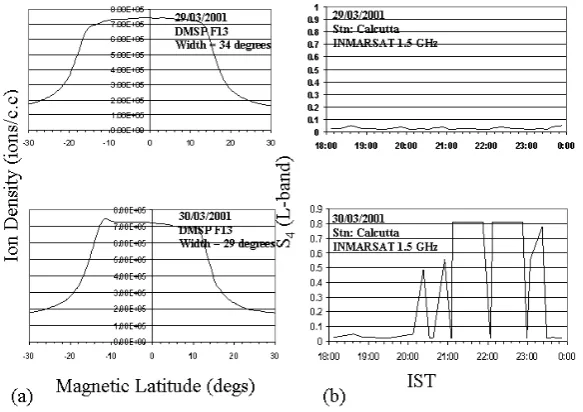
Fig. 11. (a) Variation of ionization distribution with magnetic latitude within±30◦ on two consecutive days, 29 and 30 March 2001 measured from DMSP F13 satellite around sunset. Ionization distribution was flat-topped on both these days. (b) Variation of S4index of
L-band scintillations at Calcutta on the above two days during 18:00 IST (=UT+05:30) to midnight.
S4max>0.4 were recorded at Calcutta. An association at a
significance level of 5% is noted between the two events. Classifying theh0F slopes into two categories, one greater than 25 m/s and the other less than 25 m/s, it was found that a forecast that a h0F slope >25 m/s would produce L-band S4max>0.4 was true 43% of days. On the other
hand, a forecast that h0F slope <25 m/s would result in L-band S4max<0.4 was valid 80% of the time. The “misses”
i.e. occurrence of L-band geostationary scintillations (with S4max>0.4) without a forecast occurred 20% of the cases.
[image:11.595.150.445.70.283.2] [image:11.595.148.440.359.565.2]1440 S. Ray et al.: Equatorial scintillations in relation to the development of ionization anomaly
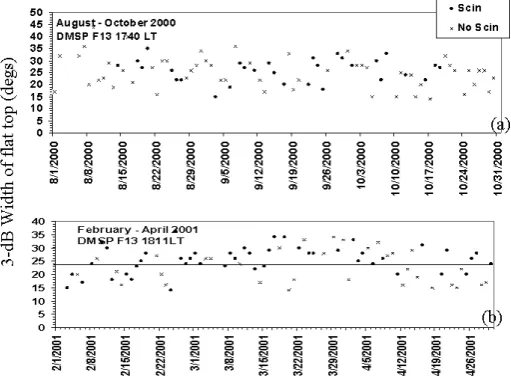
Fig. 12. 3-dB width (width at 70% of the maxima) of ionization density distribution (Width of flattop (degs)) measured by DMSP F13
satellite within±30◦magnetic latitude in the Indian longitude sector on different days of (a) August through October 2000. No suitable “threshold” value of the width is found for this period. (b) February through April 2001. A horizontal line at 24 deg indicates the “threshold” value of the width of the flat-topped ionization distribution for which a highly significant association is obtained. In both the figures, the circles correspond to days with L-band scintillations having S4max>0.4 whereas the crosses are for days with no L-band scintillations.
LT=UT+06:00.
than 0.5 was expected in the Peruvian/Chilean longitude sec-tor during 1998–1999. The relationship between UHF and L-band S4 indices is not linear. At locations like Calcutta,
near the crest of the equatorial anomaly, UHF scintillation is normally saturated when S4at L-band is greater than 0.4.
From simultaneous observations at UHF and L-band, an idea about S4at L-band can be obtained from the autocorrelation
distance or fading rate at UHF. When the autocorrelation dis-tance of the UHF ground diffraction scintillation pattern is small, or the fading rate at UHF is fast, L-band scintillation index is high.
3.4 Latitudinal distribution of topside ionization and scin-tillations
Existence of a flat-topped ionization distribution over the magnetic equator around sunset has been suggested as a pos-sible indication of occurrence of post-sunset scintillations (Basu et al., 2002). In order to quantify the relation be-tween the two, the 3-dB width of the flattop (width of flat-top calculated at 70% of the maxima) is suggested to be a precursor in the present paper. Samples of ion density as a function of magnetic latitude for 30 March and 1 April 2001 obtained from DMSP F13 around local sunset (17:40 LT) at Calcutta within the magnetic latitude range±30◦are shown in Fig. 10a. S4index for geostationary L-band scintillations
recorded at Calcutta on the two days are plotted in Fig. 10b. A flat-topped ionization density profile around the magnetic equator with a 3-dB width of 29 deg was found on 30 March 2001. This was followed by intense scintillation activity on
the INMARSAT link with S4max∼0.8 in the post-sunset to
midnight local time sector. However, on 1 April 2001, the latitudinal distribution was round-topped with a 3-dB width of 18 deg. No scintillations were recorded on that night at L-band. The nature of these plots agree fairly well with that described by earlier workers (Basu et al., 2002).
However a flat-topped ionization profile over the magnetic equator may not always be associated with subsequent L-band scintillations. Figures 11a and b display one such case observed on 29 March and 30 March 2001. On both these days a flat-topped latitudinal distribution of ionization den-sity were obtained with 3-dB widths of 34 deg and 29 deg, respectively. While 30 March 2001 saw intense L-band scin-tillations as mentioned earlier, no such events were noted on 29 March 2001.
Figures 12a and b show the 3-dB width of the ionization density distribution on different days of the equinoctial pe-riod August through October 2000 and February through April 2001. The filled-in circles correspond to days with scintillations whereas the crosses represent days without scintillations. No suitable threshold width having a close correlation with L-band scintillations having S4max>0.4 was
found in Fig. 12a. From Fig. 12b, a threshold width of 24◦of the flat top was found to be significant at 2.5% with L-band scintillations having S4max>0.4.
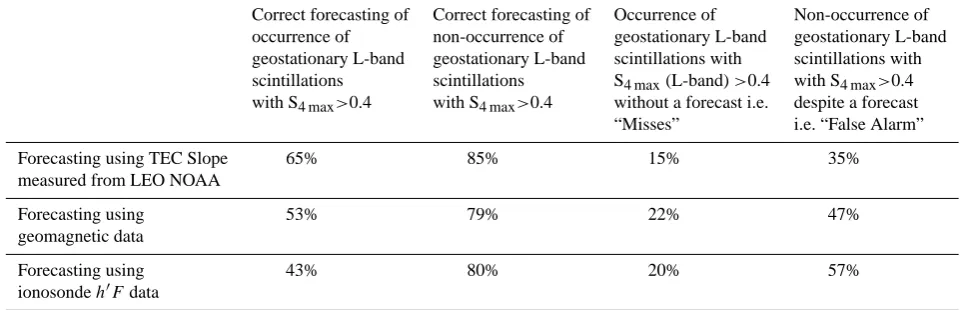
Table 2. Comparative performance of the different forecasting techniques obtained by averaging the results for the two equinoxes, August–October 2000 and Febraury–April 2001.
Correct forecasting of Correct forecasting of Occurrence of Non-occurrence of occurrence of non-occurrence of geostationary L-band geostationary L-band geostationary L-band geostationary L-band scintillations with scintillations with scintillations scintillations S4 max(L-band)>0.4 with S4 max>0.4 with S4 max>0.4 with S4 max>0.4 without a forecast i.e. despite a forecast
“Misses” i.e. “False Alarm” Forecasting using TEC Slope 65% 85% 15% 35% measured from LEO NOAA
Forecasting using 53% 79% 22% 47% geomagnetic data
Forecasting using 43% 80% 20% 57% ionosondeh0Fdata
latitudinal gradient of TEC from LEO NOAA transmission provides the best results with a successful forecasting in 65% and 85% cases for occurrence and non-occurrence of scintil-lations respectively.
4 Summary and discussions
This paper presents, perhaps for the first time, a quanti-tative relation between the different suggested precursors of ionospheric irregularities and actual occurrence of post-sunset equatorial F-region scintillations during the equinoc-tial months of the last solar maximum in 2000–2001. Since the equatorial ionosphere produces very intense saturated scintillations even at L-band in the early evening hours, fail-ures of satellite-based communication and navigation sys-tems are frequently encountered in this region with the worst-case figures coming from stations situated near the crests of the equatorial anomaly. The results presented in this paper, though not foolproof, provide some insight towards develop-ment of forecasting and nowcasting techniques for the equa-torial ionosphere under the International Space Weather pro-gram.
It has been suggested that “bubbles” in the post sunset hours are more probable on days when the daytime anomaly is more developed (Raghavarao et al., 1988), although the in-terconnection between the two phenomena is yet to be fully understood. The coupling between the E and F layers in the vicinity of the solar terminator has been worked out by Haerendel and Eccles (1992) and Eccles (1998). According to this model, a portion of the dayside equatorial electrojet spills over into the F-layer and causes the low-latitude plasma to rise in the early post sunset hours.
The equatorial anomaly is not confined to the maximum ionization height hmF2, but extends up to several hundred kilometers in the topside of the ionosphere. Measurements
of latitudinal gradient of electron content from LEO satellite transmissions have established that the TEC exhibits features similar to that of the anomaly. The present study clearly establishes that days with developed equatorial anomaly in the afternoon, as indicated by the gradient of TEC, are more likely to be followed by generation of intense equatorial bub-bles resulting in L-band scintillations near the crests of the equatorial anomaly during the local post sunset to midnight hours.
In the present paper, parameters obtained from different techniques have been suggested as precursors to post sun-set equatorial scintillations on transionospheric geostationary links. These methods could be summarized as:
– Measuring the latitudinal gradient of the TEC in the re-gion between the trough and the crest of the equatorial anomaly from the Faraday rotation of a plane polarized signal from a low Earth orbiting satellite.
– Calculating the diurnal maximum and integrated value (the integration being performed from the time of on-set of plasma influx from the magnetic equator to off-equatorial latitudes around 08 LT till local sunset) of the strength of the equatorial electrojet in the Indian longi-tude sector.
– Estimation of the post sunset F-region height rise over the magnetic equator from local sunset till 20:00 LT when the vertical rise ofh0F stops
– Determination of the width of the flat top from the lat-itudinal distribution of ionization density in the topside F-region obtained from satellites like DMSP.
1442 S. Ray et al.: Equatorial scintillations in relation to the development of ionization anomaly precursors and the occurrence of post sunset scintillations by
performing a chi-square test.
It is found that the successful forecasting of the occur-rence of post sunset scintillations is always less than a cor-rect forecasting of their non-occurrence. This suggests the existence of other drivers/ physical mechanisms responsible for triggering the generation of F-region irregularities. The success percentage of forecasting scintillations using Fara-day rotation technique is about 65% (averaging the results obtained during the two equinoxes), which is higher com-pared to other techniques. The percentages of “false alarms” i.e. non-occurrence of scintillations in spite of a forecast is the lowest in this method. These cases should also be kept in mind while comparing the different techniques as they intro-duce wastage of resources of any communication and naviga-tion system. However the issue of serious concern is the per-centage of “misses” i.e. occurrence of intense (S4max>0.4)
scintillations without a forecast. The percentage of “misses” is also least (15% when averaged over the two equinoxes) when using a technique for measurement of Total Electron Content with a LEO satellite transmission for calculating the anomaly gradient.
The suggestion that an idea about the occurrence of scin-tillations may be obtained from the latitudinal distribution of ion density by DMSP (Basu et al., 2002) is also exam-ined. During the period of observation of the present study, it has been observed that although the probability of occur-rence of scintillations is high on days with flat-topped ion density variation over the magnetic equator, there are cases when no scintillations are observed even when a pronounced flat top variation was recorded.
Among all the different measures, determination of the lat-itudinal gradient of TEC provides the most reliable precursor for post-sunset equatorial scintillations. It has the highest percentage of correct forecasting of occurrence as well as non-occurrence of scintillations on a particular night along with the lowest percentage of “misses” and “false alarms” as evident from Table 2. TEC could be measured by different techniques like Faraday Rotation of a plane-polarized signal, differential Doppler measurement or tomography. However, the Faraday Rotation technique is the most simple and inex-pensive method for measuring the TEC.
Acknowledgements. This research has been sponsored in part
by the Indian Space Research Organization (ISRO) through the S. K. Mitra Center for Research in Space Environment, University of Calcutta. Magnetic data have been obtained from the prompt geomagnetic data reports published by the Indian Institute of Geo-magnetism (IIG). J. H. Sastri was kind enough to provide the Ko-daikanal ionosonde data. The authors gratefully acknowledge the Center for Space Sciences at the University of Texas at Dallas and the U.S. Air Force for providing the DMSP thermal plasma data via the web site http://cindispace.utdallas.edu/DMSP/.
Topical Editor M. Pinnock thanks D. N. Anderson and R. Leitinger for their help in evaluating this paper.
References
Abdu, M. A., Batista, I. S., and Bittencourt, J. .: Some character-istics of spread-F at the magnetic equatorial station Fortaleza, J. Geophys. Res., 86, 6836–6842, 1981.
Anderson, D. N., Reinisch, B., Valladare, C., Chau, J., and Veliz, O.: Forecasting the occurrence of ionospheric scintillation activ-ity in the equatorial ionosphere on a day-to-day basis, J. Atmos. Sol. Terr. Phys., 66, 1567–1572, 2004.
Basu, S. and DasGupta, A.: Latitude variation of Total Electron Content in equatorial region, J. Geophys. Res., 72, 5555–5558, 1967.
Basu, S. and Basu, Su.: Scintillation technique for probing iono-spheric irregularities, in WITS Handbook, vol. 2, edited by: Liu, C. H., SCOSTEP, Univ. of Ill., Urbana, 128–136, 1989. Basu, S., Groves, K. M., Basu, Su., and Sultan, P. J.: Specification
and forecasting of scintillations in communication/navigation links: current status and future plans, J. Atmos. Sol. Terr. Phys., 64, 1745–1754, 2002.
Eccles, J. V.: A simple model of low-latitude electric fields, J. Geo-phys. Res., 103, 26 699–26 708, 1998.
Farley, D. T., Balsley, B. B., Woodman, R. F., and McClure, J. P.: Equatorial spread F: implications of VHF radar observations, J. Geophys. Res., 75, 7199–7216, 1970.
Haerendel, G. and Eccles, J. V.: The role of the equatorial electro-jet in the evening ionosphere, J. Geophys. Res., 97, 1181–1192, 1992.
Kane, R. P.: Comparison of geomagnetic changes in India and the POGO data, J. Atmos. Terr. Phys., 35, 1249–1252, 1973. Kelley, M. C.: The earth’s ionosphere, Academic Press, Inc., 1989. Rastogi, R. G. and Klobuchar, J. A.: Ionospheric electron content within the equatorialF2 layer anomaly belt, J. Geophys. Res.,
95, 19 045–19 052, 1990.
Ragahavarao, R., Nageswararao, M., Hanumath Sastri, J., Vyas, G. D., and Sriramarao, M.: Role of equatorial ionization anomaly in the initiation of equatorial spread-F, J. Geophys. Res., 93, 5959– 5964, 1988.
Rishbeth, H.: Polarization fields produced by winds in the equato-rial F-region, Planet. Space. Sci., 19, 357–369, 1971.