Gas transfer under breaking waves: experiments and an improved
vorticity-based model
V. K. Tsoukala and C. I. Moutzouris
Laboratory of Harbor Works (LHW), School of Civil Engineering, National Technical University of Athens (N.T.U.A.), 5 Iroon Polytechniou 157 80 Zografou, Greece
Received: 29 July 2007 – Revised: 17 April 2008 – Accepted: 3 June 2008 – Published: 31 July 2008
Abstract. In the present paper a modified vorticity-based model for gas transfer under breaking waves in the absence of significant wind forcing is presented. A theoretically valid and practically applicable mathematical expression is sug-gested for the assessment of the oxygen transfer coefficient in the area of wave-breaking. The proposed model is based on the theory of surface renewal that expresses the oxygen transfer coefficient as a function of both the wave vorticity and the Reynolds wave number for breaking waves.
Experimental data were collected in wave flumes of vari-ous scales: a) small-scale experiments were carried out us-ing both a slopus-ing beach and a rubble-mound breakwater in the wave flume of the Laboratory of Harbor Works, NTUA, Greece; b) large-scale experiments were carried out with a sloping beach in the wind-wave flume of Delft Hydraulics, the Netherlands, and with a three-layer rubble mound break-water in the Schneideberg Wave Flume of the Franzius Insti-tute, University of Hannover, Germany.
The experimental data acquired from both the small- and large-scale experiments were in good agreement with the proposed model. Although the apparent transfer coefficients from the large-scale experiments were lower than those de-termined from the small-scale experiments, the actual oxy-gen transfer coefficients, as calculated using a discretized form of the transport equation, are in the same order of mag-nitude for both the small- and large-scale experiments. The validity of the proposed model is compared to experimental results from other researchers.
Although the results are encouraging, additional research is needed, to incorporate the influence of bubble mediated gas exchange, before these results are used for an environ-mental friendly design of harbor works, or for projects in-volving waste disposal at sea.
Correspondence to: V. K. Tsoukala ([email protected])
Keywords. Oceanography: general (Marine pollution) – Oceanography: physical (Air-sea interactions) – Space plasma physics (Laboratory studies)
1 Introduction
The interest in the exchange of gases between the atmosphere and water bodies with its resultant effects on water quality starts from the beginning of the last century. Social interest in the exchange of greenhouse gases and pollutants between natural water bodies and the atmosphere over the past two decades has enhanced the interest of gas transfer across the air-water interface (Donelan et al., 2002). A wide range of the scientific community, from fluid dynamics experts to bio-chemists, are interested in studying and analyzing the com-plex processes controlling gas transfer.
The first studies on oxygen transfer through the air-water interface began from the rivers which expanded into the lakes and the oceans and lastly into estuaries and coastal seas due to the great impact of dissolved oxygen (D.O.) concentra-tions into aquatic organisms. Estuaries and coastal seas are important sources of oxygen, impacting regional or even tro-pospheric budgets (Kim and Andreae, 1992; Upstill-Goddard et al., 2000; Borges et al., 2003). Effects of seabed changes in the coastal zone and/or the presence of structures, make the study of natural flow hydrodynamics and the oxygenation of the sea-water due to the wave’s action, even more complex.
2132 V. K. Tsoukala and C. I. Moutzouris: Gas transfer under breaking waves than to define an oxygen concentration difference, because
it is influenced by a wide range of environmental variables, most of which are strongly correlated. In the past several years substantial advances have been made in understanding the air-sea oxygen exchange, however, it is still insufficient to adequately parameterize many of the fundamental control-ling processes (Upstill-Goddard, 2006).
Oxygen transfer in coastal waters is effected both through molecular and turbulent diffusion at the air-water interface and through bubble ebullition. Enhancements of oxygen transfer are expected as:
1. the microscale wave breaking initiated at wind speeds well below those associated with whitecaps (Csanady, 1990; Melville, 1996; Zappa et al., 2001),
2. the result of the turbulence generated by breaking waves (Kitaigorodskii, 1984; Woolf, 1995; Feddersen, 2005; Woolf et al., 2007),
3. the transfer across the surface of bubbles (Merlivat and Memery, 1983; Memery and Merlivat, 1985; Keeling, 1993; Woolf, 1993) and
4. the disruption of the surface microlayer by surfacing and bursting bubbles (Monahan and Spillane, 1984). Waves and their associated velocity fields contribute to the oxygen transfer across the air-water interface in three prin-ciple ways: a) by increasing the surface area (often with the creation of bubbles); b) by providing transport and mixing of aerated fluid from the surface to the fluid bulk; and c) by thinning the highly aerated surface boundary layer. Thus, the primary role of the wave state is to provide a means for transport and mixing of the surface layer, via turbulence in the bulk until breaking waves occur.
Breaking waves at the ocean’s surface inject bubbles and turbulence into the water column. During periods of rough weather the scales of wave breaking will increase with in-creasing sea states and result in mixing of the surface waters and the turbulent transport of bubbles to depth (Boettcher et al., 2000; Terrill et al., 2001; Melville and Matusov, 2002). It is expected that the creation of bubbles enhancesKLby cre-ating additional surface area and by enhancing the diffusion at the bubble’s surface due to the increased pressure within the bubble. Plunging breaking waves at the coastal zone or in the vicinity of a coastal structure can entrain large masses of air bubbles when the top of the wave forms a water jet pro-jecting ahead of the wave crest before impacting the coastal region.
Bubble induced oxygen transfer varies qualitatively de-pending on the size of the bubbles. According to Keeling (1993) three size regimes could be considered: 1) small bub-bles with radius (r)r<5×10⁻⁵m which completely disap-pear by dissolution in the water, 2) intermediate bubbles in which the gases equilibrate with gases dissolved in the water and 3) large bubbles withr>5×10⁻⁴m in which oxygen is
not in equilibrium with the water (Jahne et al., 1984; Memery and Merlivat, 1985). All three classes may be important in oxygen transfer. In particular, Keeling (1993) indicated that bubbles with a radius larger than 5×10⁻⁴m, which have of-ten been assumed to play a negligible role, contribute sig-nificantly to bubble induced oxygen transfer and supersatu-ration. Bubble-mediated gas transfer will support supersat-urations of typically 1–2% for oxygen (Woolf and Thorpe, 1991). Besides, bubble-mediated gas transfer was identi-fied as the most significant contributor to gas exchange dur-ing wave breakdur-ing in an experimental gas exchange facility (de Leeuw et al., 2002; Garrettson, 1973). Bubble penetra-tion depths>16 m have been observed during wave breaking (Farmer et al., 1993) and the resulting change in bubble inter-nal gas pressure drives gas transfer across the bubble-water interface, even though the gas partial pressure in surface wa-ter is at or near atmospheric equilibrium (Memery and Mer-livat, 1985; Woolf and Thorpe, 1991; Woolf, 1993).
Up until now, many attempts to describe the gas transfer due to breaking waves and bubbles (e.g. Asher et al., 1996; Woolf, 1997; Asher and Wanninkhof, 1998) had been made, but the available data are still limited. The fraction of the ocean surface renewal by breaking waves per unit of time is found to be proportional to the cubic of the ten meter wind speed (U10)and is dominated by the shorter breaking waves (Melville and Matusov, 2002). The potential major impacts of vertical buoyancy fluxes due to air entrainment and bub-bles are also unknown and have not been considered. Both the distribution and the dynamics of breaking-wave gener-ated bubbles and turbulence, and their correlation are still poorly understood.
Lately, the environmental impact of coastal structures, and their impact in water quality in coastal areas force engineers to identify the effects of wave field, and wave breaking, in the coastal zone or/and in the vicinity of coastal structures, regarding oxygen transfer. Wave breaking in the vicinity of coastal structures results in high oxygenation rates and in wa-ter quality improvement of the surrounding area. Over re-cent years the prediction of the transfer coefficient as a func-tion of the wave characteristics has been the focus of many researchers (Daniil and Moutzouris, 1995; Hosoi and Mu-rakami, 1986; Hosoi et al., 1990; Kakuno et al., 1995).
According to the surface renewal theory (Higbie, 1935; Dankwerts, 1970), the oxygen transfer rate (KL)across the air-water interface is proportional to surface renewal rate. In practice, surface renewal is influenced by several variables, including free convection under calm conditions, wind in-duced mixing at low high wind speeds, changes in air-water momentum transfer due to drag, thermal stratification due to insolation, wave damping, buoyancy effects from precipita-tion and surfactants (Schluessel et al., 1997; Soloviev et al., 2002).
Tsoukala&Moutzouris_AG_2007207.doc 11/6/2008 30 1
2.3
0.90
Lo
c.
1
Lo
c.
2
0.60
(0.30) (2.20)2.80
Lo
c.
3
x=0.0
12.2 (10.0)
(12.5)15.4
DRAIN PIPE SUPPLY PIPE
VIEWING WINDOWS
[image:3.595.47.255.62.217.2]WAVE MAKER SLOPING BEACH
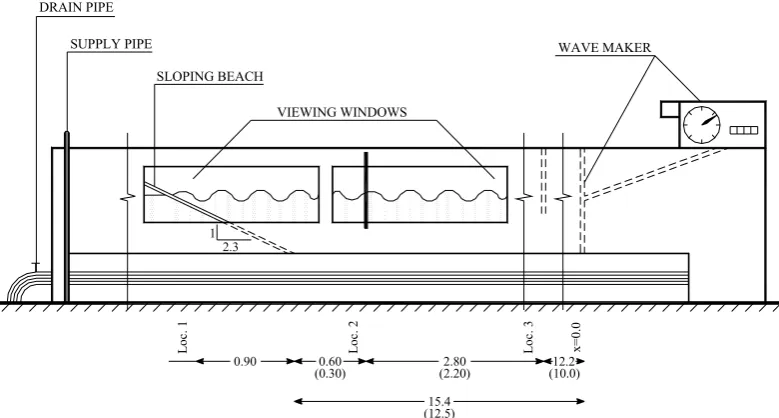
Figure 1.
Schematic Plan View and Experimental Setup of the Wave Flume in LHW
Fig. 1. Schematic plan view and experimental setup of the wave flume in LHW.impermeable beach and for breaking waves on the breakwa-ter. Their analysis concluded that the constants in the pro-posed equations are probably dependent on the slope of the beach and the type of the breakwater. Daniil et al. (2000) proved that there is no difference in the estimation of the oxy-gen coefficients if the horizontal flux through the permeable breakwater is not neglected.
Considering remarks from previous studies in this paper, a modified and improved vorticity-based renewal model for the prediction of gas transfer coefficient under breaking waves in the absence of wind forcing is proposed and fitted to exper-imental data obtained from both small- and large-scale ex-perimental facilities. Although this analysis does not include bubble mediated transfer, which is dominant in the breaking of mechanically generated waves, the proposed model seems to represent the experimental data quite well.
2 Experimental procedure
Small-scale and large-scale oxygenation experiments under breaking and non-breaking waves were performed both with sloping beaches and rubble mound breakwaters at the wave flume of Laboratory of Harbor Works (LHW) and the Wind Wave Flume of Delft Hydraulics (DH). Additionally, large-scale experiments were conducted with a three-layer rub-ble mound breakwater in the Schneideberg Wave Flume at Franzius Institute (FI). All the experiments conducted in the absence of wind forcing and currents.
The test method is based upon the removal of D.O. from the volume of water followed by re-oxygenation to a near saturation level, as described in the ASCE Standard (1993). For all the experiments D.O. is removed using nitrogen.
[image:3.595.155.545.256.465.2]2134 V. K. Tsoukala and C. I. Moutzouris: Gas transfer under breaking waves
Tsoukala&Moutzouris_AG_2007207.doc 11/6/2008 31
8.
0
m
Deoxygenation Zone Series B Wave maker
Movable divider
100.0 m Deoxygenation Zone
Series A Wave gauges
Sloping beach
36 40 44 A
B
C 52 58
Sampling locations of D.O.
48
2.
0
2.
0
24.0 m
83 87 91
[image:4.595.121.549.257.412.2]12.0 m
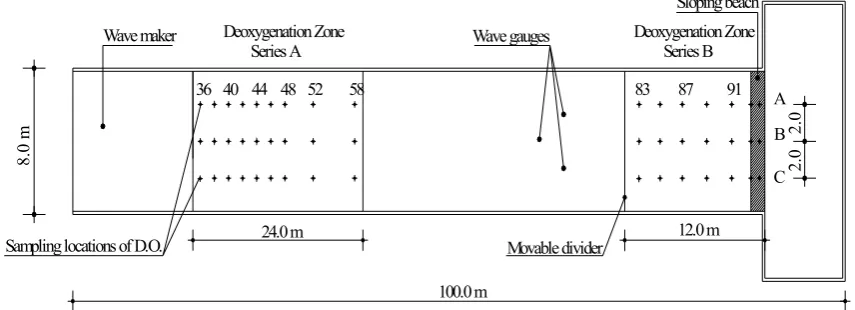
Figure 2. Schematic Plan View and Experimental Setup of the Wind Wave Flume in DH
Fig. 2. Schematic plan view and experimental setup of the wind wave flume in DH.
concentration. D.O. – time histories were obtained for all experiments and sampling locations. To verify the accu-racy of readings obtained with oxygen meters, water samples were also taken and analyzed using the azide modification of the Winkler titration method. Measurements of D.O. concentration commenced upon initial wave generation and continued until the D.O. value reached ∼80% of the estimated saturation level.
The wave flume of LHW is 27 m long, 0.60 m wide and 2m deep (see Fig. 1). The flume is equipped with a me-chanical wave generator. Monochromatic, sinusoidal waves with heights between 7.5×10⁻²and 23.4×10⁻²m and peri-ods between 0.75 and 1.70 s were produced. The experimen-tal procedure consisted of two distinct series of experiments. In the first series of experiments (Series LHW-V) a structure with a uniform slope of 1:2.3, was placed at the end of the flume to initiate wave breaking, while in the second series of experiments (Series LHW-A) a structure with a uniform slope of 1:5 was used. Three capacitance wave gauges were used to record the wave characteristics. The concentration of D.O. in the water was monitored over time by a portable
WTW OXI-196 oxygen meter, at 8 sampling locations along the flume.
The wave flume at DH is “T” shaped. It is 100 m long, 8 m wide and 1 m deep. The last 9 m section is 25 m wide (see Fig. 2). Waves with heights between 7.5×10⁻² and 28.3×10⁻²m and periods from 1.07 to 1.90 s were produced. The experimental procedure consisted of two distinct series of experiments. In the first series of experiments (Series DH-A) waves were produced without any coastal structure in the flume. In the second series of experiments (Series DH-B) a concrete structure with a uniform slope of 1:2.3 was placed at the end of the flume, in order to initiate wave breaking. Three capacitance wave gauges were used to record the wave char-acteristics. The concentration of D.O. in the water over time was monitored by a portable, WTW OXI-196 oxygen meter, at 21 sampling locations along the flume.
Tsoukala&Moutzouris_AG_2007207.doc 11/6/2008 32 2.0m
Breakwater Models Wave Gauges
Sampling Locations Wave maker
Movable Carriage
Impermeable barrier
[image:5.595.52.546.63.323.2]
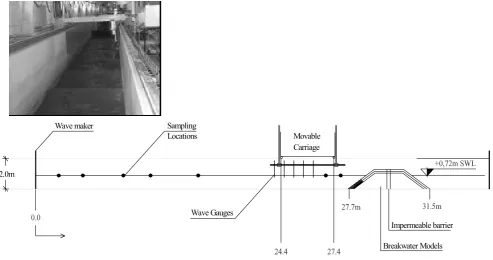
Figure 3. Schematic Cross Section and Experimental Setup of the Schneideberg Wave Flume in FI Fig. 3. Schematic cross section and experimental setup of the Schneideberg wave flume in FI.
bottom elevation was constructed at a distance of 27.75 m from the wave generator (see Fig. 3). Two different series of experiments were conducted. In the first series (Series FI-A), the breakwater structure was impermeable with a wooden barrier placed in the middle of the breakwater body, pro-hibiting any transport through the structure. In the second series of experiments (Series FI-B), the wooden barrier was removed but the breakwater remained almost impermeable due to the layering of the structure. The wave height used in the experiments ranged from 9.2×10⁻²to 16.5×10⁻²m, with wave periods from 1.11 to 1.43 s. Five capacitance wave gauges were used to record the wave characteristics. The D.O. concentration at FI was monitored at 15 sampling loca-tions by an YSI – Model 95 oxygen meter.
3 Data analysis
The transfer coefficient is determined indirectly through the mass transport equation, when the rest of the terms are known. The one-dimensional transport equation is usually used for analysis of data from laboratory flumes:
∂C ∂t +U
∂C
∂x =
∂ ∂x
Dx ∂C
∂x
+S, (1)
where C is the concentration of dissolved oxygen, U is the mean velocity in the x-direction (U=0 for the wave flume), Dx is the longitudinal dispersion coefficient in the x-direction, S is the source (S>0) or sink (S<0) term per
unit volume andt is time. Oxygen transfer through the air water interface can be expressed as a source term as:
S=KL(CS−C) AS/V , (2)
whereKLis the oxygen transfer coefficient,AS is the aver-age air-water surface area on the horizontal plane andV is the aerated water volume extending from the free surface to the bottom of the flume.
If the only source term is the air-water gas transfer, and the terms for horizontal transport and dispersion are neglected, the transport equation is reduced to a first order differential equation.
For the initial conditions of C=C0att=0, and assuming constant concentration for the entire experiment, the solution of Eq. (2) is as follows:
C=CS−(CS−C0) e−KL(AS/V )t. (3) Equation (3) can be expressed as a linear function of time as follows:
ln(CS−C)=KL(AS/V )t+ln(CS−C0) . (4) The transfer coefficient is determined from Eq. (4) using lin-ear regression and the measured D.O. concentrations.
2136 V. K. Tsoukala and C. I. Moutzouris: Gas transfer under breaking waves In this paper, the effect of increased longitudinal
disper-sion due to wave breaking on the structures has been consid-ered in all the performed experiments. Equation (1) is dis-cretized, using a control volume approach (Patankar, 1980). Integrating over a control volume of lengthLi, volumeVi, cross sectional areaW (width of the channel) multiplied by the constant water depthdand also assuming that∂C/∂tand S can be represented by their values at pointiand a linear profile between grid points for∂C/∂x, Eq. (1) can be written as:
Vi ∂C
∂t =
Di, i+1 Li, i+1
W d (Ci+1−Ci)
−Di−1, i Li−1, i
W d (Ci−Ci−1)+Vi Si, (5) whereLi,i+1andLi−1,iare the distances,Di,i+1, andDi−1,i are the horizontal diffusion coefficients between grid points (i, i+1) and (i−1, i), respectively.
In the experimental Series DH-A no longitudinal varia-tion in D.O. concentravaria-tion was observed. Therefore, Eq. (3) was used to determine the oxygen transfer coefficient. In Se-ries DH-B, where the waves were breaking and longitudinal variation was observed, Eq. (5) describes the oxygen trans-fer coefficients that were determined based on the numerical scheme proposed by Tsoukala (2000). Five control volumes were used, with each control volume containing at least one sampling point. The system of equations described by Eq. (5) was solved numerically using the Tridiagonal Matrix Algo-rithm (Thomas, 1949) for the duration of each experiment. The initial concentrations measured at each sampling point were introduced in the computations. The gas transfer and diffusion coefficients were adjusted until a best-fit with ob-served D.O. values was obtained (Wanninkhof and Bliven, 1994). The same procedure was also followed in the experi-mental Series FI-A and FI-B, as well as in the experiexperi-mental Series LHW-V and Series LHW-A, using 5 and 7 control vol-umes, respectively.
Transfer coefficients were normalized to 20◦C, assuming a square-root dependence on the Schmidt number Sc, accord-ing to the equation given by Daniil and Gulliver (1988).
KL20 KL = Sc Sc20 1/2 = ν ν20 293
θ+273
1/2 ρ
ρ20
1/2
, (6)
where Sc=ν/Dνis the kinematic viscosity,θis the water tem-perature in degrees Celsius andρis water density. The sub-script 20 denotes the values of the corresponding parameter at 20◦C by the relations given by Heggen (1983).
Although Eq. (6) was derived for indexing gas transfer coefficients at water surfaces without significant air entrain-ment, it is in close agreement (less than 5% difference in the 10–30◦C range) with the indexing relation proposed by liver et al. (1991). The indexing relation proposed by Gul-liver et al. (1991) is theoretically based upon the velocity of a bubble suspended in a turbulent flow and the mass transfer across a bubble and also shows theD1/2dependence.
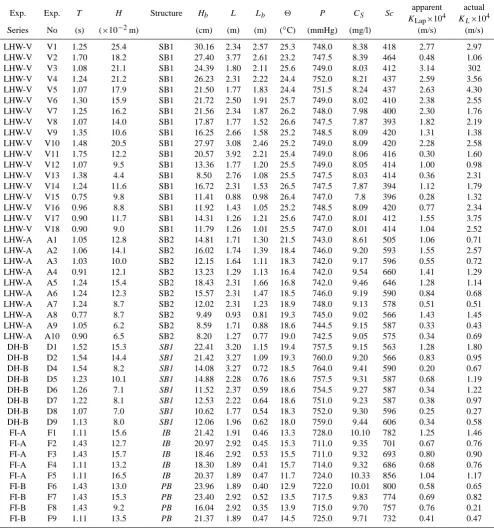
The experimental conditions, i.e. wave characteristics, wa-ter depth, wawa-ter temperature and atmospheric pressure are summarized in Table 1. The actual transfer coefficientsKL, determined through Eq. (5) and the apparent transfer coef-ficientsKLap, determined in Eq. (4), i.e. neglecting the hor-izontal flux, are also given for comparison purposes in Ta-ble 1. The transfer coefficients calculated in Eq. (4) (seeKLap in Table 1) for large-scale experiments were lower than those in small-scale experiments, for experiments with the same wave characteristics, suggesting that oxygen transfer de-pends on the dimensions of experimental facilities (Tsoukala and Moutzouris, 1997; Tofa, 2000). Actual oxygen trans-fer coefficients, as computed from a discretized form of the transport equation and accounting for longitudinal disper-sion, through Eq. (5), (seeKLin Table 1) are found in the same order of magnitude for both small- and large-scale ex-periments (Tsoukala, 2000). Therefore, it is concluded that the developed horizontal flux should not be neglected dur-ing the calculation of actual transfer coefficients from ex-perimental data, as it is proven that neighboring areas to the breaking zone experience substantially different gas transfer coefficients.
D.O.-time histories computed according to Eq. (5), as well as measured D.O. concentrations are shown in Fig. 4 for six different experiments. The initial condition is specified to match experimental data. Measured and predicted values are in good agreement, justifying the use of Eq. (5).
4 Model formulation
The first surface renewal model proposed by Dankwerts (1970) expresses the transfer coefficient as a function of the rate of surface renewal as follows:
KL∝
p
Dmr orKLSc1/2∝
√
ν r, (7)
whereKLis the transfer coefficient,Dmis the molecular dif-fusivity of the gas in water, ν is the kinematic viscosity of the water, Sc=ν/Dmthe Schmidt number andris the average surface renewal rate.
Daniil and Moutzouris (1995) presented a vorticity-based renewal model for gas transfer under breaking waves. The surface renewal rate was expressed as:
r=αrωGr, (8)
Table 1. Wave characteristics and corresponding transfer coefficients from the experiments.
Exp. Exp. T H Structure Hb L Lb 2 P CS Sc apparent actual KLap×104 KL×104 Series No (s) (×10−2m) (cm) (m) (m) (◦C) (mmHg) (mg/l) (m/s) (m/s) LHW-V V1 1.25 25.4 SB1 30.16 2.34 2.57 25.3 748.0 8.38 418 2.77 2.97 LHW-V V2 1.70 18.2 SB1 27.40 3.77 2.61 23.2 747.5 8.39 464 0.48 1.06 LHW-V V3 1.08 21.1 SB1 24.39 1.80 2.11 25.6 749.0 8.03 412 3.14 302 LHW-V V4 1.24 21.2 SB1 26.23 2.31 2.22 24.4 752.0 8.21 437 2.59 3.56 LHW-V V5 1.07 17.9 SB1 21.50 1.77 1.83 24.4 751.5 8.24 437 2.63 4.30 LHW-V V6 1.30 15.9 SB1 21.72 2.50 1.91 25.7 749.0 8.02 410 2.38 2.55 LHW-V V7 1.25 16.2 SB1 21.56 2.34 1.87 26.2 748.0 7.98 400 2.30 1.76 LHW-V V8 1.07 14.0 SB1 17.87 1.77 1.52 26.6 747.5 7.87 393 1.82 2.19 LHW-V V9 1.35 10.6 SB1 16.25 2.66 1.58 25.2 748.5 8.09 420 1.31 1.38 LHW-V V10 1.48 20.5 SB1 27.97 3.08 2.46 25.2 749.0 8.09 420 2.28 2.58 LHW-V V11 1.75 12.2 SB1 20.57 3.92 2.21 25.4 749.0 8.06 416 0.30 1.60 LHW-V V12 1.07 9.5 SB1 13.36 1.77 1.20 25.5 749.0 8.05 414 1.00 0.98 LHW-V V13 1.38 4.4 SB1 8.50 2.76 1.08 25.5 747.5 8.03 414 0.36 2.31 LHW-V V14 1.24 11.6 SB1 16.72 2.31 1.53 26.5 747.5 7.87 394 1.12 1.79 LHW-V V15 0.75 9.8 SB1 11.41 0.88 0.98 26.4 747.0 7.8 396 0.28 1.32 LHW-V V16 0.96 8.8 SB1 11.92 1.43 1.05 25.2 748.5 8.09 420 0.77 2.34 LHW-V V17 0.90 11.7 SB1 14.31 1.26 1.21 25.6 747.0 8.01 412 1.55 3.75 LHW-V V18 0.90 9.0 SB1 11.79 1.26 1.01 25.5 747.0 8.01 414 1.04 2.52 LHW-A A1 1.05 12.8 SB2 14.81 1.71 1.30 21.5 743.0 8.61 505 1.06 0.71 LHW-A A2 1.06 14.1 SB2 16.02 1.74 1.39 18.4 746.0 9.20 593 1.55 2.57 LHW-A A3 1.03 10.0 SB2 12.15 1.64 1.11 18.3 742.0 9.17 596 0.55 0.72 LHW-A A4 0.91 12.1 SB2 13.23 1.29 1.13 16.4 742.0 9.54 660 1.41 1.29 LHW-A A5 1.24 15.4 SB2 18.43 2.31 1.66 16.8 742.0 9.46 646 1.28 1.14 LHW-A A6 1.24 12.3 SB2 15.57 2.31 1.47 18.5 746.0 9.19 590 0.84 0.68 LHW-A A7 1.24 8.7 SB2 12.02 2.31 1.23 18.9 748.0 9.13 578 0.51 0.51 LHW-A A8 0.77 8.7 SB2 9.49 0.93 0.81 19.3 745.0 9.02 566 1.43 1.45 LHW-A A9 1.05 6.2 SB2 8.59 1.71 0.88 18.6 744.5 9.15 587 0.33 0.43 LHW-A A10 0.90 6.5 SB2 8.20 1.27 0.77 19.0 742.5 9.05 575 0.34 0.69 DH-B D1 1.52 15.3 SB1 22.41 3.20 1.15 19.4 757.5 9.15 563 1.28 1.80 DH-B D2 1.54 14.4 SB1 21.42 3.27 1.09 19.3 760.0 9.20 566 0.83 0.95 DH-B D4 1.54 8.2 SB1 14.08 3.27 0.72 18.5 764.0 9.41 590 0.20 0.67 DH-B D5 1.23 10.1 SB1 14.88 2.28 0.76 18.6 757.5 9.31 587 0.68 1.19 DH-B D6 1.26 7.1 SB1 11.52 2.37 0.59 18.6 754.5 9.27 587 0.34 1.22 DH-B D7 1.22 8.1 SB1 12.53 2.22 0.64 18.6 751.0 9.23 587 0.38 0.97 DH-B D8 1.07 7.0 SB1 10.62 1.77 0.54 18.3 752.0 9.30 596 0.25 0.27 DH-B D9 1.13 8.0 SB1 12.06 1.96 0.62 18.0 759.0 9.44 606 0.34 0.58 FI-A F1 1.11 15.6 IB 21.42 1.91 0.46 13.3 728.0 10.10 782 1.25 1.46 FI-A F2 1.43 12.7 IB 20.97 2.92 0.45 15.3 711.0 9.35 701 0.67 0.76 FI-A F3 1.43 15.7 IB 18.46 2.92 0.53 15.5 711.0 9.32 693 0.80 0.90 FI-A F4 1.11 13.2 IB 18.30 1.89 0.41 15.7 714.0 9.32 686 0.68 0.76 FI-A F5 1.11 16.5 IB 20.37 1.89 0.47 11.7 724.0 10.33 856 1.04 1.17 FI-B F6 1.43 13.0 PB 23.96 1.89 0.40 12.9 722.0 10.01 800 0.58 0.65 FI-B F7 1.43 15.3 PB 23.40 2.92 0.52 13.5 717.5 9.83 774 0.69 0.82 FI-B F8 1.43 9.2 PB 16.04 2.92 0.35 13.9 715.0 9.70 757 0.76 0.21 FI-B F9 1.11 13.5 PB 21.37 1.89 0.47 14.5 725.0 9.71 732 0.41 0.47
SB1: Sloping beach with slope 1:2.3, SB2: Sloping beach with slope 1:2.3, IB/PB: impermeable/permeable breakwater with a 1:1.5 sloping
front,
2138 V. K. Tsoukala and C. I. Moutzouris: Gas transfer under breaking waves
Document1 29/7/2008 30
[image:8.595.110.424.60.529.2]Figure 4.
Measured and predicted
through Equation (5) D.O. time histories
Fig. 4. Measured and predicted through Eq. (5) D.O. time histories.Various dimensionless parameters have been examined (Tsoukala, 2000; Tsoukala et al., 2001), including the ones proposed by Irribaren (Irribaren et al., 1949), Galvin (Galvin, 1968), as well as the Wave Reynolds Number (Zhang and Sunamara, 1990), for incorporation into the surface renewal rate as an expression of theGrfunction. The Wave Reynolds Number (Rewb)for breaking waves was finally selected and the factorGr is now represented by the following equation:
Gr =a×Rewb, (9)
wherea is a constant determined from the experimental re-sults. Rewb is derived from the following equation (Zhang and Sunamura, 1990):
Rewb= HbLb
νT , (10)
whereHbandLb are the breaking wave height and length, respectively, andT is the wave period. The wave heights in the breaking zone are calculated from the following equation of Le Mehaute and Koh (1967):
Hb
.
H0=0.76(tanα)1/7γ −1/4
o , (11)
the equation suggested by the US Army Corps of Engineers (1990):
Lb=T (gdb)1/2, (12)
wheredbis the water depth at the breaking point.
Equations (9), (10) and (8) give the rate of surface renewal as follows:
r=αrωRewb. (13)
And the following expression is finally derived for oxygen transfer coefficient:
KL=ar
p
DmRewbω (14)
or
KLSc0,5=αr
p
Rewbν ω. (15)
The parameterαrwas found to be equal to 0.1 with the appli-cation of the least-squares method on the experimental values ofKL
KLSc0.5=0.1
p
Rewbν ω. (16)
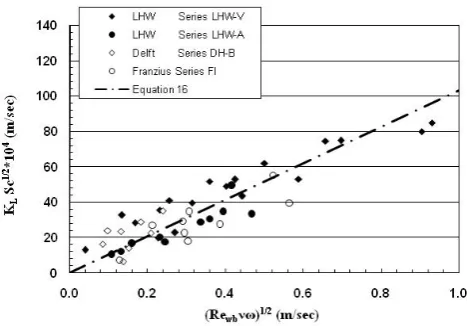
The correlation coefficient of the experimental values of KL with the proposed equations results is particularly high (R2=0.78) compared to respective correlations published by Hosoi et al. (1977) and Daniil and Gulliver (1991). Oxygen transfer coefficients from the experimental measurements, as computed using Eq. (5), are compared to the proposed model of Eq. (16) in Fig. 5.
Further, the quantitative comparison between the vortic-ity model of Daniil and Moutzouris (1995) and the proposed modified vorticity model in the present paper was investi-gated by comparing the two statistical parameters of bias or distortion (b) and Root Mean Squared Error (RMSE) for each data set and for all the data sets that were used for Eq. (16). It is proven from the values of the statistical indicators in Ta-ble 2 that the modified model represents more accurately the experimental data.
The introduction of the Reynolds wave number for the prediction of the oxygen transfer coefficient in the proposed model is theoretically consistent, as it is based upon the as-sumptions by Aisa (1981), Daniil and Gulliver (1991) and George et al. (1995). The developed modified model presents an improved tool compared to the vorticity-based model of Daniil and Moutzouris (1995) with the introduction of the Reynolds number for breaking waves.
Besides considering that the temperature dependence and gas transfer is expressed through Sc1/2 it is believed that Eq. (30) can be used to describe the flow of various liquid phase controlled compounds. To succeed in this, as well as to infer from fresh water to salt water, it is required to exam-ine the effect of bubbles entraexam-ined in the breaker zone on air-water oxygen transfer, as the bubble distributions are quite different between different gases and between the two types
Tsoukala&Moutzouris_AG_2007207.doc 11/6/2008 34
[image:9.595.311.545.62.225.2]Figure 5. Comparison of the transfer coefficients KL as computed from Equation (5), with the proposed Modified Vorticity Model of Equation (16).
Fig. 5. Comparison of the transfer coefficients KL, as
com-puted from Eq. (5), with the proposed modified vorticity model of Eq. (16).
of water (Chanson, 1997; Chanson et al., 2006). According to the model proposed by Asher et al. (2002) the fractional contribution of bubbles to the total transfer velocity is limited to a maximum value of 25%. The above prediction is con-sistent with accepted theories of bubble-mediated gas trans-fer, which state that bubble processes are less important for relatively soluble gases such as O2 and CO2 (Memery and Merlivat, 1985; Woolf, 1993).
Moreover, Eq. (16) could be used as a valid tool for the prediction of the oxygen transfer coefficient as a function of the wave characteristics.
5 Comparison with literature data
There are many sets of data published from experimental measurements performed for the determination of the oxy-gen transfer coefficient in water bodies. However, little ex-perimental information exists on the effect of mechanically generated waves. Even less data had been published from measurements involving breaking waves on sloping sea bot-toms and on coastal structures.
In Fig. 6, Eq. (16) is compared with results from exper-iments conducted by Kakuno et al. (1995) and Daniil and Moutzouris (1994) with breaking waves on a sloping, imper-meable beach. Kakuno et al. (1995) performed experiments using a 20 m long, 50×10−2m wide and 50×10−2m deep wave flume, with a constant water depth of 30×10−2m. A uniformly sloping bottom with a slope of 1:20 was placed at the one end of the flume and mechanical waves were pro-duced with heights between 3.5×10⁻²m and 11.60×10⁻²m and periods between 0.88 s and 1.40 s. The measurements by Kakuno et al. give values higher than Eq. (16).
2140 V. K. Tsoukala and C. I. Moutzouris: Gas transfer under breaking waves
Table 2. Statistical comparison of the present modified model and Vorticity model of Daniil and Moutzouris (1995).
Experimental Modified Vorticity Model Vorticity Model
Series Daniil and Moutzouris (1995)
bias (m/s) RMSE (m/s) bias (m/s) RMSE (m/s)
Daniil and Moutzouris (1995) 1.26 0.43 1.12 0.57
LHW-V 0.83 0.30 0.91 1.42
LHW-A 1.13 0.21 1.51 0.65
DH-B 0.86 0.52 0.35 1.08
FI 1.24 0.41 1.31 0.48
All data of the present study 0.99 0.36 1.08 0.94
Tsoukala&Moutzouris_AG_2007207.doc 11/6/2008 35
[image:10.595.310.543.253.441.2]
Figure 6. Comparison of Equation (16) with experimental data from impermeable sloping beaches.
(circles denote the results for the spilling break (SP), triangles denote the results for the plunging break (PL), of Kakuno et al. (1995) experiments).
Fig. 6. Comparison of Eq. (16) with experimental data from
imper-meable sloping beaches (circles denote the results for the spilling break (SP), triangles denote the results for the plunging break (PL), of Kakuno et al. (1995) experiments).
was the same as in Series LHW-V, but with a different water depth. It is found that Eq. (16) is satisfactory for the oxy-gen transfer coefficient for various water depths and beach slopes.
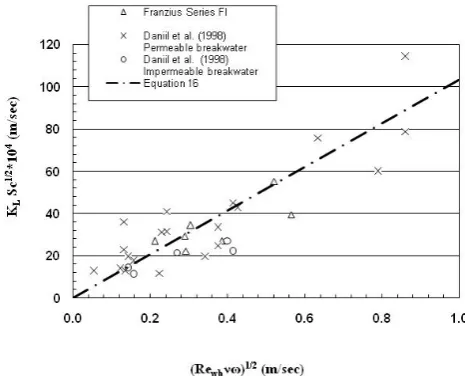
In Fig. 7 results from experiments conducted in the vicin-ity of permeable and impermeable breakwaters by Daniil et al. (1998) are compared to Eq. (16). Their experiments were conducted in the wave flume of LHW, for three different wa-ter depths, namely 0.56 m, 0.76 m and 0.83 m. Wave heights ranging between 5.60×10⁻²m and 20×10−2m and periods ranging between 0.75 s and 1.75 s were used. Although wave breaking on a rubble mound breakwater is less intense than on a sloping beach and, therefore, dissipation of energy is less significant, the oxygen transfer coefficients are rather well derived from the proposed equation.
Tsoukala&Moutzouris_AG_2007207.doc 11/6/2008 36
Figure 7. Comparison of Equation (16) with experimental data from the vicinity of rubble-mound coastal structures. (Crosses denote permeable breakwater, circles and triangles denote impermeable breakwater).
Fig. 7. Comparison of Eq. (16) with experimental data from the
vicinity of rubble-mound coastal structures (crosses denote perme-able breakwater and circles denote impermeperme-able breakwater).
6 Conclusions
In the present paper the oxygen transfer coefficient is de-scribed with a surface renewal model. The rate of surface renewal in the area of a sloping beach depends on the wave characteristics and the slope of the beach. The model also describes the effect of turbulence on the water oxygenation. The rate of surface renewal is expressed as a function of the wave vorticity and the non-dimensional Reynolds number for breaking waves.
[image:10.595.50.286.253.432.2]two models were further compared quantitatively by compar-ing bias estimator and root mean square errors for each data set and for all the data sets that are used for the prediction of Eq. (16).
It is also concluded after the comparison of the proposed equation with experimental data from the literature that it could describe with considerable accuracy the oxygen trans-fer mechanism under breaking waves in the vicinity of im-permeable and im-permeable coastal structures.
In order to reduce scale effects, the model was validated with experimental data from measurements in both small and large-scale laboratory facilities. Although the results are en-couraging, further measurements are now necessary to be made in nature and additional research is needed, to incor-porate the influence of bubble mediated gas exchange. Acknowledgements. The research was partly financed by the
Eu-ropean Union, “Human Capital Mobility – Large Installations Pro-gram” (1994) for those experiments conducted in the Laboratory of Delft Hydraulics, The Netherlands, and “Training and Mobility of Researchers – Access to Large-Scale Facilities Program” (1999), for the experiment conducted at the Franzius Institute, University of Hanover, Germany. Measurements at the Laboratory of Harbour Works, National Technical University of Athens (LHW) were fi-nanced by the LHW. The authors would also like to acknowledge E. I. Daniil for her contribution during the setup of the experimen-tal procedure and for her invaluable scientific aid for the integration of the present study.
Topical Editor S. Gulev thanks D. Woolf and another anony-mous referee for their help in evaluating this paper.
References
Aisa, L., Caussade, B., George, J., and Masbernat, L.: Echanges de gaz dissous en ´ecoulements stratifi´es de gaz et de liquide, Int. J. Heat Mass Transfer, 24, 1005–1018, 1981.
ASCE: Standard, Measurement of oxygen transfer in clean water, ASCE, New York, USA, 1993.
Asher, W., Edson, J., McGillis, W., Wanninkhof, R. H., D. T., and Liitchendorf, T.: Fractional area whitcap coverage and air sea gas transfer velocities measured during GasWx-98, Iin: Gas Transfer at Water Surfaces, Geophys. Monogr., 127, 199–203, 2002. Asher, W. E., Karle, L. M., Higgins, B. J., Farley, P. J., Monahan, E.
C., and Leifer, I. S.: The influence of bubble plumes on air-water gas transfer velocities, J. Geophys. Res., 101, 12 027–12 041, 1996.
Asher, W. E. and Wanninkhof, R.: The effect of bubble-mediated gas transfer on purposeful dual-gaseous tracer experiments, J. Geophys. Res., 103, 10 555–10 560, 1998.
Boettcher, E. J., Fineberg, J., and Lathrop, D. P.: Turbulence and Wave Breaking Effects on Air-Water Gas Exchange, Phys. Rev. Lett., 85(9), 2030–2033, 2000.
Borges, A. V., Djeenidi, S., Lacroix, G., Th´eate, J., Delille, B., and Frankignoulle, M.: Atmospheric CO2flux from
man-grove surrounding waters, Geophys. Res. Lett., 30, 1558, doi:10.1029/200GL01143, 2003.
Shear Flows, London, Academic Press, 1997.
Chanson, H., Aok, S., and Hoque, H.: Bubble entrainment and dis-persion on plunging jet flows: Freshwatervs. Seawater, J. Coastal Res., 22(3), 664–677, 2006.
Csanady, G. T.: The role of breaking wavelets in air-sea gas transfer, J. Geophys. Res., 95, 749–759, 1990.
Daniil, E. I. and Gulliver, J. S.: Temperature dependence of the liquid film coefficient for gas transfer, J. Environ. Eng., ASCE, 114(5), 1224–1229, 1988.
Daniil, E. I. and Gulliver, J. S.: The influence of waves on air-water gas transfer, J. Environ. Eng., ASCE, 117(5), 522–540, 1991. Daniil, E. I. and Moutzouris, C. I.: A vorticity-based model for gas
transfer under breaking waves, Ann. Geophys., 13, 1039–1046, 1995,
http://www.ann-geophys.net/13/1039/1995/.
Daniil, E. I., Tsoukala, V. K., and Moutzouris, C. I.: Harbor Basin Seawater Oxygenation through Rubble Mound Breakwater Structures, J. Mar. Environ. Eng., 4(4), 277–300, 1998. Daniil, E. I., Tsoukala, V. K., and Moutzouris, C. I.: The Beneficial
Role of Rubble Mound Coastal Structure on Seawater Oxygena-tion, Ann. Geophys., 1360–1371, 2000.
Dankwerts, P. V.: Gas Liquid Reaction, Mc Graw-Hill Book Com-pany, New York, USA, 1970.
de Leeuw, G. and Cohen, L. H.: Bubble size distribution on the North Atlantic and North Sea, in: Gas Transfer at Water Surfacrs, edited by: Donelan, M. A., Drennan, W. M., Saltzman, E. S., and Wanninkhof, R., AGU, Washington, D.C., 271–277, 2002. Donelan, M. A., Drennan, W. M., Saltzman, E. S., and Wanninkhof,
R.: Gas transfer at Water Surfaces, Geophys. Monogr., 127, AGU Washington, D.C., 2002.
Farmer, D. M., McNeil, C. L., and Johnson, B. D.: Evidence for the importance of bubbles in increasing air-sea flux, Nature, 361, 620–623, 1993.
Feddersen, F. and Trowbridge, J. H.: The Effect of Wave-breaking on Surfzone Turbulence and Alongshore Currents: A Modeling Study, J. Phys. Oceanogr., 35, 2187–2203, 2005.
Galvin, C. J.: Breaker type classification on three laboratory beaches, J. Geophys. Res., 73(12), 3651–3659, 1968.
Garrettson, G.: Bubble transport theory with application to the up-per ocean, J. Fluid Mech., 59, 187–206, 1973.
George, J., Caussade, B., and Masbernat, L.: Conceptual modeling of interfacial Gas-liquid mass transfer, Selected papers from the 3rd International Symposium on Air-Water Gas Transfer, in: Air Water Gas Transfer, edited by: J¨ahne, B. and Monahan, E. C., AEON, Germany, 69–78, 1995.
Gulliver, J. S., Thene, J. R., and Rindels, A. J.: Indexing gas transfer in self aerated flows, ASCE, J. Environ. Eng., 116(3), 503–523, 1991.
Heggen, R. J.: Thermal dependent physical properties of water, J. Hydraul. Eng., ASCE, 109(2) 298–302, 1983.
Higbie, R.: The rate of absorption of a pure gas into a still liquid during short periods of exposure, Trans. Am. Inst. Chem. Engi-neers, 31, 365–390, 1935.
Horsch, G. M.: Steady, diffusive – reactive transport in shallow tri-angular domains, J. Eng. Mech., ASCE, 124(10), 1135–1141, 1998.
2142 V. K. Tsoukala and C. I. Moutzouris: Gas transfer under breaking waves
Hosoi, Y. and Murakami, H.: Effect of breaking waves on dissolved oxygen and organic matter, Proceedings of the 20th Coastal En-gineering Conference, Chapter 184, CER Council ASCE, Taipei, Taiwan, 2498–2512, 1986.
Hosoi, Y., Murakami, H., and Mitsui, H.: Reaeration due to wave breaking at coastal structures, Coastal Engineering in Japan, 33(1), 89–100, 1990.
Irribaren, C. R. and Nogales, C.: Protection des ports, XVII, In-ternational Navigation Congress, Section II, Comm. 4, Lisbon, 27–47, 1949.
Jahne, B., Wais, T., and Barbaras, M.: A new optical measuring device: A simple model for bubble contribution to gas exchange, in: Gas Transfer at Water Surfaces, edited by: Brutsaert, W. and Jirka, B. H., D. Reidel, Hingman, MA, 237–246, 1984. Kakuno, S., Saitoh, M., Nakata, Y., and Oda, K.: The air-water
oxy-gen transfer coefficients with waves determined by using a mod-ified method, in: Air-Water Gas Transfer, Air-Water Gas Trans-fer, edited by: J¨ahne, B. and Monahan, E. C., AEON, Germany, 577–587, 1995.
Keeling, R. F.: On the role of large bubbles in air-sea gas exchange and supersaturation in the ocean, J. Mar. Res., 51, 237–271, 1993.
Kim, K. H. and Andrae, M. O.: Carbon disulfide in the estuarine, coastal and oceanic environments, J. Mar. Chem., 40, 179–197, 1992.
Kitaigorodskii, S.: On the fluid dynamical theory of turbulent gas transfer across an air-sea interface in the presence of breaking wind waves, J. Phys. Oceanogr., 14, 960–972, 1984.
LeMehaute, B. and Koh, R. C. Y.: On the breaking of waves arriving at an angle to the shore, J. Hydraul. Res., 5(1), 67–88, 1967. Melville, W. K.: The role of surface wave breaking in air-sea
inter-action, Ann. Rev. Fluid Mech., 28, 279–321, 1996.
Melville, W. K. and Matusov, P.: Distribution of breaking waves at the ocean surface, Lett. Nature, 417, 58–63, 2002.
Memery, L. and Merlivat, L.: Modeling of the gas flux through bubbles at the air-water interface, Tellus, Ser. B, 37, 272–285, 1985.
Merlivat, L. and Memery, L.: Gas Exchange across an air-water interface: experimental results and modeling of bubble contribu-tion to transfer, J. Geophys. Res., 88, 707–724, 1983.
Monahan, E. C. and Spillane, M. C.: The role of Whitecaps in air-sea gas exchange, in: Gas Transfer at Water Surfaces, edited by: Brutsaert, W. and Jirka, G. H., Reidel, Dordrecht, The Nether-lands, 495–503, 1984.
Patankar, S. V.: Numerical heat transfer and fluid flow, McGraw Hill, New York, USA, 1980.
Schluessel, P., Emery, W. J., and Soloviev, A. V.: Cool and fresh-water skin of the ocean during rainfall, Bound.-Lay. Meteorol., 82, 473–482, 1997.
Smith, R. L.: Ecology and Field Biology, 4th edition, Harper Collins Publishers New York, 1990.
Soloviev, A., Edson, J., McGillis, W., Schluessel, P., and Wan-ninkhof, R.: Fine thermohaline structure and gas-exchange in the near surface layer of the ocean during GasEx-98, in: Gas Transfer at Water Surfaces, edited by: Donelan, M. A., Drennan, W. M., Saltzman, E. S., and Wanninkhof, R., AGU, Washington, D.C., 181–185, 2002.
Terrill, E. J., Melville, W. K., and Stramski, D.: Bubble entrainment by breaking waves and their influence on optical scattering in the upper ocean, J. Geophys. Res., 106(C8), 16 815–16 823, 2001. Thomas, L. H.: Elliptic Problems in Linear Difference
Equa-tions over a Network, Watson Scientific Computing Laboratory, Columbia University, New York, 1949.
Tofa, E.: Large-scale experimental measurements at the Franzius Institute at the University of Hanover in Germany, for the oxy-genation in the vicinity of breakwater, Diploma Thesis, National Technical University of Athens, Athens, 2000.
Tsoukala, V. K.: Wave induced sea water oxygenation at the coastal zone, Doctoral Dissertation, National Technical University of Athens, Athens, 2000.
Tsoukala, V. K. and Moutzouris, C. I.: Scale effects in oxygenation in the breaker zone of coastal structures, in: Coastal Engineering 1996, ASCE, 1, 403–414, 1997.
Tsoukala, V. K., Daniil, E. I., and Moutzouris, C. I.: Positive effects of Coastal Structures on water quality, in: XXIX IAHR Congress Proceedings, Thinghua University Press, Theme B, Environmen-tal Hydraulics and Eco Hydraulics, 163–168, 2001.
Upstill-Goddard, R. C.: Air-sea gas exchange in the coastal zone, Estuarine Coastal and Shelf Science, 70, 388–404, 2006. US Army Corps of Engineers: Laboratory study on macro-features
of wave breaking over bars and artificial reefs, Technical Report CERC 90-12, CERC Waterways Experimental Station, Vicks-burg, Mississippi, USA, 1990.
Wanninkhof, R. and Bliven, L. F.: Relationship between gas ex-change, wind speed and radar backscatter in large wind wave tanks, J. Geophys. Res., 96(2), 2785–2796, 1991.
Woolf, D. K.: Bubbles and the air-sea transfer velocity of gases, Atmos.-Ocean, 31, 517–540, 1993.
Woolf, D. K.: Energy dissipation through wave breaking and the air-sea exchange of gases, in: Air-Water Gas Transfer, edited by: Jahne, B. and Monahan, E. C., AEON Verlag, Heidelberg, 185– 195, 1995.
Woolf, D. K.: Bubbles and their role in air-sea gas exchange, in: The Sea Surface and Global Change, edited by: Liss, P. S. and Duce, R. A., Cambridge University Press, 173–205, 1997. Woolf, D. K., Leifer, I. S., Nightingale, P. D., Rhee, T. S., Bowyer,
P., Caulliez, G., de Leeuw, G., Larsen, S. E., Liddicoat, M., Baker, J., and Andreae, M. O.: Modeling of bubble-mediated gas transfer: Fundamental principles and a laboratory test, J. Mar. Syst., 66, 71–91, 2007.
Woolf, D. K. and Thorpe, S. A.: Bubbles and the air-sea exchange of gases in near saturation conditions, J. Mar. Res., 49, 435–466, 1991.
Zhang, D. P. and Sunamura, T.: Conditions for the occurrence of vortices induced by breaking waves, Coastal Engineering in Japan, 332, 145–155, 1990.