209
Copyright © 2011-15. Vandana Publications. All Rights Reserved.
Volume-5, Issue-3, June-2015
International Journal of Engineering and Management Research
Page Number: 209-214
Comparison of Generalized Webometrics to the Institutional Webometrics
Ranking
Deepak Patidar1, Rupali Bhartiya2 1
PG Scholar, Department of Computer Science and Engineering,Shri Vaishnav Institute of Technology and Science, Indore, M.P, INDIA
2
Assistant Professor, Department of Computer Science and Engineering,Shri Vaishnav Institute of Technology and Science, Indore, M.P, INDIA
ABSTRACT
In this competitive era educational industries keep updated research and contributions online therefore research papers, articles and other web documents are published. The web administrators and managers can update their information on web. Using these published documents and the research; data on web demonstrate the growth and evolution. Moreover these credentials are used to find the world ranking and the contribution of educational industry. That ranking technique is termed as Webometrics. The ranking and growth of a university are listed using Webometrics Ranking. Consequently different universities all over the world and institutions are registered with the Webometrics to get their indexing according to their regions and their continents. In recent years that are observed that not only academic universities are take part in research direction, but an assortment of different companies and organizations are also participating in research and development. In order to implement and simulate the desired concept for different research industries required to estimate the updates on web documents thus the proposed ranking technique utilizes the API’s of different search engines for the web document searching. Using the obtained outcomes of the search API’s in terms of the number of web pages listing and web documents available are computed. This computation of documents on web is used to estimate web rank for given industry.
Keywords---- Webometrics, web crawler, WWW, and Search Engines
I.
INTRODUCTION
The new point of view of the web ranking is already providing exciting results and it can be as a complement to other universal initiatives. Now certainly national rankings
could provide more detailed insights but webometrics is already offering some advantages: enhanced recognition of the importance of distance learning, measuring the pledge to OAI, enhance the evaluation of technologies, and social sciences and also improve the evaluation of humanities. The objective and main goal of this project is to provide the following facts and study under webometrics creation and management, moreover offers to provide the global and local rating of the different service and business industries.
1. Analyze the approaches and advantages of webometrics
2. Find the gap between webometrics rating criteria and enhance them
3. Fill the gap between normal research organizations and webometrics understanding
4. Generalize the concept of webometrics to take advantage of the other domain of business and research.
The Webometrics University Ranking is a ranking system based on the university web subsistence, visibility and web entrance. This grading system measures how strongly a university is present in the web by its own web fizz, sub-pages, scholar credentials, predictable files and all that. The central hypothesis of this approach is that web presence is a reliable indicator of the global performance and prestige of the universities and as such, is an oblique way to measure all the university missions.
“If the web performance of an organization is below the expected position according to their research credential, particular organization authorities should reconsider their web tactic, encouraging substantial increases of the volume and quality of their electronic publications.”
210
Copyright © 2011-15. Vandana Publications. All Rights Reserved.
research topics and avoid unpromising ones and so methodsare needed to help this identification process.
Although the Web is universally recognized as one of the most relevant tools for scholarly publication, it is still very rare these indicators are used for the evaluation of the scientific research and the academic performance of universities. Ranking factor indicators of webometrics are provided to show the commitment of the institutions to a Web publication.
According to Thelwall -
- Webometrics is a set of methodologies and techniques for tracking and evaluating the impact of websites and online ideas and
- The information science research field that developed these thoughts.
Webometric techniques include web mention analysis, link analysis, search engine evaluation, and blog analysis but from the perspective of digital library evaluation the main method is link analysis".
Webometrics is a limited ranking system which provides ranking only for the universities according to their web document updates and newly introduced work progress. Due to observation that is found not only universities are work for research and development various other organizations are also providing their rle in the field of research and development, and there are not any kind of ranking system is available for these organizations. In order to promote these organization and business expansions in competitive era a new kind of ranking system is preferred. The obtainable paper provides an effort for globalizing the research trends and their ranking aspects.
This section provides an overview of the Webometrics and the work presented in this paper. Next section introduces the recent development and trends for designing web ranking system.
II.
BACKGROUND
Search engines are crucial for webometric ranking, because their databases are the source of information that covers most of the Web documents. Despite the fact that personal web crawlers can be used to automatically download pages and pull out their associations, profitable search engines have been used extensively for research especially when large areas or potentially the whole Web are the object of the study.
In order to perform a recovered research using commercial search engine facts, it is fundamental to get a good understanding of the industry context, the advanced functions offered and the limitations.
A feature of the search-engine market is the oligopoly of three search-engine operators Google, Yahoo! and Live Search, from a universal perception, contribute to the majority of the generalist search-engine market. In specific areas of the Web, they are other players such as Technocratic
for searching blogs. The industry of Search engine is under a constant process of change and innovation [4].
As already mentioned, commercial search engines are the only source of data that covers the complete WWW. However there are some significant limitations derived from the use of commercial search engines:
• Crawling and reporting algorithms are commercial secrets and, therefore the exact criteria used to rank the information is unknown [5].
• Search engines do not index the entire Web.
• Ranking systems eliminate similar or identical pages in their results, in order to avoid providing useless information.
• The total number of results offered by search engines is estimates as they use algorithms that priorities response time rather than exhaustiveness. • Results can be subject to national or language biases
[5].
• The results can fluctuate and change over the time. In addition, only a few numbers of pages are accessible (usually just a maximum of 1000). Commercial search engines are the best and unique source of information we have for certain types of webometric research, however they are not designed with this academic purpose and the results are not as exhaustive as we would desire. At this moment, Yahoo! is the search engine that is more useful for webometric research. Yahoo! inlink data can be gathered in two different ways, through the general Yahoo! search engine and through Yahoo! Site Explorer. Despite the latter specializing in web structure information, complex queries can only be submitted through the general Yahoo! search engine interface [8].
Nevertheless, collecting data can be a very time consuming process if using the web interface. This problem could be overcome by specialized software based on the application programming interfaces (API) developed by search engines and other services on the Web.
Web presence measures the activity and visibility of the institutions and it is a good indicator of impact and prestige of Universities, Research Centers and Hospitals. Rank summarizes the global performance of the Universities, Research Centers and Hospitals, provides information for candidate students, patients, researchers, physicians, managers, scholars and citizens in general, and reflects the commitment to the dissemination of scientific knowledge.
After realizing the importance of the search engines as the main intermediaries in the information access processes in the web, new indicators were introduced to solve the problems derived from the instability of search engine results and the artifacts produced by the Web Impact Factor.
211
Copyright © 2011-15. Vandana Publications. All Rights Reserved.
research results published in prominent conferences, thesame document writer develop a wide range of activities reflected on the websites. Instruction documents, unrefined material, presentation materials, software, drafts, bibliographic or link lists are also relevant and inform about the commitment of professors to their students. The information provided by the institutions like composition, structure, and all kinds of administrative information itself are very precious. When this information is made publicly available in the course of the web, this shows the high academic level of the organization. The world wide web is providing a comprehensive way to describe this wider range of activities where scientific publications are only one of components to be found on a website.
III.
DESIGN AND WEIGHTING OF
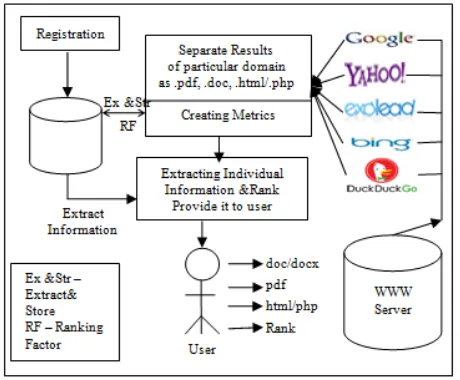
INDICATORSThe unit for analysis is the institutional domain, so only universities, hospitals and research centers with an independent web domain are considered. If an institution has more than one main domain, two or more entries are used with the different addresses. The first Web indicator, Web Impact Factor (WIF), was based on link analysis that combines the number of external inlinks and the number of pages of the website, a ratio of 1:1 between visibility and size. This ratio is used for the ranking, adding two new indicators to the size component: Number of documents, measured from the number of rich files in a web domain, and number of publications being collected by Google Scholar database. Four indicators were obtained from the quantitative results provided by the main search engines as follows:
Size (S) - Number of pages recovered from five engines: Google, Yahoo, Bing, exalead, and DuckDuckGo [12]. For each engine, results are log-normalized to 1 for the highest value. Then for each domain, maximum and minimum results are excluded and every organization is assigned a rank according to the combined sum [10]. The inclusion of the total number of pages is based on the recognition of a new global market for academic information, so the web is the adequate platform for the internationalization of the organization. A strong and detailed web presence providing exact descriptions of the structure and activities of the organization can attract new students, scholars, and researchers worldwide.
Visibility (V) - The total number of unique external links received (inlinks) by a site can be only confidently obtained from Yahoo Search. Results are log-normalized to 1 for the highest value and then combined to generate the rank. The number of external inlinks received by a domain is a measure that represents visibility and impact of the published material [10], and although there is a great diversity of motivations for linking, a significant fraction works in a similar way as bibliographic citation.
RichFiles (R)
Figure 1 Weights of Indicators Source: www.webometrics.info
- After evaluation of their relevance to academic and publication activities and considering the volume of the different file formats, the following were selected: Adobe Acrobat (.pdf), Adobe PostScript (.ps), Microsoft Word (.doc/ .docx) and Microsoft PowerPoint (.ppt). These data were extracted using Google, Yahoo, Bing, Exalead, and DuckDuckGo. These data were extracted using Google and merging the results for each file type after log-normalizing in the same way as described before. The success of self-archiving and other repositories related initiatives can be roughly represented from rich file and Scholar data. The huge numbers involved with the pdf and doc formats means that not only administrative reports and bureaucratic forms are involved. PostScript and PowerPoint files are clearly related to academic activities.
212
Copyright © 2011-15. Vandana Publications. All Rights Reserved.
IV.
RESULT AND ANALYSIS
1. SERVER RESPONSE
The amount of time required to find the Webometrics ranking after making request is known as the server response time. The estimated server response time of the both system is demonstrated using figure 3. In this figure the X axis contains the number of experiments and the Y axis provides the required response time for different experimentations. According to the results the server response time is depends on the number of documents listing in the different search engines. The system counts the document listing of different web search engines. Thus that is also depends on the workloads on the different servers and the application server where the Webometrics system is parked. As per given results the proposed system consumes less time as compared to the traditional technique.
Figure 3 Server Response Time
2. MEMORY CONSUMPTION
Memory consumption is sometimes also called memory utilization or the space complexity. The memory consumption is the amount of main memory which is consumed during the web page delivery from the web server. Thus the memory consumption of the proposed system is computed on the server machine. The required memory consumption in different experimentations is reported using the figure 5. In this figure the X axis contains the different experiments performed with
the system and the Y axis shows the amount of main memory consumed in terms of KB (kilobytes). According to the given results as the server response time is fluctuating, the memory consumption of the system is also fluctuating with different
0 5 10 15 20
1 2 3 4 5 6 7
res
po
nc
e t
im
e
in
S
ec
Number of experiments
Proposed System Traditional Technique
A B
C D
E F
213
Copyright © 2011-15. Vandana Publications. All Rights Reserved.
experiments. According to the comparative outcomes of thetraditional and proposed technique the performance of the proposed technique is much optimum than traditional one, because the system generates less number of documents which are more appropriate according to the defined search query.
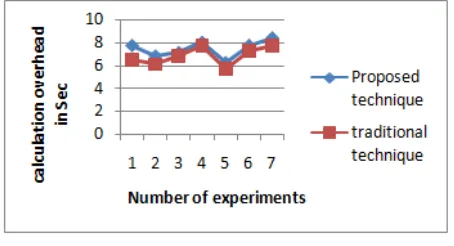
3. CALCULATIONS OVERHEAD
The amount of time required to calculate the new Webometrics results is known as the calculation overhead. This time is not includes the requesting time, resolving time and others it is only the amount of time required to compute the Webometrics ranking results. The computational overhead is given in figure 6, in this diagram the X axis shows the number of different experiments and the Y axis shows the amount of time required in terms of seconds. According to the obtained results the computational overhead increases as the amount of web page listing in different web search engines. Because additional time is required to extract the contents, filter the contents and count them. Thus computational overhead is depend on the documents listing for queried web URL. The comparative results of the traditional and proposed technique is given using figure 6, in this diagram the computational overhead is defined the traditional technique requires less amount of data to process and obtain the rank thus the computational overhead of the traditional search system is less as compared to proposed system.
GUI and Demonstration
The complete system is design in two foremost parts. Primary, admin module and the second is web clients (consumes who are providing information and services through web) are able to register and get access on their console to manage their account using figure 4(A) the user can find the web administrators are found their report using figure 4(B) admin can find their reposrts using figure 4(F) in this console can find all reports in a sigle screen according to figure 4(D) and for detailed view use figure 4(E).
V.
CONCLUSION
The implementation of the proposed concept is provided using the JSP (java server pages) technology and the performance is computed in different parameters. For extracting the performance of the system memory consumption, server response time and computational overhead is computed. According to the obtained results the proposed models consumes less resource and produce less overhead and produces accurate comparative ranking of different business and scientific domains. In addition of that the proposed ranking methodology provides the clustered domain ranking system by which domain specific ranking becomes more precise and accurate. In order to compute the Webometrics outcomes for the different business and research domains for every organizations a new technique is designed. This technique utilizes the web documents are available on the web search indexing additionally the updates on these web domains are also included to update the ranking scores. The implementation of the proposed methodology needs to find results from the different search engines thus yahoo search, Google web search, Google scholar search, Bing search and duck-duck go search engines outcomes are utilized. The implementation of the proposed Webometrics calculation is performed using JAVA technology and their performance is computed in terms of server response time, memory consumption and computational overhead. The estimated outcomes of their performance are listed using table 1
S. No Parameters Descriptions
1 Memory consumption
Average memory consumption that is depends on the amount of web document listing
2 Computational overhead
Low computational overhead
3 Server response time
Low server response time
Table 1 Performance Summary
VI.
ACKNOWLEDGEMENT
With due respect we would like to inform, that the article which we had proposed is prepared for academic scenario, that is not feasible for industrial research purpose the references which we had taken from listed here, one or not only references there are many other references which we had taken from real world and from daily life aspects. So it is vary through to remember all those references.
[1] Muammer Kaya, Ergun Cetin, Andac Sözeri, “Introduction To Webometrics: Quantitative Web Research
214
Copyright © 2011-15. Vandana Publications. All Rights Reserved.
For The Ranking Of World Universities; Research CentersAnd Hospitals”
[2] Tomas C Almind, and Peter Ingwersen, "Informetric analyses on the World Wide Web: methodological approaches to 'webometrics'." Journal of documentation 53.4: 404-426, 1997.
[3] Lennart Björneborn, and Peter Ingwersen, "Toward a basic framework for webometrics." Journal of the American Society for Information Science and Technology 55.14: 1216-1227, 2004.
[4] J Bar-Ilan, “The use of Web search engines in information science research” in Cronin, B. (Ed.), Annual review of information science and technology, pp. 231–288, Medford 2004.
[5] M. Thelwall, L. Vaughan, and L. Björneborn,
‘Webometrics‘, in Cronin B. (ed.), Annual review of information science and technology, 39, pp 81-135, Medford 2005
[6] Girardi, Christian, Filippo Ricca, and Paolo Tonella. "Web crawlers compared."International Journal of Web Information Systems 2.2: 85-94, 2006.
[7] Mike Thelwall, "Quantitative comparisons of search engine results." Journal of the American Society for Information Science and Technology
[15] A. Abrizah, Mohammadamin Erfanmanesh, Vala Ali Rohani, Mike Thelwall, Jonathan M. Levitt, Fereshteh Didegah, “Sixty-four years of informetrics research:
productivity, impact and collaboration” Scientometrics DOI 10.1007/s11192-014-1390-8, 2014
59.11: 1702-1710, 2008.
[8] Esteban Romero-Frías, “Googling Companies - a Webometric Approach to Business Studies” The Electronic Journal of Business Research Methods Volume 7 Issue 1, (pp.93 - 106) 2009.
[9] Handaru Jati, “Comparison of University Webometrics Ranking Using Multicriteria Decision Analysis: TOPSIS and VIKOR Method” World Academy of Science, Engineering and Technology 71 2012.
[10] Deepak Patidar, Rajeev G Vishwakarma, “Webometrics
Rank Inspection: Proposed for Business Domain” IJCA (0975 – 8887) Volume 77– No.3, September 2013.
[11] R. K. Pandey, “Empirical Validation of Webometrics based Ranking of World Universities” (IJCSIT) Vol. 5 (1), 580-584, 2014.
[12] Deepak Patidar, Rajeev G Vishwakarma, “An
Implementation of Generalized Webometrics for All Research Organizations” ICSSS, Chennai, INDIA, 978-1-4799-6506-9/8 © IEEE 2014.
[13] Fiala Dalibor, “Sub-organizations of institutions in computer science journals at the turn of the century” Malaysian Journal of Library & Information Science, Vol. 19, no. 2 : 53-68, 2014
[14] Chung Chung Joo, Park Han Woo, “Mapping Triple Helix innovation in developing and transitional economies: webometrics, scientometrics, and informetrics” Scientometrics 99:1–4 DOI 10.1007/s11192-013-1105-6, 2014