Volume 3, Issue 1, January 2014
Page 344
ABSTRACT
In this paper describes an algorithm for determining the line outage contingency of a line taking into account of line over load effect in remaining lines and subsequent tripping of over loaded line(s) leading to possible system split of a power system. Line outage indices based on line overload, loss of load, loss of generation and static voltage stability are computed to indicate severity of a line outage of a selected line. This paper work proposes a hybrid method of reducing the response time of static screening by adopting line reactive losses and bus reactive compensation as the critical system factors and by using the power flow changes resulted from direct, one-iteration power flow model in determining the compensation. The hybrid approach produces an index, reactive loss compensation index, which decides the severity ranking of the contingencies. The main objective of our paper is simulation of reactive loss compensation index for IEEE-30 bus system using MATLAB. The simulated result is compared with the VAR limiting index.
Keywords: RLCI(reactive loss compensation index),VAR(reactive volt ampere)
1. INTRODUCTION
Power system is made of interconnected components, each designed to play a critical role for the smooth operation of the system at all times. Since the operating condition of power system changes continually, definite prediction of the status of the system would be difficult, where the components to fail to play their roles. In the past, the system status prediction was possible only in off-line studies. Running a full AC load flow solution for all the possible system outages to check for limit violations is time consuming and thus out of the question for real-time application. Power industry has developed analytical tools which can determine, in real time, the impact of losing any of these components to the security of the overall system. The main function of the tools is to assess outages and contingencies. In performing the function, the tools are focused on the minimization of the output response time of their solution with accuracy within the requirement of the contingency assessment. One common approach for response time reduction is to apply a screening technique that ranks the outages in the order of severity based on a calculated system performance index, a scalar value which measures how much a particular outage case impacts the power system. A detailed analysis can then be performed only on those highly ranked outages, saving computation time. The calculation of performance index therefore dictates the response time of the screening and contingency analysis. The system performance index is usually derived from "critical system factors" by which system status can be uniquely determined. Two of the most widely used variables as critical system factor are bus voltage magnitude and megawatt overload on transmission lines. They are used together, in the evaluation. One problem in screening using megawatt overload alone by the deviation from the rated value on transmission lines is that voltage and reactive flow violations are not disclosed. Judged by the importance of the information on voltage and reactive power, evidenced in the major blackouts, this drawback erases any computational time savings made from the application of megawatt overload. Therefore, it is possible that a short list of the severity rankings produced by the megawatt overload screening does not include the most severe contingency determined by voltage and reactive power screening. As a variant of megawatt overload screening, El-Abiad et. Al, introduced a pre-calculated distribution factor of each line as a way to check for megawatt overloads deviations and, using the distribution factor, developed a screening method which assessed the severity of every contingency quickly. The variant, however, could not overcome the inherent problem in using megawatt overload alone: exclusion of the voltage limit violations in the contingency evaluation. Unlike the megawatt
FAST STATIC CONTINGENCY
SCREENING BASED ON REACTIVE
LOSS COMPENSATION INDEX
Santhosh Raikar M 1, Siddalingappa A.M2,Naveen S3
1
Lecturer ,Dept. of E&E,S.T.J.Insititue of Technology.Ranebennur ,Karnataka ,India
2
Lecturer ,Dept.of E&E,S.T.J. Insititue of Technology..Ranebennur,Karanataka,india
3
Volume 3, Issue 1, January 2014
Page 345
overload or voltage, reactive power has not attracted much interest as a variable for critical system factor; however, its usefulness has stimulated considerable amount of research effort. Several pioneering works spread the use of reactive power and bus voltage magnitude deviation as critical system factors for fast performance index calculationII.FORMULATION OF LOAD FLOW PROBLEM
The load flow problem consists of calculation of voltage magnitude and its phase angle at the buses, and also the active and reactive line flows for the specified terminals or bus conditions associated with each bus of the power system network, there are four quantities such as:
1)Magnitude of voltage, |V| 2) Phase angle of voltage, 3) Real power, |P| 4) Reactive power, |Q|
In a power system, the buses are divided into three types based on these four quantities for the load flow calculation. It is necessary to select one bus, as slack bus to provide the additional real and reactive power to supply the transmission losses, since these are unknown until the final solution is obtained.
The three types of buses are:
1)Slack bus 2) Generator bus 3) Load bus
Slack bus: At this bus, voltage magnitude and phase angle are specified. Generator bus: At this bus real power and voltage magnitude are specified. Load bus: At this bus real and reactive powers are specified.
The network connections are described by using code numbers assigned to each bus. These numbers specify the terminals of transmission lines and transformers, code numbers are also used to identify the type of buses, the location of static capacitors, shunt reactors, and those network element in which off-nominal turns ratios of transformers are to be represented.
III.TECHNIQUES OF SOLVING LOAD FLOW PROBLEM
The development of any method for the load flow study on the digital computer requires the following 1. The mathematical formation of the load flow problem.
2. Application of numerical technique to solve these problems.
The mathematical formation of the load flow problem is a system of nonlinear algebraic equation. The basic equations for the purposes of load flow studies are set of network equations, which can be established either in the loop frame of reference or in the bus frame of reference. For the purpose of load flow study we shall assume the balanced excitation and hence the formation will be based upon the positive sequence network only. These nonlinear algebraic equations can be solved by solution technique such as Gauss iterative technique, Gauss-Siedel method, Newton-Raphson method and Fast decoupled method. A large number of iterative methods using both Ybus and Zbus are available. The desirable features of an ideal load flow method are as follows. 1) High speed 2) Minimal storage 3) Simplicity and ease of programming 4) Reliability for ill conditioned system No single method satisfies all these requirements. In practice, all these features are not required simultaneously in all situations. A compromise is to be made in the choice of a particular method.
A)
Mathematical Formation Of Load Flow Problem Consider the sample network show in fig 1.it consists of three buses where bus number 1 is a slack bus, bus number 2 is a load bus having no generation and bus number 3 is generation bus having no load. The distance between the buses is represented by L1, L2 and L3 respectively.Figure 1 sample network Figure 2. The equivalent circuit of the system
The node equations can be written as
I1=V1Y1+ (V1-V2) Y4+ (V1-V3) Y6
I2=V2Y2+ (V2-V1) Y4+ (V2-V3) Y5 (1)
I3=V3Y3+ (V3-V1) Y6 + (V3-V2) Y5
Rewriting the equations as
I1= V1 (Y1+Y2+Y3)-V2Y4-V3Y6
I2= -V1Y4+V2 (Y1+Y2+Y3)-V3Y5 (2)
Volume 3, Issue 1, January 2014
Page 346
Lety11= Y1+Y4+Y6 ,y12=y21=-Y4 ,y13=y31=-Y6 , y22=Y2+Y4+Y6, y23=y32=-y5, y33=Y3+Y5+Y6
So equation 1 can be written as
I1=y11V1+y12V2+y13V3
I2=y21V1+y22V2+y23V3 (3)
I3=y31V1+y32V2+y33V3
Or in matrix form
= (4) i.e.,
I=Ybus Vbus
Where I is a bus current vector, Ybus is a bus admittance matrix and Vbus is bus voltage matrix.
It will be observed that Ybus matrix consist of diagonal ykk composed of some of all admittances incident to node k and
off diagonal elements yjk=ykj is composed of negative of admittance connected between the node j and k.
If there are n buses, the source current at the kth bus can be written as
Ik=yk1V1+yk2V2+...ykkVk+...yknVn
Vk I*k=Pk-jQk
Or Ik= ((Pk+jQk)/Vk)*
Also Ik= (Pk+jQk)/Vk*
Substituting the valve of Ik in equation 2
(Pk+jQk)/Vk*=yk1V1+yk2V2+...+ykkVk+...yknVn
Or Vk=1/ykk [(Pk+jQk)/Vk*-yk1V1-yk2V2-...-ykkVk-...-yknVn]
In general form
Vk=1/ykk(Pk+jQk)/Vk*- i!=k
It should be remembered that the equation for the slack bus should not be written because the voltage for this bus is generally specified both in magnitude and phase.
IV.NUMERICAL TECHNIQUE TO SOLVE LOAD FLOW PROBLEMS
A) Newton-Raphson Method :Newton-Raphson method is powerful method among all the load flow methods for solving nonlinear algebraic equations. It works fasters and is sure to converge in most cases compared to gauss, Gauss-Siedel and other load flow methods. It is indeed the practical method of load flow solution of large power system networks. The only drawback is the large requirement of computer memory, which can be overcome through a compact storage scheme. Performing the first iteration through the Gauss- Siedel method and using the valves so obtained for solving the Network-Raphson method can considerably speed up the convergence. Because of this quadratic convergence Newton- Rapson method is mathematically superior to any other load flow methods and is less prone to divergence with ill conditioned problems. For large power systems Newton-Raphson method is found to more efficient and practical. The number of iteration required to obtain the solution is independent of system size but more functional evaluations are required at each iteration. Since in the power flow problem real power and voltage magnitudes are specified for the voltage controlled buses. The power flow equations for Newton-Raphson method are formulated in polar form. The equations in this form are,
Pi= Qi=
Above equation constitutes a set of nonlinear algebraic equations in terms of independent variables, voltage magnitudes in per unit, and phase angle in radians. Expanding the two equations in Taylor’s series about the initial estimates and neglecting all other higher order terms resulting in following set of linear equations.
Volume 3, Issue 1, January 2014
Page 347
Figure 3.Flowchart For Newton-Raphson Method
V. FAST CONTINGENCY SCREENING BASED ON REACTIVE LOSS COMPENSATION
INDEX
Power system is made of interconnected components, each designed to play a critical role for the smooth operation of the system at all time. One of the most important problems in power systems is the control of the voltage and reactive power for improving the quality, security and economy of the operation. The invention relates to systems for analysing outage failure modes associated with electrical power distribution systems, and more specifically to analytical techniques for reducing the number of contingencies to be dynamically analysed in determining the security of such systems following a system outage.
A.)Outage Simulation and Reactive Loss Compensation: The choice of critical system factor and the process taken to evaluate it determines to a larger extent the computational efficiency of a contingency screening method. The reactive loss compensation index of our approach is derived from the voltage angle change resulted from real power flow change on a line which can be obtained using DC power flow analysis. In the power flow analysis, a simulation of line outage can be done by injecting active power at the buses where the line outage occurs. The new approach, therefore, is centred on the simulation of line outage with a non-iterative active power flow model by which the changes in bus voltage angle, , for a given set of changes in active bus injections, P, are computed to generate the compensation index. Since the evaluation of the incremental changes in bus voltage angles is an important step in the screening, we review the mathematical process leading to the evaluation.
B) Line Outage Simulation and Voltage Angle Change: Under outage at a line, the incremental changes in bus voltage angles, due to the loss of active power flow in the line, determines line outage sensitivity factor. The sensitivity factor measures the ratio of the change in voltage angle in any section of the system to that of the original power flow on the faulted line. The incremental change analysis of voltage angle is done separately for transmitted and loss parts of power
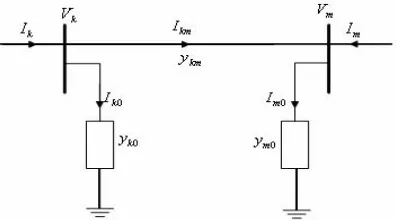
flow. In the nominal π-circuit model of Fig. 3, the transmitted and the loss parts of active power flowing on line k-m are given, respectively, as follows:
Pkm(tr)=gkm(Vk2-Vm2)-2bkmVkVm = -pkm(tr) (5)
Volume 3, Issue 1, January 2014
Page 348
Figure 4. Transmission circuit model for line flow calculationThe line outage of the circuit can be simulated by applying two incremental active power injections, ΔPkand ΔPm, at
each end of the line k-m. Upon the outage at the line k-m, these incremental injections of the transmitted and the loss
parts at each end, Δ Pk(tr), Δ Pm(tr),Δ Pk(loss)and Δ Pm(loss), must equal the original active power flow on the line k-m, to
effect zero power flow in the faulted line. For the incremental change analysis for the transmitted part of the line, the following equation satisfies the condition:
Δ Pk(tr) = Pkm(tr)+ Δ Pkm(tr) (7)
The changes in bus voltage angle influenced by the changes in bus active power injections can be obtained by the use of a DC power flow model expressed by:
[Δ θ ] = [X ][Δ P ] (8)
where, [Δ P ] is an n-by-1 vector of incremental changes of active power injection, [Δθ ] is an n-by-1 vector of incremental changes of bus voltage angles, and [X ] , written as [∂θ /∂P ] , is the inverse of the susceptance matrix [B ' ]. Using (8) we can express the changes in the voltage angle on the transmission line between bus k and bus m in terms of the active power injection at bus k: Δθ km(tr)= (Xkk− Xkm− Xmk+ Xmm) ΔPk(tr) (9)
The combination of (5), (7) and (9) results in an expression for the transmitted part of the incremental bus injection in terms of the original power flow on the faulted line k - m:
Δ P k ( tr )=Pkm(tr)/{1+a(Xkk-Xkm-Xmk+Xmm)} (10)
Where a=2bkmVkVm and bkm is the susceptence of the line k-m Then the sensitivity factor at the bus n in any
section of the system is obtained by: =Δθ n(tr)/Pkm(tr) (11)
Further, from (8), the change in the voltage angle at bus n for the transmitted part of active power injection, Δθk( tr ) , can
be written as: Δθk( tr ) =( Xnk-Xnm)Δ Pk ( tr ) (12)
Finally, by combining equations (11) and (12) along with (10), we produce the DC power flow model equation for sensitivity factor of transmitted part of outage injection:
=( Xnk-Xnm) /{1+a(Xkk-Xkm-Xmk+Xmm)} (13)
Similarly, the sensitivity factor of the loss part for the active power injection is obtained as:
=( Xnk-Xnm) /{1-b(Xkk+Xkm-Xmk+Xmm)} (14)
Where b=2gkmVkVm and gkm is the conductance of the line k-m.
Then the total change in voltage angle at bus n due to the transmitted and loss parts of the outage injections is obtained as:
Δθn.km = Δ P km( tr )+ Pk(loss) (15)
C)Evaluation Of Reactive Power Loss Compensation Index: The loss amount in a bus under outage can be interpreted as the amount of compensation to the bus to keep constant voltage magnitude at the bus. In other words, the amount of Var compensation required by the system under a line outage must be the same as the total sum of reactive losses over all the lines connected to the load buses. It's because the change in voltage magnitude at the PQ buses for a line outage is caused by changes in reactive power losses on the transmission line connecting the load buses. Used with the values obtained from equation (15), the reactive losses on the lines are obtained in terms of the active power flow. With the same nominal
π-circuit transmission line model, the reactive flows on the line k-m, measured at each end of the buses are expressed by: Qkm=Vk 2(bkm+bsh) +VkVmgkm - VkVmbkm (16)
Qmk=Vm2(bkm+bsh)-VkVmgkm -VkVmbk (17)
Then the reactive power loss in line k-m is the algebraic sum of (16) and (17): Qkm(loss)=Qkm+Qmk =(Vk2+Vm2)(bkm+bsh)-2VkVmbkm (18)
Where bsh is shunt susceptence. We can then express the derivative of the reactive power losses on line k-m, Δqkm(loss),with
respect to the change in voltage angle difference between bus k and bus m, Δ km:
Δqkm(loss)=2VkVmbkm Δ km (19)
Volume 3, Issue 1, January 2014
Page 349
voltage magnitude. The compensation amount, made by the artificial Var compensators placed at the system load buses, is called reactive loss compensation index (RLCI):RLCI = (loss) (20)
Where (loss) = (loss) is the incremental reactive losses summed up at bus i over the set of connecting lines j for an outage on line k. The main part of the new approach in the contingency screening is centered on the calculation and interpretation of RLCI for severity of the outage. The important observation of the RLCI contingency screening is that, under a power system where the PQ buses are modeled as constant voltage buses and the reactive power limits at the remaining PV buses are not violated, only the load buses are the places where the reactive losses are compensated. This means that the contingency screening can be done on the reduced network, the inherent advantage of time saving in calculation.
VI. ALGORITHM AND FLOW DIAGRAM OF CONTINGENCY SCREENING WITH
REACTIVE LOSS COMPENSATION INDEX
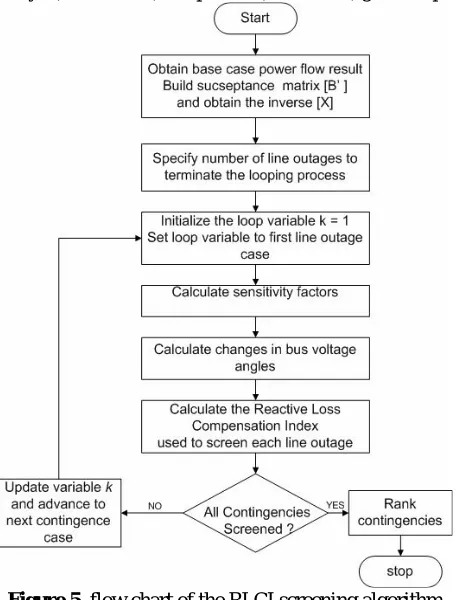
A) RLCI Contingency Screening and Ranking Process:
The RLCI contingency screening process as illustrated in Flow chart. Is composed of the following steps: Step 1: The result of base case power flow solution is obtained as input to the screening process
Step 2: Developed, from the line data of the power system, thee susceptance matrix [B’] and its inverse matrix [ X ] in the form of [∂θ/ ∂P] .
Step 3: Select an outage case, for example, line k-m, and set the initial value of the loop variable k = 1.
Step 4: Calculate the sensitivity factors due to the transmitted and loss parts of the injections at the buses k and m. Step 5: Compute the changes in bus voltage angles for the transmitted and loss parts of the injections.
Step 6: Calculate RLCI.
Step 7: Increase the loop variable k by 1(i.e. k = k+1). Stop if k =s, otherwise, go to Step 3.
Figure 5. flow chart of the RLCI screening algorithm
The RLCI value we would obtain from the screening process, in signed number, represents the amount of Var compensation to account for line reactive loss. A large RLCI of an outage indicates higher Var compensation; a smaller RLCI indicates negligible compensation. By arranging the outage cases with the corresponding RLCI values in the decreasing order, we can place the most severe outage case (largest RLCI value) at the top, and the least severe one (smallest RLCI) at the bottom of the contingency list.
Volume 3, Issue 1, January 2014
Page 350
having to run a complete 1P1Q load flow solution, and thereby to avoid the computation burden of the traditional screening method. Another time saving comes from the reduced set of load buses used for the calculation of RLCI in the proposed method; only a fraction of the entire network is used to perform contingency analysis. The use of reduced network to perform contingency analysis is a practical approach of using the power flow results for selected sub-system rather than the entire power system to evaluate the impact of contingencies.VII. RESULT OF EVALUATION
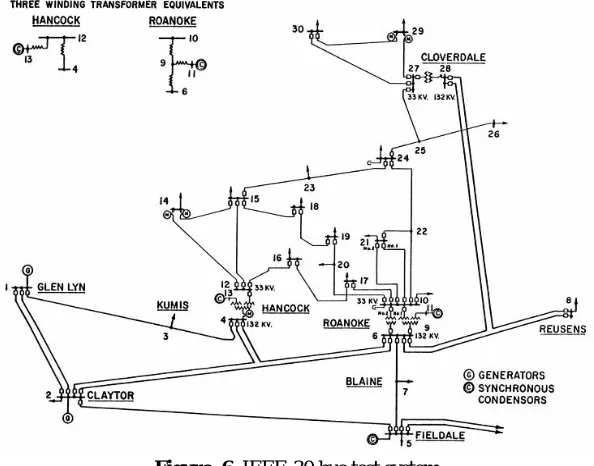
The fast method of RLCI contingency screening, coded in Mat lab programming environment, is tested on the IEEE 30- bus system (see Fig. 4) in a PC Windows XP platform. The test bus system and the data used for this study are from the American Electric Power Service Corporation network. A total of 41 line outages were simulated and, for each outage case, the RLCI was calculated to rank the contingencies in the order of severity. We also performed the screening time comparison for single line outage contingencies between the RLCI screening and the 1P1Q method.
Figure 6..IEEE-30 bus test system
Volume 3, Issue 1, January 2014
Page 351
Table-1. Ranking Compensation for Ten Most Severe Outage Cases
The ten least severe line outages are compared and summarized in Table II. Again, the RLCI method captures all 10 least ranked contingencies. The only minor discrepancies between RLCI and the Var limiting index are: lines 15-23, 22- 24, 8-28, and 5-7 are ranked 35th, 36th, 39th and 41st, respectively, by the RLCI method, while they are ranked as 36th, 35th, 40th and 39th, respectively, in the conventional method.
TABLE-II Ranking Compensation for Ten Least Severe Outage Cases
VIII.CONCLUSION
A new method of reducing time to operators of static contingency screening was discussed. Here we calculate the reactive loss compensation index using mat lab simulation. Compared with the conventional Var limiting index benchmark, the accuracy of RLCI screening was acceptable in that the new method captured all ten most severe and ten least severe contingencies of the IEEE-30 bus system. In addition, the RLCI approach reduced the computation time in every step of the screening process. Overall, the RLCI approach, with 60% faster response time and acceptable accuracy demonstrated its promise as a real time contingency screening tool.
Scope Of Further Enhancements: This fast contingency analysis method can be extended in the case of a line contingency belonging to a group of mutually coupled lines, where the modification of system bus voltage vector may be effected through simulation by the equivalent modifying bus injection subsystem simultaneously impressed at the appropriate buses on which the group of mutually coupled lines are incident.
REFERENCE
[1]. Mario A.Albuqueeque and Carlos A.Castro, “A Contingency Ranking Method for Voltage Stability in Real Time Operation of Power Systems” senior Member,IEEE
[2].R. Hooshmand and M. Joorabian “Application of Artificial Neural Networks in Controlling Voltage and Reactive Power”
Line Outage Case
Rank by Var index
VAr Index
Rank by RLCI
RLCI
9 – 10 28 – 27 2 – 6 4 - 12 3 – 4 2 – 5 4 – 6 6 – 10 6 – 9 2 – 4
1 2 3 4 5 6 7 8 9 10
0.9999 0.9989 0.9982 0.9958 0.9918 0.9908 0.9853 0.9835 0.9828 0.8938
1 2 3 5 6 10 7 8 9 4
0.1360 0.0770 0.0531 0.0259 0.0225 0.0088 0.0198 0.0164 0.0158 0.0298
Line Outage Case
Rank by VAR index
VAr Index
Rank by RLCI
RL CI
9 - 11 12 -13 10 – 22 22 - 24 15 – 23 10 – 21 25 – 26 5 – 7 8 – 28 6 – 8
32 33 34 35 36 37 38 39 40 41
0.8384 0.8373 0.8345 0.8339 0.8336 0.8333 0.8292 0.8287 0.8279 0.8277
32 33 34 36 35 37 38 41 39 40
0 0
Volume 3, Issue 1, January 2014
Page 352
[3].Nitin Malik and L. Srivastava “Knowledge-Based Neural Network for Line Flow Contingency Selection and Ranking” [4].J. Deuse, K. Karoui, , A. Bihain, J. Dubois “Comprehensive approach of power system contingency analysis” seniorMember,IEEE
[5]. H.Saadat, “power system Analysis”, 2nd ed, New York:McGraw-Hill,2002. [6].D.P.Kothari,I.J.Nagrath, “Modran Power System Analysis”, Third Edition [7].George L.Kusic,”Computer Aided Power Systems Analysis”
[8].C. Y. Lee and N. Chen, "Distribution factors of reactive power flow in transmission line and transformer outage studies," IEEE Trans. Power Syst., vol.7, pp. 194-200, Feb. 1992.
[9].T. S. Sidhu and L. Cui, "Contingency screening for steady –state analysis by using FFT and artificial neural networks," IEEE Trans. Power Syst., vol. 15, pp. 421-426, 1979
[10].S. Gosh and B. H Chowdry, "Design of an artificial neural network for fast line flow contingency ranking," Electric Power Energy Systems vol. 18, pp. 271-277, 1996
BIBLIOGRAPHY
1.Mr.Santhosh Raikar M –he received his BE degree from VTU Belgaum India in 2008 and Degree In Electrical Engineering and received M.Tech degree from kuvempu university shimoga, India in 2010 at present he is working as lecture in the Department of Electrical And Electronics Engineering,S.T.J.I.T.Ranebennur his academic experience is about 4 year his area of interest is Power system ,Power Electronics.
2.Mr.Shiddalingappa Ajjampur–he received his BE degree from VTU Belgaum India in 2011 and degree in Electrical Engineering and received M.Tech degree from VTU Belgaum , India in 2013 at present he is working as lecturer in the department of Electrical And Electronics Engineering ,S.T.J.I.T .Ranebennur his academic experience is about 1 year his area of interest is Power system ,Electrical Power Generation
3. Ms Naveen S–she received his BE degree from kuvempu university shimoga India in 2008 and degree in Electrical Engineering and received M.Tech degree from kuvempu university shimoga, India in 2010 at present he is working as Assistant engineere in K.P.T.C.L. honnalli,Karnataka ,India
APPENDIX : INPUT DATA FOR IEEE-30 BUS SYSTEM Bus data
Bus-I Type Pd MW Qd MVA r Gs MW Bs MVA r
Area Vm p.u
Va degree
baseKV kv
Volume 3, Issue 1, January 2014
Page 353
27 28 29 30 2 1 1 1 0 0 2.4 10.5 0 0 0.9 1.9 0 0 0 0 0 0 0 0 3 1 3 3 1 1 1 1 0 0 0 0 135 135 135 135 1 1 1 1 1.1 1.05 1.05 1.05 0.95 0.95 0.95 0.95 Generator data bus PgMW Qg MVAr Qmax MVAr Qmin MVAr Vg p.u mBase MVA
Status Pmax MW Pmin MW 1 2 22 27 23 13 23.54 60.97 21.59 26.91 19.2 37 0 0 0 0 0 0 150 60 62.5 48.7 40 44.7 -20 -20 -15 -15 -10 -15 1 1 1 1 1 1 100 100 100 100 100 100 1 1 1 1 1 1 80 80 50 55 30 40 0 0 0 0 0 0 Area data
Generator cost data
Branch data
fbus tbus r
p.u
x p.u
b p.u
rateA rateB rateC ratio angle St
1 1 2 3 2 2 4 5 6 6 6 6 9 9 4 12 12 12 12 14 2 3 4 4 5 6 6 7 7 8 9 10 11 10 12 13 14 15 16 15 0.02 0.05 0.06 0.01 0.05 0.06 0.01 0.05 0.03 0.01 0 0 0 0 0 0 0.12 0.07 0.09 0.22 0.06 0.19 0.17 0.04 0.02 0.18 0.04 0.12 0.08 0.04 0.21 0.56 0.21 0.11 0.26 0.14 0.26 0.13 0.2 0.2 0.03 0.02 0.02 0 0.02 0.02 0 0.01 0.01 0 0 0 0 0 0 0 0 0 0 0 130 130 65 130 130 65 90 70 130 32 65 32 65 65 65 65 32 32 32 16 130 130 65 130 130 65 90 70 130 32 65 32 65 65 65 65 32 32 32 16 130 130 65 130 130 65 90 70 130 32 65 32 65 65 65 65 32 32 32 16 0 0 0 0 0 0 0 0 0 0 0 0 0 0 0 0 0 0 0 0 0 0 0 0 0 0 0 0 0 0 0 0 0 0 0 0 0 0 0 0 1 1 1 1 1 1 1 1 1 1 1 1 1 1 1 1 1 1 1 1 Are a Data 1 2 3 8 23 26
1 start-up start down n X1 Y1 Xn