Magare. World Journal of Pharmaceutical and Life Sciences
FISH IDENTIFICATION USING SEQUENCE ANALYSIS OF THE
AMPLIFIED COI GENE
V. N. Magare*
Principal, Dept. of Zoology, Kirti M. Doongursee College of Arts, Science and Commerce,
Dadar (W), Mumbai -400028.
Article Received on 14/07/2016 Article Revised on 03/08/2016 Article Accepted on 24/08/2016
ABSTRACT
Accurate identification of the study animal is of utmost importance. In
case of the fish, the use of only morphological characteristics can lead
to an error as these tend to overlap and vary based on the life stage and
the habitat. The use of COI gene sequence for species identification is
becoming popular since last few years. An attempt was made to use
this amplified gene sequence to identify a locally collected freshwater
fish from Maharashtra.
KEYWORDS: Fish, COI, freshwater, DNA barcoding, BLAST, phylogeny.
INTRODUCTION
DNA barcoding refers to the technique of sequencing a short fragment of the mitochondrial
cytochrome c oxidase subunit I (COI) gene, the "DNA barcode," from a taxonomically
unknown specimen and performing comparisons with a reference library of barcodes of
known species origin to establish a species-level identification.[1] Mitochondrial COI gene
sequence is considered suitable for animal identification because its mutation rate is often fast
enough to distinguish closely related species.
A perusal of literature indicates that sequence analysis of COI gene has been successfully
used for the identification of a number of animal species such as insects[2,3,4], birds[5],
shellfish[6] and fish.[7,8,9] However, there is dearth of information available on its use for
identifying the local fish fauna of Maharashtra state. Therefore, the present investigation was
carried out.
World Journal of Pharmaceutical and Life Sciences
WJPLS
www.wjpls.org
SJIF Impact Factor: 3.347*Corresponding Author Dr. V. N. Magare Principal, Dept. of
Zoology, Kirti M.
Doongursee College of
Arts, Science and
Commerce, Dadar (W),
MATERIALS AND METHODS Sample collection
A commonly available, local fish was collected from the Krishna river near Satara,
Maharashtra. After collection, it was identified as a fish belonging to the family of Glass-fish
based on its morphological characteristics. The collected fish samples (total ten) were
immediately put in separate sterile containers having 70% ethanol for preservation. After that,
the samples were brought to the laboratory in Mumbai for further analysis following the
methodology by Gomes et al., (1999).[10]
Extraction of DNA
DNA Extraction was carried out using Genelute Mammalian Genomic DNA extraction kit
(Sigma, G1N70-1KT). 25mg of tissue was minced and transferred to 1.5ml microcentrifuge
tube. 180 µl of Lysis solution T and 20 µl of proteinase K were added. The samples were
mixed and incubated at 550C to digest the tissue completely. 20 µl of RNase A solution was
added and incubated at room temperature for 2min. Then 200µl of lysis solution C was added
and incubated at 700C for 10 min. The column was prepared for binding by adding 500 µl of
Column preparation solution to each pre-assembled GenElute Miniprep Binding Column and
centrifuge at 12,000 rpm for 1 min. 200µl of ethanol was added to the lysate and mixed by
vortexing. The entire lysate was transferred into the treated binding column and centrifuge at
10,000 rpm for 1 min. The binding column was then placed in fresh 2 ml collection tube. 500
µl of Wash solution was added to the binding column and centrifuge at 10,000 rpm for 3min.
This step was repeated twice. The column was again transferred to a new tube. 200 µl of
elution buffer was added directly into the centre of the binding column and centrifuge at
10,000 rpm for 1min. The concentration of DNA was determined using UV-1800
spectrophotometer (Schimadzu Corporation A11454806498). The DNA was stored at -200C
for further use.
Gene amplification by using PCR
The DNA isolated from Fish were taken further for PCR amplification by using Biometra
thermal cycler (T-Personal 48). The PCR reaction mix contained 2.5μl of 10X buffer, 1μl of
each primer, 2.5μl of 2.5mM of each dNTP, 2.5 Units of Taq DNA polymerase and 1μl Template DNA and 8.5μl nuclease free water. The PCR amplification cycle consisted of a
for COI gene amplification were used as suggested by Lakra et al., 2011 shown in the table
1.[11]
Table 1: Primers used for COI gene amplification of fish samples.
Primers Primer Sequence (5’-3’)
Fish F1 (Forward) TCAACCAACCACAAAGACATTGGCAC
Fish R1 (Reverse) TAGACTTCTGGGTGGCCAAAGAATCA
Gel electrophoresis
Gel electrophoresis was performed using 1.0% agarose (Seakem, 50004L) to analyze the size
of amplified PCR product. The size obtained was approximately 500 bp for COI region.
DNA sequencing
The PCR product was purified using AxyPrep PCR Clean up kit (Axygen, AP-PCR-50). 100
µl of PCR-A buffer was added to the 25 µl of reaction. The sample was mixed and
transferred to column placed in 2 ml collection tube and centrifuge at 10,000 rpm for 1 min.
the filtrate was discarded.700 µl of W2 buffer was added to the column and centrifuged at
10,000 rpm for 2 min.
This step was repeated twice. The column was transferred to a new tube. 25 µl of Eluent was
added into the column and incubated at room temperature for 2 min. Then centrifuge at
10,000 rpm for 5 min. It was further sequenced using Applied Biosystems 3730xl DNA
Analyzer USA and chromatogram was obtained. For sequencing of PCR product Fish F1- 5’
(TCAACCAACCACAAAGACATTGGCAC 3’) sequencing primer was used.
BLAST analysis
The DNA sequences were analyzed using online BLASTn (nucleotide Basic Local
Alignment Search Tool) facility of National Center for Biotechnology Information (NCBI).
The BLAST results were tabulated.
RESULTS
COI gene sequence of fish from Krishna River
Genomic DNA extracted from the fish collected from the Krishna River, Satara when
targeted to amplify its COI region by PCR produced a sequence of 466 bp as shown in the
Figure 1: COI gene sequence for the unknown fish.
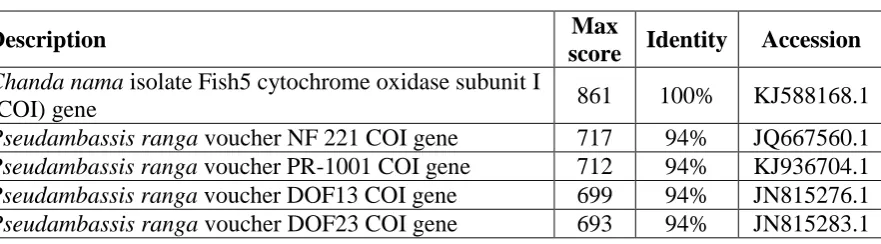
Results for BLAST Analysis
The amplified COI gene sequence of the fish sample collected from the Krishna River was
compared with the existing sequences in the nucleotide database library and by this analysis,
it was identified as Chanda nama as it showed 100% sequence similarity with the already
deposited COI gene sequences of the isolate of Chanda nama (Table 2). Other phylogenetic
neighbour of the study sample was found to be Pseudambassis ranga which showed 94%
sequence similarity.
Table 2: Phylogenetic neighbours of the unknown fish sample by BLAST analysis.
Description Max
score Identity Accession
Chanda nama isolate Fish5 cytochrome oxidase subunit I
(COI) gene 861 100% KJ588168.1
Pseudambassis ranga voucher NF 221 COI gene 717 94% JQ667560.1
Pseudambassis ranga voucher PR-1001 COI gene 712 94% KJ936704.1
Pseudambassis ranga voucher DOF13 COI gene 699 94% JN815276.1
Pseudambassis ranga voucher DOF23 COI gene 693 94% JN815283.1
DISCUSSION
So using the amplified COI gene sequences, the unknown fish sample collected from the
Krishna River was identified as Chanda nama. It is better known as Elongate Glass Perchlet.
It is a fish endemic to Indian subcontinent and has been reported from Indus, Ganges,
Mahanadi, Krishna and other river basins in India. It is classified into Kingdom: Animalia;
based on the morphological characteristics, even though family was identified, the actual
identification was made easier with the aid of gene sequence of COI.
Chanda nama is a low priced fish and is available in plenty in rainy season so it preferred as
a good source of protein rich food by many. It is important to mention that this species has
been suggested for its effective use in the control of guinea worms and also for malarial
control.[12]
BLAST analysis indicated that the closest phylogenetic neighbour of the Chanda nama was
Pseudambassis ranga based on the sequence similarity. Pseudambassis ranga also belongs to
the family of Glass-fish and is better known as Indian Glass perch and is morphologically
quite similar to Chanda nama. However, COI gene sequences successfully showed the
sequence diversity between the collected sample and the existing sequence of Pseudambassis
ranga indicting though they both belong to the same Family of Ambassidae, COI gene
sequences can actually help in delineating them.
More studies are ongoing to use COI gene sequences to characterise and identify more local
fish from the state of Maharashtra.
CONCLUSION
We can therefore conclude that amplified COI gene sequence can be used for barcoding
animals such as fishes to study and identify them in a quicker, accurate and cost effective
way.
REFERENCES
1. Wilson JJ. Methods Mol Biol, 2012; 858: 17-46.
2. Virgilio M, Backeljau T, Nevado B, De Meyer M. BMC Bioinformatics, 2010; 11, 206.
3. Pentinsaari M, Hebert PDN, Mutanen M. PLoS ONE, 2014; 9: e108651.
4. Stork NE, McBroom J, Gely C, Hamilton AJ. Proc. Natl Acad. Sci. USA, 2015; 112:
7519-7523.
5. Hebert PDN, Stoeckle MY, Zemlak TS, Francis CM. J. PLoS Biol, 2004; 2(10): e312.
6. Kim D-W, Yoo WG, Park HC, Hye SY, Kang DW, Jin SD, Min HK., Paek WK, Lim J.
Genomics and Informatics, 2012; 10 (3): 206-211.
8. Mabragana E, de Astarloa JMD, Hanner R, Zhang J, Gonzalez Castro M. PLoS ONE,
2011; 6(12): e28655.
9. Zhang J, Hanner R. PLoS ONE, 2012; 7(2): e30621.
10.Gomes C, Oxenford HA, Dales RGB. Bulletin of Marine Science, 1999; 64(3): 485- 500.
11.Lakra WS, Verma MS, Goswami M, Lal KK, Mohindra V, Punia P, Gopalakrishnan A,
Singh KV, Ward RD, Hebert P. Molecular Ecology Resources, 2011; 11, 60-71.
12.Chandra G, Bhattacharjee I, Chatterjee SN, Ghosh A. Indian Journal of Medical