Available at www.ijsred.com
Modeling and Simulation of Overcurrent and Earth Fault Relay
for Extra High Voltage Transmission Line
Han Su Yin*, ShweZanAung**
*(Department of Electrical Power Engineering, Yangon Technological University/ Yangon, Myanmar) ** (Project & System Design, Omega Integration Pte. Ltd)
---
************************
---Abstract:
The Electrical Power System consists of many vital components. Among them, the Transmission lines are one of the most important parts of the system. Faults occur in transmission lines have high impact on the electrical power system. The major fault in transmission line is single line to ground (L-G) fault, but, various types of faults also occur in transmission line, such as unsymmetrical faults which includes single line to ground (L-G) fault, double line to ground (L-L-G) fault and line to line (L-L) fault and symmetrical faults which are three phase fault. So, the protection relays are needed to protect transmission lines from various types of faults. Overcurrent and earth fault relay is normally used to protect transmission lines, distribution lines, transformers and bus coupler etc. Moreover, these relays can be used as main or backup protection. The modeling of protection relays is required to determine the effects of network parameters and configurations on the operation of these relays. This paper presents the modeling and simulation of standard inverse definite minimum time (IDMT) relay using MATLAB/SIMULINK software. The study of test system is Paunglaung – Pyinmana High Voltage transmission line. The proposed model was tested for single line to ground (L-G) fault and three phase fault witha fault resistance (0.001 Ω)at various locations. The simulation results obtained by MATLAB software show the feasibility analysis of High Voltage Transmission Line with Overcurrent and Earth Fault relay.
Keywords —High Voltage Transmission line, Overcurrent and earth fault relay, MATLAB, Single line to ground (L-G) fault, Three Phasefault.
---
************************
---I. INTRODUCTION
The electrical power system consists of many components such as generators, transformers, transmission lines and distributions lines, etc. Transmission lines are a vital part of electrical power system because they transmit energy from generation to load. When various faults occur in electrical power system, they cause significant changes in system like overcurrent, over or under voltage, power factor, impedance, frequency and power or current direction [1]. In EHV transmission lines, there are various type of faults occur in power system such as unbalanced faults: single line to ground (L-G) fault, double line to ground (L-L-G)
fault, line to line (L-L) fault and balanced faults: three phase fault. [2]
Transmission line protection is an important role in electrical power system because most of faults are occurring in transmission line. Transmission protection systems are designed to identify the location of faults and isolate the faulted section. An automatic protective relay is needed to isolate the faulty element as quickly as possible and keep the healthy section of the system to normal operation.[3]One of the protection relays used to protect the power system is overcurrent and earth fault relay.
These relays will detect and isolate the faulty section and it can be used main or backup
www.ijsred.com
protection relay.[4] In overcurrent and earth fault relay, there are two types of operating time speed which are instantaneous time and delay time.[5]The weakness of instantaneous type is that it can’t discriminate the operation when the fault current at two or more locations is the same.[6] In delay time type, there are definite time and inverse time. For definite time overcurrent and earth fault relay, the operating time is independent of current. For inverse time overcurrent and earth fault relay, if the fault current is high, the operating time will be fast. The fault current is measured in multiples of current setting or pickup current setting.[5]
In this paper, the test system is Paunglaung – Pyinmana, 230kV High Voltage Transmission Line. Using high voltage in transmission lines reduce line losses, voltage drop and size and volume of conductor for transmitting the same amount of power. This transmission line is modelled and simulated by using MATALB/SIMULINK Software. MATLAB/SIMULINK software is used to model Standard Inverse Definite Minimum Time (IDMT) overcurrent and earth fault relay which aredigital signal processor (DSP) based relay. The performance of relay is investigated at normal condition in electrical power system. Then, the transmission line model was tested with single line to ground (L-G) fault and three phase fault with various fault location and fault resistance (0.001 Ω) by using the model of Standard Inverse Definite Minimum Time (IDMT) overcurrent and earth fault relay.
II.THEORIESOFSTANDARDIDMTRELAY
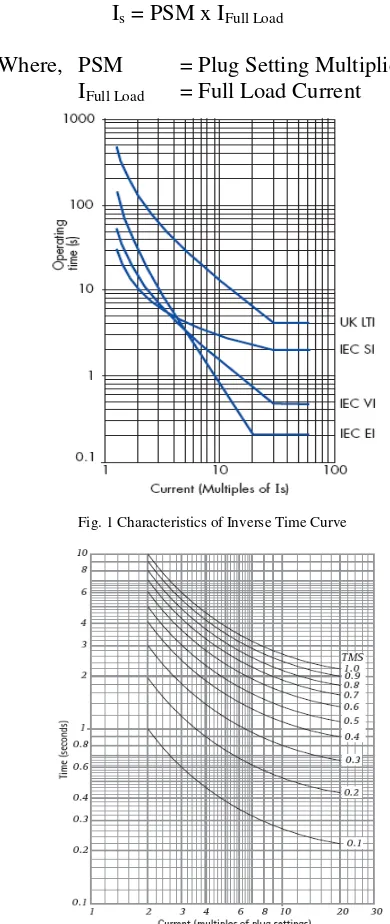
Fig. 1 shows the characteristic curves of inverse time for overcurrent and earth fault relay. It shows four curves which each curve can be expressed by equations to calculate the operating time of overcurrent and earth fault relay. Fig. 2 shows the tripping characteristics for different time multiplier setting using standard inverse definite minimum time.
The current setting for each curve is the following equation (1).
Is = PSM x IFull Load (1)
Where, PSM = Plug Setting Multiplier
IFull Load = Full Load Current
Fig. 1 Characteristics of Inverse Time Curve
www.ijsred.com
TABLE1 OPERATION TIME EQUATION
Type of curve Equation of operation time (s)
UK Long time inverse
t = TMS× 120
I IS -1
IEC Standard inverse
t = TMS× 0.14
II . − 1
IEC Very inverse t = TMS×
13.5 I IS -1 IEC Extremely inverse
t = TMS× 80
II − 1
Where,
t = Operating Time (s)
TMS = Time Multiplier Setting I = Fault Current (A)
Is = Current Setting or Pickup Current (A)
Table 1 shows the equations of operation time which represent the characteristics curves of long time inverse, standard inverse, very inverse and extremely inverse of overcurrent and earth fault relay. For the same setting, long time inverse curve has the longest time to operate the relay and extremely inverse curve has the fastest time to operate the relay.
III. MODELINGANDSIMULATION
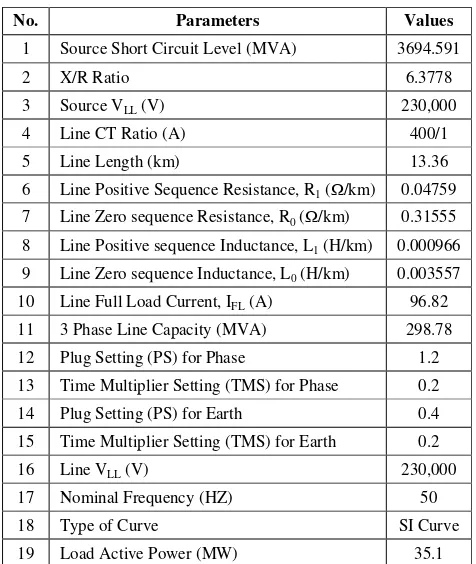
Table 2 shows overall parameters for power system network and Standard Inverse Definite Minimum Time overcurrent and earth fault relay. The current transformer (CT) ratio is chosen as 400/1 because the full load current is 96.82 A. The length of HV transmission is 13.36 km. The capacitance of transmission line is neglected. The plug setting for phase and earth are different where plug setting for phase fault set higher than full load current while plug setting for earth fault set lower than full load current to detect high impedance fault and ground fault which remain undetected by phase overcurrent relay.
The Time Multiplier Settings for phase and earth faults are set the same value. In proposed model, Standard inverse curve used to detect phase and earth fault. However, the model can be extended to other types such as Long Time Inverse, Very Inverse and Extremely Inverse.
TABLE2
SYSTEM AND RELAY PARAMETERS
No. Parameters Values
1 Source Short Circuit Level (MVA) 3694.591
2 X/R Ratio 6.3778
3 Source VLL (V) 230,000
4 Line CT Ratio (A) 400/1
5 Line Length (km) 13.36
6 Line Positive Sequence Resistance, R1 (Ω/km) 0.04759
7 Line Zero sequence Resistance, R0 (Ω/km) 0.31555
8 Line Positive sequence Inductance, L1 (H/km) 0.000966
9 Line Zero sequence Inductance, L0 (H/km) 0.003557
10 Line Full Load Current, IFL (A) 96.82
11 3 Phase Line Capacity (MVA) 298.78
12 Plug Setting (PS) for Phase 1.2
13 Time Multiplier Setting (TMS) for Phase 0.2
14 Plug Setting (PS) for Earth 0.4
15 Time Multiplier Setting (TMS) for Earth 0.2
16 Line VLL (V) 230,000
17 Nominal Frequency (HZ) 50
18 Type of Curve SI Curve
19 Load Active Power (MW) 35.1
www.ijsred.com
Fig. 3 Overall Diagram of Simulink Model
Fig. 4 Overcurrent and Earth Fault Relay subsystem
Fig.5 Block Parameters for Phase and Earth System
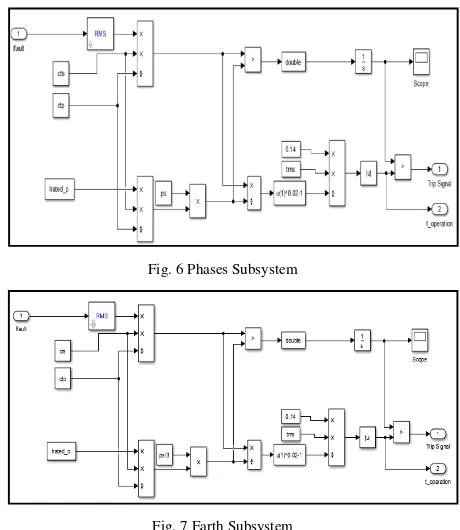
Fig. 6 Phases Subsystem
Fig. 7 Earth Subsystem
www.ijsred.com
shows block inside phase subsystem and Fig. 7 shows block inside earth subsystem.
All blocks represent the equation for standard inverse definite minimum time (IDMT) curve. The tripping time will be started when the fault current is higher than pickup current setting. When the tripping time more than calculated operating time, the trip signal will be sent to the circuit breaker.
IV. SIMULATIONRESULTS
This section discusses the results from the simulation. From the model, all faults were initiated at 0.1 s. Two types of faults which are single line to ground (L-G) fault and three phase faults were taken to be studied. Faults were simulated at different locations (3.36 km, 7 km and 10 km) and fault resistance is 0.001 Ω. The results are the operation times (top) for three phase and earth detectors. The fault currents for three phase and earth are higher than the pickup current for three phase and earth faults. From the relay setting parameters Ip for each phase and earth were
calculated as follows:
I. Phase, Ip = 1.2 x 96.82 = 116.184
II. Earth, Ip = 0.4 x 96.82 = 38.728
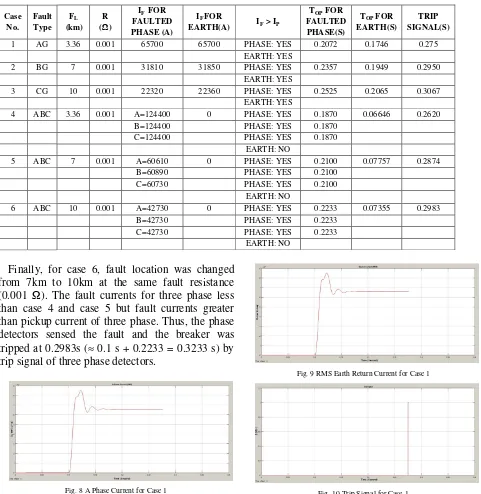
Table III shows the results of fault current, operation time and trip signals for faults at different locations (3.36 km, 7 km and 10 km) and fault resistance (0.001 Ω). Cases 1 to 3 are single line to ground (SLG) faults at different locations and Cases 4 to 6 are three phase faults at different locations.
For case 1, the results can be seen that ‘A’ phase and earth detected the fault at location (3.36 km) and fault currents exceeded the pickup currents. Phase fault current and earth fault current are the same (657000A), and consequently, secondary fault currents for phase and earth are also the same (65700/400=164.25A). However, operation time was faster for earth detector compared with phase detector because the multiple of pickup for earth fault current (164.25/38.728) higher than the multiples of pickup for phase (164.25/116.184). Therefore, the breaker was isolated and tripped at 0.275s (≈ 0.1 + 0.1746 = 0.2746 s). Fig. 8 and Fig. 9 show ‘A’ phase (RMS) current and earth (RMS)
current for case 1. Fig. 10 shows trip signal which was sent to trip the breaker after the operation time 0.275 s had been elapsed.
For case 2, the fault currents both B phase and earth detectors were smaller compared with case 1 because the fault location for case 2 (7 km) was greater than case 1 (3.36 km) while fault resistance value (0.001 Ω) was the same but the impedance between the fault and generation point for case 2 was higher than case1. However, B phase and earth fault currents are still greater than each pickup current and the breaker was tripped at 0.2950s (≈0.1 + 0.1949 = 0.2949 s) by the trip signal of earth fault detector.
For case 3, the C phase and earth fault currents were smaller than case 1 and case 2 because the fault location for case 3 (10 km) was greater than case 1 (3.36 km) and case 2 (7 km) at the same fault resistance (0.001 Ω). Therefore, the impedance between fault and generation point for case 3 was greater than the impedance for case 1 and case 2. However, both fault currents were greater than the pickup currents for A phase and earth fault and the breaker were tripped at 0.3070s (≈ 0.1 + 0.2065 = 0.3065 s).
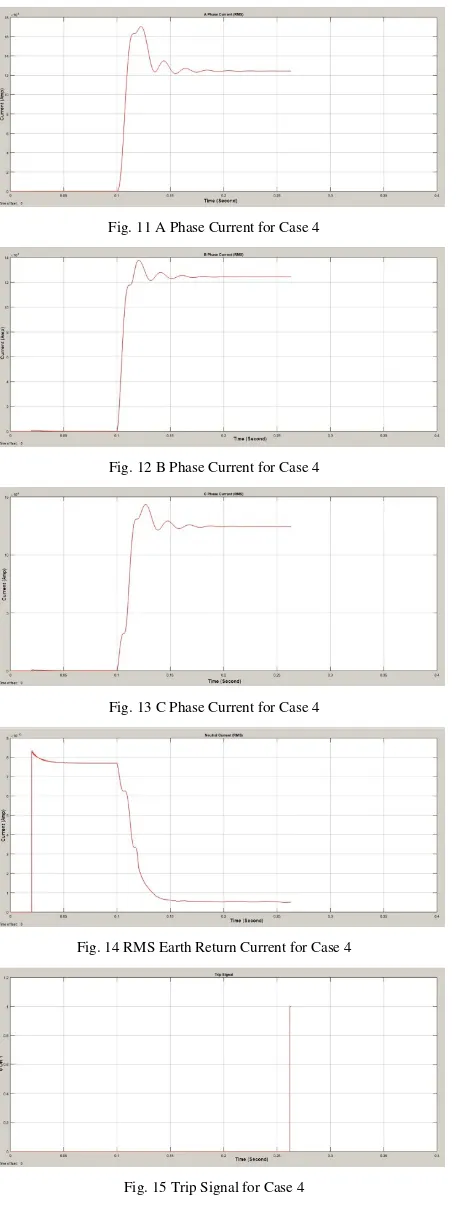
For case 4, a fault occurs between ‘A’phase, ‘B’ phase and ‘C’ phase of the HV transmission line. From the results, fault currents at each phase are the same, but, the earth fault current is almost zero (5 x 10-11A). So, the earth fault current is lower than the pickup current. Therefore, the breaker was not tripped by trip signal of earth fault. However, the breaker was tripped at 0.262s (≈ 0.1 s + 0.187 s = 0.287 s) by trip signal of three phase fault detectors. Fig. 11, Fig. 12, Fig. 13 and Fig. 14 show ‘A’ phase, ‘B’ phase, ‘C’ phase and earth return current for case 4 respectively while Fig. 15 shows the trip signal for three phase.
www.ijsred.com
TABLE3 SIMULATION RESULTS
Case No.
Fault Type
FL
(km) R (Ω)
IF FOR
FAULTED PHASE (A)
IF FOR
EARTH(A) IF > IP
TOP FOR
FAULTED PHASE(S)
TOP FOR
EARTH(S)
TRIP SIGNAL(S)
1 AG 3.36 0.001 65700 65700 PHASE: YES 0.2072 0.1746 0.275
EARTH: YES
2 BG 7 0.001 31810 31850 PHASE: YES 0.2357 0.1949 0.2950
EARTH: YES
3 CG 10 0.001 22320 22360 PHASE: YES 0.2525 0.2065 0.3067
EARTH: YES
4 ABC 3.36 0.001 A=124400 0 PHASE: YES 0.1870 0.06646 0.2620
B=124400 PHASE: YES 0.1870
C=124400 PHASE: YES 0.1870
EARTH: NO
5 ABC 7 0.001 A=60610 0 PHASE: YES 0.2100 0.07757 0.2874
B=60890 PHASE: YES 0.2100
C=60730 PHASE: YES 0.2100
EARTH: NO
6 ABC 10 0.001 A=42730 0 PHASE: YES 0.2233 0.07355 0.2983
B=42730 PHASE: YES 0.2233
C=42730 PHASE: YES 0.2233
EARTH: NO
Finally, for case 6, fault location was changed from 7km to 10km at the same fault resistance (0.001 Ω). The fault currents for three phase less than case 4 and case 5 but fault currents greater than pickup current of three phase. Thus, the phase detectors sensed the fault and the breaker was tripped at 0.2983s (≈ 0.1 s + 0.2233 = 0.3233 s) by trip signal of three phase detectors.
Fig. 8 A Phase Current for Case 1
Fig. 9 RMS Earth Return Current for Case 1
www.ijsred.com
Fig. 11 A Phase Current for Case 4
Fig. 12 B Phase Current for Case 4
Fig. 13 C Phase Current for Case 4
Fig. 14 RMS Earth Return Current for Case 4
Fig. 15 Trip Signal for Case 4
V.CONCLUSION
The standard IDMT overcurrent and earth fault relay was successfully modeled and simulated by using MATLAB/Simulink software.The model in this paper can be extended to other types of curve such as long time inverse, very inverse and extremely inverse. In future, distance relay and differential relay will be modeled and simulated in HV transmission line. As the faults are cleared by protective device more quickly, the transmission capacity of a power system can be maintain more sufficiently.
ACKNOWLEDGMENT
I would like to express my sincere appreciation to the Paunglaung and Pyinmana Substations for their supports on data collecting. I also would like to acknowledge special thanks to all of my teachers, my seniors and colleagues from Department of Electrical Power Engineering for their help, support and encouragement towards this paper.
REFERENCES
[1] HimanMahajan, Ashish Sharma: Various Techniques used for Protection of Transmission line A Review, International Journal of Innovations in Engineering and Technology, Vol. 3 Issue 4 April 2014. [2] Blackburn, J. Lewis; Domin Thomas J. Protective Relaying, Principles
and applications, 4th
Edition, 2014
[3] Usman I. Abubakar: A Design of Protection Achemes for AC Transmission Lines Considering A Case Study, 2nd International Conference on Science Technology and Management, University of Delhi (DU), Conference Center, Delhi (India), 27 September 2015. [4] P. R. Subcommittee: Protective Relaying Philosophy and Design
Guidelines PJM Relay Subcommittee, 2013.
[5] Fecime, Chapter 9: Overcurrent Protection for Phase and Earth Faults, Network Protection and Automation Guide, pp. 123-151, 2008. [6] Z. Wang, J. Li, W. Yang, and Z. Shi: Impact of Distributed Generation