http://www.sciencepublishinggroup.com/j/ijefm doi: 10.11648/j.ijefm.20180606.16
ISSN: 2326-9553 (Print); ISSN: 2326-9561 (Online)
Determining Whether the Chinese Services Industry Is
Stagnant: An Empirical Test of Baumol’s Model
Zheng Dequan
1, *, Wang Enyan
21
Department of Public Administration, Harbin Institute of Technology, Harbin, China
2
Department of Information Management and System, Harbin Institute of Technology (Weihai), Weihai, China
Email address:
*
Corresponding author
To cite this article:
Zheng Dequan, Wang Enyan. Determining Whether the Chinese Services Industry Is Stagnant: An Empirical Test of Baumol’s Model.
International Journal of Economics, Finance and Management Sciences. Vol. 6, No. 6, 2018, pp. 283-289. doi: 10.11648/j.ijefm.20180606.16
Received: November 5, 2018; Accepted: December 5, 2018; Published: December 11, 2018
Abstract:
The effects of increasing employment share of services on the real GDP growth have been investigated by a series of theoretical and empirical analysis for developed countries. In contrast, there are few empirical test studies of such effects on macro economies for developing countries. Baumol predicts that the increasing employment share of services will lower real GDP growth and thus productivity growth in services. Based on the extended Baumol’s model of two-sector unbalanced growth, this study provides an empirical analysis of the causes of employment shift and the impact of rising share of services on the productivity growth in China. Though the GDP share and the employment share of services has been increasing secularly for decades in China, the growth rate of labor productivity in services is slightly higher than that in manufacturing. The results have not confirmed the Baumol’ hypothesis because of the low labor productivity in manufacturing and large number of rural labor. The external shocks of demand for services show weak effect on the employment growth in services and are not significant. Furtherly, the regression analysis shows that there is the potential possibility of "cost disease" in China. This study empirically tests the impact of the rising services on the overall economy and can help to develop appropriate industrial policies for developing countries.Keywords:
Service Economy, Baumol’s Model, Productivity Growth, Cost Disease1. Introduction
With the acceleration of tertiarization in the world economy, more and more attention is being paid to the impact of the rising services on the overall economy as well as the productivity. William Baumol and his collaborators analyzed the impact of rising share of services in employment and GDP on other sectors’ productivity growth [1-3]. In his pioneering works, Baumol states that the productivity growth in services sector is lower than that in manufacturing sector. Since the wages both in the ‘progressive’ and the ‘stagnant’ sector grow at the same rate, the unit labour cost in services sector raises faster than that in the manufacturing sector. Assuming the constant real output of the two sectors and the less price elasticity of demand for services, Baumol’s model of ‘unbalanced growth’ indicates a larger shift of the labour force from manufacturing sector to
the tertiary sector and cause the "cost disease" [2, 4, 5]. As the conclusion, Baumol and his collaborators makes an important prediction: with the shifts toward services in employment share, the per capita real GDP growth rate will decline [2, 6, 7].
computers everywhere except in the productivity statistics. This paradox reflects the status quo of the productivity growth in manufacturing sector to some extent [15]. Triplett and Bosworth (2003) expand Baumol’s theory and his study finds that many growth rates of services productivity are very low, even negative [10]. Sasaki (2007) indicates that if services are used as both final demand and intermediate inputs, the employment shift will decrease the per capita real GDP growth in long run [16]. But there are also some theoretical criticisms on Baumol’s hypothesis from some economist, especially from statisticians. As a representative critic, Griliehes (1992) argues that there are some statistical errors in the output calculation of the service industry and productivity because of the service’s "inscrutability” [17]. And as a result, the current statistical methods have greatly underestimated the output and the productivity growth in services sector. Incorporating human capital into Baumol’s model, Pugno (2006) considers that the consumption of services increases the labour productivity both in services and manufacturing, and the employment shift to services increases does not decreases the per capita real GDP growth [18]. De Vincenti (2007) reaches a similar conclusion that the rising rate of productivity as a result of the consumption of services increases the real GDP growth [19]. At the end of the day, it is still difficult to determine the net result for Baumol’s hypothesis [20].
As compared to the rich literature on the empirical studies in developed countries, there are few empirical test studies of the theory for developing countries in macro economies. Since the reform and opening up, the sector’s composition of GDP and employment share has changed dramatically in China [21]. Figure 1 shows the changing GDP shares by sectors since 1981. Agriculture, which generated about 32
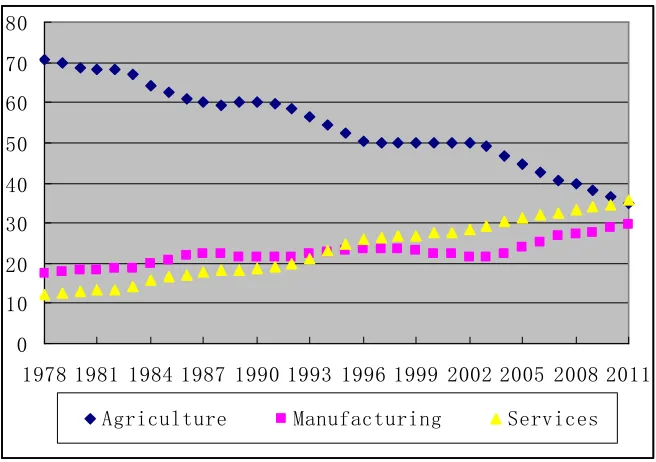
percent of GDP in 1981, accounts for 8 percent of GDP by 2016. By contrast, the GDP share of services has been increasing continually, and it accounts for 52 percent of total GDP in 2016. At the same time, the share of agriculture in employment declined secularly from the peak 70.5% in 1978 to 35.8% by 2011 (shown in Figure 2). As a contrast, the share of services in employment rose from 12% to 38.7% meanwhile.
Figure 1. Output shares of GDP by sectors in China.
Despite the rapid development of services in China, little attention has been paid to its empirical analysis. China's economic growth has become more stable and been driven by more diver factors. Furthermore, there are concerns that China's economic growth may further decline and be unable to overcome difficulties. In fact, risks do exist, but they are not that formidable. This study attempts to investigate the impact of rising share of services on the total productivity growth and the employment shift in the case of China.
Figure 2. Employment shares by sectors in China.
The next of the paper is organized as follows. Section II provides the econometric approach based on the Baumol’s
model of ‘unbalanced growth’. Section Ⅲ presents the empirical results and the interpretations. Based on the 0
10 20 30 40 50 60 70 80
1978 1981 1984 1987 1990 1993 1996 1999 2002 2005 2008 2011
empirical analysis, Section Ⅳ offers the concluding remarks.
2. Econometric Approach
In the empirical literatures, the Baumol’s model of two-sector unbalanced growth is used to account for the impact of rising share of services in productivity growth and employment at the macroeconomic level. Compared the productivity growths, Baumol sets the labor productivity growth of stagnant sector as zero. While that productivity growth of the progressive sector is set as a positive value. He also assumes that labor is the only factor inputs. The labors in different sectors get the same income, and the nominal wage and average labor productivity increase at the same speed [22]. So the Baumol’s production function is presented as follows:
Yst =aLst, Ypt =bLptert (1)
Here:
Yst = he output of the stagnant sector in term t, Lst= the labor input of the stagnant sector in term t, Ypt = the output of the progressive sector in term t, Lpt= the labor input of the progressive sector in term t,
rt= the labor productivity growth rate of progressive sector. Both a and b are the technical parameters respectively. According to the assumption, rt > 0, and the wage Wt = Wert. In his model, Baumol explains the unbalanced growth and the cost disease theoretically as follows. Firstly, the model assumes that the productivity growth of “stagnant sector” (services) is lower than that of "progressive sector" (manufacturing). Secondly, the ratio of services output to that of manufacturing output is constant. Then, the demand for services will increase because of the constant consumption ratio and the low price elasticity. Finally, Baumol and his collaborator indicates that a larger shift of employment from manufacturing toward services is inevitable, and the decline of real GDP growth is also inevitable [2, 7].
This study extends the Baumol model in order to make empirical analysis the case of China. Such extension includes the followings: Firstly, Baumol assumes the labor productivity growth of stagnant sector as zero (i.e. rs = 0) in the model. Nevertheless, Inman points out that such assumption is unrealistic. From a conceptual standpoint, the labor productivity growth of stagnant sector is merely lagging behind the progressive sector. That may also mean rs < 0, or rs > 0. So, it is necessary to compare the labor productivity growth between stagnant sector and progressive sector quantitatively, and not to assume that labor productivity growth of stagnant sector is zero in advance. Secondly, Baumol model implies the assumption——constant employment weight among the sectors. From an empirical standpoint, this assumption is not only unrealistic, but also leads to the Baumol model inconsistent. Our expansion model solves the problem. Thirdly, it doesn’t indicate specially whether the agriculture is stagnant or progressive in Baumol model. While in empirical analysis, Baumol classifies the agriculture as progressive sector. Obviously, this classification is based on the reality of
agricultural development in the United States of America. It is not comparable between the China's agricultural production and the United States’, especially in labor productivity. So, in the econometric model and empirical analysis of this paper, this study doesn't include the agriculture sector, and just compare the manufactured sectors with the whole service industry and other sectors.
Considering two sectors——manufacturing sector (m) and services sector (s), their production function are defined as respectively:
Ymt =aLmtermt, Yst =bLsterst (2)
Here:
Ymt = the output of manufacturing sector in term t, Yst = the output of services sector in term t,
Lmt= the labor input of manufacturing sector in term t, Lst= the labor input of services sector in term t,
rm= the labor productivity growth of manufacturing sector, rs= the labor productivity growth of services sector. Both a and b are the technical parameters respectively. Lt is
the total labor force of the two sectors: Lt=Lmt+Lst. The
employment share of service sector is indicated as: Rst=Lst/Lt.
Setting the employment share growth of service as fst, we then
get the equation fst=∆Rst/Rst.
The demand for two kinds of output is constrained by each of the labor wage (w), and then the demand for services depends on the relative price of service products and each labor income (Wt = We
rt
), as well as exogenous shocks (△ as the variation rate along with the time). That is:
= (3)
where α, β respectively present the price elasticity and income elasticity of demand for services.
Equation 2 and Equation 3 take the logarithmic form:
ln = + +
ln = + +
ln − = + # $ + % + Δ (4)
According to Equation 4, we get
ln − = + # $ + % − + Δ (5).
The manufactured goods are set as denominated product (i.e. Pm = 1); the wage is determined by the equilibrium of supply and demand in a competitive labor market; the demand for labor from the profit-maximizing enterprises is based on the marginal product value of unit labor equal to the wage. The condition is written as follows:
= '(
' ( =
) = ) (6)
The result of competitive market is the price equal to marginal cost. So the relative price between two sectors is:
*
*(=
+
Inserting Equation 6 and Equation 7 into Equation 5, we get: ln0 = 1( − )# + % − + Δ20 . So
3 = ( − )# + % − + Δ = (# + %)( − ) + (% − 1) + Δ (8)
Equation 8 is the basic econometric model of empirical analysis. The model shows that there are internal correlations among the share growth of services employment, labor productivity growth of services, the elasticity of demand for services and labor productivity growth of manufacturing in Baumol hypothesis. Only when the services output growth larger proportionately than the total growth ((α-1) rs>0, the employment share of services will be rising; Instead, the employment share will decrease. Therefore, this part which mentioned above can be used to test the Baumol hypothesis on employment shift. The first part of the equation right-hand
5(# + %)( − )6 indicates the effect of growth hysteresis of services productivity, which can be used to test Baumol hypothesis as well. If the growth rate of labour productivity in manufacturing higher than that of services (i.e. > ), the relative price of services products will rise over time. That means ∂( / )/9 > 0. Though the relatively expensive services would increase the services employment share, such relative price rise of the services products will make the needs for services reduce by β ratio. Those falling demands will reduce the services share in the total employment, and the net effect is 5(# + %)( − )6.
3. Empirical Results
Limited by the classification and availability of services data in China, the division of services and the content are arranged by the following: the third industry substitutes for the overall services industry (not including agriculture-related services), which the main services include transportation, storage, post and telecommunication services, wholesale retail trade and catering services, finance and insurance, real estate, comprehensive social services, scientific research and comprehensive technical services, education and health services, radio and television services. In addition, the second industry substitutes for the manufacturing sector, and the second industry includes manufacturing industries (mining, manufacturing and electric power, gas, water production and supply) and building industry.
This paper examines the services with the time span from 1997 to 2013, and the original data are all from each year
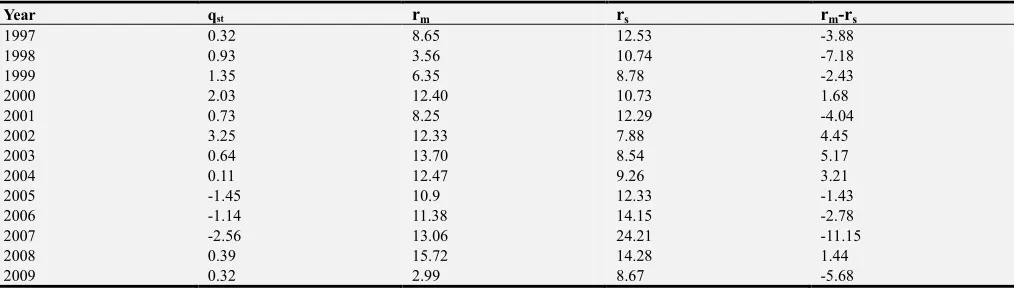
"China statistical yearbook" and "China labor statistics yearbook”. The added values of overall services and the second industry are converted a discounted conversion based on the 1990’s constant prices index, and the added value of services respectively is converted a discounted conversion based on the 1991’s constant prices index. The employment share of services industry and its sub-sectors are confirmed according to the comparison and the formula Ls / (Lm + Ls), and that means the employment share of services is equal to the total employment of services divided by the sum of the services’ and the manufacturing’s employment. Each of employment share of services sub-sectors is respectively equal to each employment number divided by the sum total of the services’ and the manufacturing’s employment. Labor productivity is presented by the average added value index of actual labor. As Table 1 shows, China's average growth rate of services employment share is 0.38% annually, and the rate is negative only in 2005, 2006 and 2007. With small fluctuation range of employment growth, the hysteresis effect of the growth rate of labor productivity is of no significance [23]. As for the mean value, the growth rate of labor productivity in services is slightly higher than that of manufacturing. So, as a whole, the reflection of Baumol’s hypothesis is of no significance in China within 1997-2013 periods. As shown in Table 2, the labor productivity of services keeps sound growth with steady rate in the whole sample period.
There are two main reasons: Firstly, it is a symptom of low labor productivity in manufacturing [24]. The services development is regarded as to upgrade the level of national economy and social development and gets unprecedented attention; therefore, the development potential of services gets released promoted by the policy incentives.
Secondly, the labor force of manufacturing and services is mainly from rural labor in China. The main increasing share of the labor engaged in services is mainly transferred from the rural labor force, and only a small part is from the manufacturing sector. The massive increase employment in services has not been accompanied by the decline share of manufacturing employment.
Table 1. The growth rate of labor productivity in manufacturing and services.
Year qst rm rs rm-rs
1997 0.32 8.65 12.53 -3.88
1998 0.93 3.56 10.74 -7.18
1999 1.35 6.35 8.78 -2.43
2000 2.03 12.40 10.73 1.68
2001 0.73 8.25 12.29 -4.04
2002 3.25 12.33 7.88 4.45
2003 0.64 13.70 8.54 5.17
2004 0.11 12.47 9.26 3.21
2005 -1.45 10.9 12.33 -1.43
2006 -1.14 11.38 14.15 -2.78
2007 -2.56 13.06 24.21 -11.15
2008 0.39 15.72 14.28 1.44
Year qst rm rs rm-rs
2010 0.41 3.52 12.11 3.44
2011 0.67 4.22 9.08 -3.3
2012 2.03 9.60 11.28 2.2
2013 0.33 5.41 8.52 -2.76
Mean value 0.38 10.13 11.88 -1.74
Standard deviation 5.17 13.58 14.84 16.66
Note:qst-- Growth rate of services employment rm--Growth rate of Labor productivity in manufacturing rs-- Growth rate of Labor productivity in services rm - rs -- The difference in growth rate
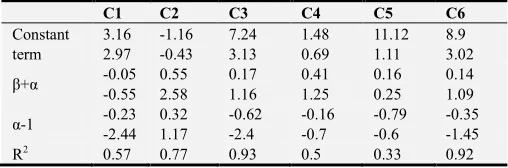
A considerable part of manufacturing labor is transferred from the rural labor. But in this model, we do not involve the agriculture sector. The results of the econometric calculations are given in Table 2. According to the growth reasons of services employment proposed by Fuchs (1968) and Baumol hypothesis [25], the hysteresis effect of services sector in China is not obvious.
The hysteresis coefficient of finance, insurance and real estate services is not significant, which shows that this model is not suitable for the measurement of employment increase in such services sectors.
Also, empirical analyses indicate that significant performance in goodness-of-fit (R2) in the transportation, storage, post, telecommunication services, wholesale retail trade and catering, and comprehensive social services, which results are consistent with theory expectation basically. This result indicates that the main reason of the fast employment growth in those services sectors is due to the lagging labor productivity. According to the regression equation in Table 2, it is easy to calculate the price elasticity and income elasticity of demand for services in China (presented in Table 3).
Table 2. The econometric results based on the Equation 8.
C1 C2 C3 C4 C5 C6 Constant term 3.16 2.97 -1.16 -0.43 7.24 3.13 1.48 0.69 11.12 1.11 8.9 3.02
β+α -0.05
-0.55 0.55 2.58 0.17 1.16 0.41 1.25 0.16 0.25 0.14 1.09
α-1 -0.23
-2.44 0.32 1.17 -0.62 -2.4 -0.16 -0.7 -0.79 -0.6 -0.35 -1.45
R2 0.57 0.77 0.93 0.5 0.33 0.92
Note: C1- The whole services
C2- Transportation, storage, post, telecommunication services C3- Wholesale retail trade and catering
C4- Finance and insurance C5- Real estate
C6- Comprehensive social services
Firstly, the income elasticity of demand is larger than 1 for transportation, storage, post, telecommunication services, while the price elasticity of other sub-sectors services and the overall services (in every period) are all less than 1 (two elasticity coefficient are not significant). The result indicates there is big difference of demand for different services. This result also shows that the demand for services is increasing with the rise of income level, but the real growth rate is different: the increase rate of transportation, storage, post, telecommunication services is far greater than that of income
level. Compared to the strong income elasticity in those services, the increase rate of the rest services and the whole is less than that of income level. Cheng has founded that both the demand for services and the services development stay in an extremely unbalanced state in China [26]; on the other hand, the average income and the economic development in China are still in low level. The income elasticity of transportation, storage, post, telecommunication services is larger than 1, thus the share in GDP will increase with the rise level of income no matter measured by the actual value or nominal value.
Table 3. The econometric results based on the Equation 8.
C1 C2 C3 C4 C5 C6
Income elasticity α 0.77 1.32 0.38 0.84 0.21 0.65
Price elasticity β -0.82 -0.77 -0.21 -0.43 -0.05 -0.51
Note: C1- The whole services
C2- Transportation, storage, post, telecommunication services C3- Wholesale retail trade and catering
C4- Finance and insurance C5- Real estate
C6- Comprehensive social services
Secondly, the price elasticity of demand for service shows normal result, while the absolute value is less than 1. The absolute values of price elasticity of finance, insurance, real estate services and wholesale retail trade and catering are less than 0.5 (the price elasticity coefficient of finance, insurance and real estate is not significant). This shows that the demand for a series of services is in less price elasticity in China, and the rise in the price of services will naturally lead to the increasing cost of consumption in the state of less price elasticity.
When people are unable to bear the increasing cost of consumption, the government will have to provide financial support (subsidy) [27]. If this subsidy continues, it will likely to force the government into serious financial difficulties even financial crisis. Therefore, "cost disease” is a problem worthy of attention in China currently. For Chinese government, it is urgent to exploit the opportunity of industrial upgrading, take effective measures to promote competition in the market, and to increase the services supply. It is also necessary to prevent the potential economic inflation and fiscal drag by improving the service quality and productivity.
4. Conclusion
manufacturing, the hysteresis of the labor productivity in services is not obvious during 1997 to 2009 period in China. There are many reasons to explain the steady growth of employment share of services in China, and the lagging growth of labor productivity in services can only explain parts of the reason. The main reason is the lower growth rate of labor productivity in manufacturing, and there are lots of underemployed farm labors in rural China. The external shocks of demand for services show weak effect on the employment growth in services and are not significant.
Excepting the income elasticity of demand for transportation, storage, post, telecommunication services larger than l, the elasticity of other services are less than l totally even with a bigger difference. This means that both the demand for services and the services development stay in an extremely unbalanced state in China; at the same time, the average income in China is still in low level.
The empirical analysis shows that the demand for most services is in less price elasticity in China. Coupled with rising price of services in recent years in China, the shift of expenditures into services financed of tax money will cause "cost disease" easily. For the governments, it is necessary to take effective policies to prevent the whole economy from the inflation and fiscal crisis.
Comparing the income elasticity and price elasticity of demand for service, it is reasonable to make the following prediction: no matter measured by the actual value or nominal value, the share of the whole services and transportation, storage, post, telecommunication services, real estate, wholesale retail trade and catering, finance, insurance, and comprehensive social services in GDP will increase as the income level rises in China.
Acknowledgements
We thank the National Natural Science Foundation of China (71473059). And this paper is supported by “the Fundamental Research Funds for the Central Universities” (HIT. HSS. 201110).
References
[1] Baumol, W. J., Bowen, W., 1965. On the performing arts: the anatomy of their economic problems. The American Economic Review, 55(2): 495-502.
[2] Baumol, W. J., 1967. Macroeconomics of unbalanced growth: the anatomy of urban crisis. The American Economic Review, 57 (3): 415–426.
[3] Baumol, W. J., Blackman, S. A. B. and Wolff, E. N., 1985. Unbalanced growth revisited: asymptotic stagnancy and new evidence. The American Economic Review, 75(4): 806-817. [4] Hartwig, J., 2011. Can Baumol’s model of unbalanced growth
contribute to explaining the secular rise in health care expenditure? an alternative test. Applied Economics, 43:173-184.
[5] Ramón P., Francisco G. V. 2017. Structural change and
productivity growth in Mexico, 1990–2014. Structural Change and Economic Dynamics, 41:53-63.
[6] Baumol, W. J., Towse, R. (Eds.), 1997. Baumol’s Cost Disease: The Arts and Other Victims, Edward Elgar, Aldershot. [7] Sasaki, H., 2012. Endogenous phase switch in Baumol’s
service paradox model. Structural Change and Economic Dynamics, 23: 25-35.
[8] Albin, P., 1970. Poverty, Education, and Unbalanced Economic Growth. The Quarterly Journal of Economics, 84(1): 70-84. [9] Echevarria, C., 1997. Changes in sectoral composition
associated with economic growth. International Economic Review, 38: 431-452.
[10] Triplett, J. E. and Bosworth, B. P., 2003. Baumol's disease has been cured. Federal Reserve Bank of New York Economic Policy Review, 9: 23-33.
[11] Nordhaus, W. D., 2008. Baumol’s diseases: a macroeconomic perspective. The B. E. Journal of Macroeconomics, 8: 1-37. [12] Haig, B., 1975. An analysis of changes in the distribution of
employment between manufacturing and service industries, 1960-1970. The Review of Economics and Statistics, 57: 35-42.
[13] Spann, R., 1977. The macroeconomics of unbalanced growth and the expanding public sector. Journal of Public Economics, 8:397-404.
[14] Summers, R., 1985. Services in the international economy; Saxonhouse, G. Services in the Japanese economy; Leveson, I. Services in the U. S. economy. In Inman (eds.), Managing the Service Economy: Prospects and Problems. Cambridge University Press.
[15] Solow, R. M., 1987. We’d better watch out. New York Times Book Review.
[16] Sasaki, H., 2007. The rise of service employment and its impact on aggregate productivity growth. Structural Change and Economic Dynamics, 18 (4): 438–459.
[17] Griliches, Z., 1992. Output measurement in the service sectors, NBER Studies in Income and Wealth, vol. 56, University of Chicago Press.
[18] Pugno, M., 2006. The service paradox and endogenous economic growth. Structural Change and Economic Dynamics, 17 (1): 99–115.
[19] De Vincenti, C., 2007. Baumol’s disease, production externalities and productivity effects of intersectoral transfers. Metroeconomica, 58 (3): 396–412.
[20] Rafael F., Enrique P., 2018. Measuring the role of manufacturing in the productivity growth of the European economies (1993–2007). Structural Change and Economic Dynamics, 46: 1-12.
[21] Gao, C. S. and Li, S. T., 2007. The paradox on services economy in China and the strategic choice for China to promote service economy. Economic Survey, 4:15-20. [22] Javier S., Frederick P., Jinhua Z., 2018. Worse than Baumol's
[23] Jing, X. Q., 2011. Study about regional difference of services industry in China. Economic Management, 6: 36-43.
[24] Cheng, D. Z., 2008. Is Chinese economy in the direction of tertiarization? Statistical Research, 25(9): 36-43.
[25] Fuchs, V., 1968. The Service Economy, National Bureau of Economic Research.
[26] Cheng, D. Z., 2010. Chinese services industries and economic growth. The Journal of World Economy, 10:25-42.