Impact of meteorological parameters and air pollution on
emergency department visits for cardiovascular diseases in
the city of Zagreb, Croatia
Sanja Pintarić
1, Ivan Zeljković
2, Gordana Pehnec
3, Višnja Nesek
4,7, Mislav Vrsalović
2,5, and
Hrvoje Pintarić
2,6First School of Economics1, University Hospital Centre Sisters of Charity2, Institute for Medical Research and
Occupational Health3, University Hospital Holy Spirit4, School of Medicine5, School of Dental Medicine6, University
of Zagreb, Zagreb, School of Medicine, Josip Juraj Strossmayer University of Osijek, Osijek7, Croatia
[Received in January 2016; CrossChecked in January 2016; Accepted in July 2016]
The aim of this study was to investigate whether nitrogen dioxide (NO2), ozone (O3), and certain meteorological conditions had
an impact on cardiovascular disease (CVD)-related emergency department (ED) visits in the metropolitan area of Zagreb. This retrospective, ecological study included 20,228 patients with a cardiovascular disease as their primary diagnosis who were examined in the EDs of two Croatian University Hospitals, Sisters of Charity and Holy Spirit, in the study period July 2008-June 2010. The median of daily CVD-related ED visits during the study period was 28 and was the highest during winter. A significant negative correlation was found between CVD-related emergency visits and air temperature measured no more than three days prior to the visit, and the highest negative correlation coefficient was measured two days
earlier (R=–0.266, p≤0.001). The number of CVD-related emergency visits significantly correlated with the average NO2
concentration on the same day (R=0.191, p<0.001). The results of multiple stepwise regression analysis showed that the
number of CVD-related emergency visits depended on air temperature, and NO2 and O3 concentrations. The higher the
air temperatures, the lower the number of daily CVD-related emergency visits (p<0.001). An increase in NO2 concentrations
(p=0.005) and a decrease in O3 concentrations of two days earlier (p=0.006) led to an increase in CVD-related ED visits.
In conclusion, the decrease in O3 concentrations and the increase in NO2, even if below the legally binding thresholds, could
be associated with an increase in CVD-related emergency visits and a similar effect was observed with lower temperature measured no more than three days prior to the visit.
KEY WORDS: atmospheric humidity; atmospheric pressure; nitrogen dioxide; ozone; temperature
In recent years, many studies and reviews have tried to identify and prove the effect of air pollution on cardiovascular diseases and explain the pathogenesis of this influence (1-4). Furthermore, several studies have shown that air pollution represents a great health risk even in developed countries with legally defined thresholds of air pollution (4-6). Cardiovascular diseases are the main mortality and morbidity cause both worldwide and in Croatia (5); it has been shown to an increasing extent that air pollution significantly contributes to worsened cardiovascular health (2-6). Zagreb, the capital of Croatia, is located in the northwest of the country, has a maritime temperate climate or oceanic climate (Cfb in the Köppen–Geiger climate classification system), and generally features four separate seasons with warm summers and cool (but not cold) winters and a relatively narrow annual temperature range. Around 1.2 million people live in a wider Zagreb metropolitan area, which accounts for more than 20 % of Croatia’s population,
making it the only metropolitan area in Croatia with a population of over one million and consequently an area with occasional higher levels of traffic-related pollution (7).
Nitrogen dioxide (NO2) is both a primary and a
secondary pollutant, as well as a strong respiratory irritant. Its main outdoor sources are motor vehicles and fossil-fuel power plants, whereas the most important indoor sources are gas heaters, stoves, and tobacco smoke (5, 6). Many studies and meta-analyses underlined the association
between daily increases in NO2 and cardiovascular and
respiratory mortality and morbidity (1, 5, 6). Ozone (O3) is
a secondary pollutant created indirectly in the troposphere from its precursors, e.g. oxides of nitrogen and volatile organic compounds. In urban areas, the main sources of ozone precursors are combustion engines. A few studies have shown its association with hospital admissions for cardiovascular and respiratory diseases (8, 9). For many cardiovascular conditions, however, as few as 10 % of those examined in the emergency department (ED) were admitted to hospital (9-11) whereas the remaining 90 % were treated in the ED but were not hospitalised. Thus, the number of ED visits reflects the impact of air pollution on CVD Correspondence to: Ivan Zeljković, University Hospital Centre Sisters
of Charity, Vinogradska 29, 10000 Zagreb, Croatia;
(10, 11).
The aim of this study was to investigate whether nitrogen dioxide, ozone, and certain meteorological conditions impacted CVD-related emergency visits in the metropolitan area of Zagreb over a period of two years. It is noteworthy to disclose that this study follows on a previously published similar study
in which the impact of atmospheric air pollution by NO2 and
meteorological parameters on a number of patients examined in EDs was studied (12); however, this study also includes the impact of ozone and the population of the metropolitan area of Zagreb which is almost twice as large in comparison with the previous study, the data of which were gathered from one hospital only.
METHODS
In the study period between July 2008 and June 2010 77,532 patients were examined in the EDs of two hospitals:
Sisters of Charity University Hospital Centre and Holy Spirit University Hospital. The study population included 20,228 patients with a cardiovascular disease as their primary diagnosis, classified as I00-I99 according to the
10th International Classification of Diseases (ICD-10). The
data on patients’ emergency department visits were extracted from the hospitals’ electronic system, which is used in both hospitals’ EDs. During the entire research period, this system was used to record the data on patients older than 18 years who were examined in EDs due to a cardiovascular disease. Patients without permanent residency in Zagreb and patients without a confirmed I00-I99 diagnosis were excluded from the study.
This retrospective ecological study aimed to evaluate the association (hourly, daily, and earlier days) between meteorological conditions, air pollutant levels, and cardiovascular patients referred to EDs during the study period. The number of CVD-related emergency visits was
compared with meteorological conditions and NO2 and O3
air concentrations during the overall period of the study, as well as during seasons only. Seasons were determined by weather conditions and not by calendar division as follows: winter = December to February, spring = March to May, summer = June to August, autumn = September to November.
Environmental data
Air pollution data were taken from the State Network for Continuous Air Quality Monitoring. The concentration
of NO2 was measured daily with automatic analyser using
the method of chemiluminescence at the monitoring stations Zagreb-1, Zagreb-2, and Zagreb-3 and were averaged. The
concentrations of O3 were measured only at Zagreb-1 due
the fact that it is the only station measuring O3 levels in
Zagreb, using an automatic analyser based on the method of ultraviolet photometry (UV absorption at 254 nm). The
the data integration frequency of one hour. The 8-hour and 24-hour averages were based on the hourly concentrations
of NO2 and O3 and were analysed as such. Meteorological
data: atmospheric temperature (ºC), atmospheric pressure (hPa), and relative atmospheric humidity (%) were based on the data collected at a Meteorological and Hydrological Service of Croatia’s meteorological station that covers the area of Zagreb in which the population gravitating to the study EDs lives. The meteorological data were converted from hourly values to daily averages so as to compare them with CVD-related emergency visits.
Since this was a retrospective ecological study, written informed consent was not necessary according to local legislation. The study protocol complied with Good Clinical Practice as well as the Declaration of Helsinki and the Hospital Ethics Committee provided its approval of the study.
Statistical analysis
Descriptive statistics were presented as the mean±standard deviation and median with the interquartile range and the analysis focused on the correlation between CVD-related ED visits, air pollutants, and meteorological factors. The mean values of individual variables were tested by a nonparametric Mann-Whitney test, which included two samples, and a non-parametric analysis of Kruskal-Wallis ANOVA for multiple samples. Data distribution was analysed using logarithms for the variables whose distribution was not normal. The correlation between the number of patients and each of the meteorological variables and air pollutants was tested by non-parametric Spearman’s rank correlation. The influence of a group of variables on the number of CVD-related emergency visits was tested by multiple stepwise regression analysis. A value of p<0.05 was considered statistically significant. Statistical analysis was done using the STATISTICA software, version 6.0 for Windows (Dell Software, StatSoft Inc., Tulsa, USA).
RESULTS
Meteorological parameters
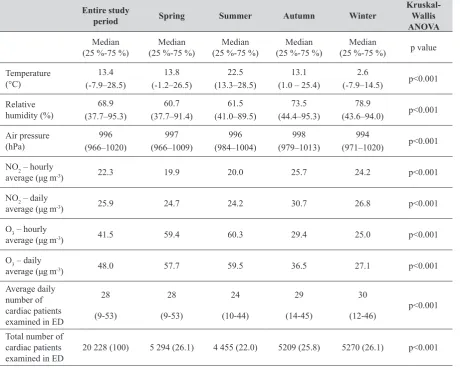
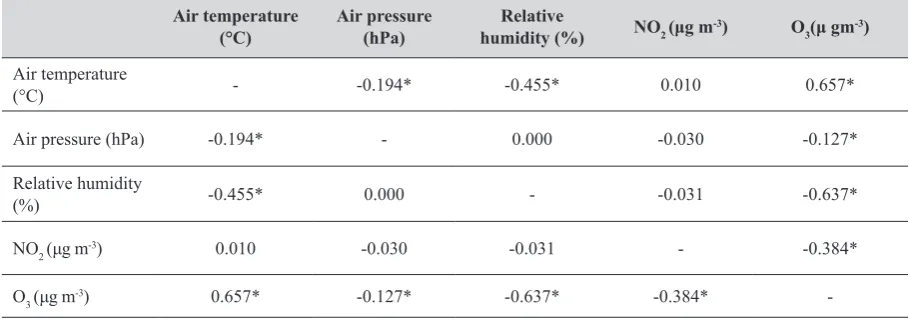
The daily average of CVD-related emergency visits was the highest in winter season (Table 1). Moreover, non-parametric analysis (Spearman’s correlation coefficient) showed that during the observation period CVD-related emergency visits significantly correlated to the air temperature measured no more than three days prior to the visit. The coefficient was negative, meaning that the lower the temperature the higher the number of CVD-related emergency visits. The highest negative correlation coefficient was found with the average temperature measured two days earlier (R=–0.266, p<0.001). The average relative air humidity of the same day positively correlated to CVD-related emergency visits (R=0.113, p=0.002). The average air pressure of the same day negatively correlated to the number of CVD-related emergency visits, but this correlation was not statistically significant (R=–0.056, p=0.131). Regarding the values of meteorological indicators by the observation period and by seasons, the lowest temperatures were recorded in winter with average 2.6 °C and the highest ones in summer (21.9 °C). The lowest atmospheric pressure was recorded in winter (994 hPa), and the highest in autumn
(998 hPa) but without statistical significance, whereas the highest relative humidity was recorded in winter (80 %) and in autumn (75 %), with significant correlation between higher relative humidity and lower temperatures (Table 2).
The nitrogen-oxide (NO2) effect
The highest daily values of air NO2 were recorded in
winter and the lowest in summer. During the two-year
observation period, the hourly values of NO2 concentrations
never exceeded the legally binding threshold of 200 µg m-3
set by Croatian and EU legislation (EU Directive 2008/50/
EC). The NO2 threshold for the averaging time of one year is
40 µg m-3, and it was not exceeded during the first year (1
July 2008 - 30 June 2009; 27.5 µg m-3), nor during the second
year (1 July 2009 - 30 June 2010; 27.1 µg m-3) of the observed
period. The number of CVD-related emergency visits
significantly correlated to the average NO2 concentration
on the same day (R=0.191, p<0.001). NO2 concentrations
of previous days did not have a statistically significant effect on the number of CVD-related emergency visits (Table 3).
period and during seasons
Entire study
period Spring Summer Autumn Winter
Kruskal-Wallis ANOVA Median
(25 %-75 %) (25 %-75 %)Median (25 %-75 %)Median (25 %-75 %)Median (25 %-75 %)Median p value Temperature
(°C) (-7.9–28.5)13.4
13.8 (-1.2–26.5)
22.5 (13.3–28.5)
13.1 (1.0 – 25.4)
2.6
(-7.9–14.5) p<0.001 Relative
humidity (%) (37.7–95.3)68.9
60.7 (37.7–91.4)
61.5 (41.0–89.5)
73.5 (44.4–95.3)
78.9
(43.6–94.0) p<0.001 Air pressure
(hPa) (966–1020)996
997 (966–1009)
996 (984–1004)
998 (979–1013)
994
(971–1020) p<0.001 NO2 – hourly
average (μg m-3) 22.3 19.9 20.0 25.7 24.2 p<0.001
NO2 – daily
average (μg m-3) 25.9 24.7 24.2 30.7 26.8 p<0.001
O3 – hourly
average (μg m-3) 41.5 59.4 60.3 29.4 25.0 p<0.001
O3 – daily
average (μg m-3) 48.0 57.7 59.5 36.5 27.1 p<0.001
Average daily number of cardiac patients examined in ED
28 (9-53)
28 (9-53)
24
(10-44)
29 (14-45)
30
(12-46) p<0.001 Total number of
cardiac patients
The ozone (O3) effect
The highest hourly values of O3 were recorded in
summer (Table 1). The median hourly averages for the
observation period amounted to 41.5 µg m-3, and the highest
were recorded in summer (60.3 µg m-3). The highest daily
averages were recorded in spring with the maximum of
126 µg m-3, which is also the maximum for the whole
observation period. The maximum eight-hour average
concentration of O3 for the two-year observation period was
160.4 µg m-3 and was recorded in summer. The medians of
eight-hour moving averages were calculated, recording the
highest values in spring and summer (59.4 and 59.6 µg m-3).
The number of days with a maximum daily eight-hour
mean of O3 values higher than 120 µg m-3 (which is the target
value according to the EU Directive 2008/50/EC) was specified. According to Croatian legislation, the maximum
daily eight-hour moving average of O3 concentrations should
not exceed 120 µg m-3 on more than 25 calendar days, averaged
over three years. During the two-year observation period, the
number of days with ozone values above 120 µg m-3 was 38,
out of which most were recorded in summer (24 days), whereas not a single day was recorded in winter. Considering the World Health Organization’s (WHO) recommendation on
the threshold of 100 µg m-3, the number of days with
eight-hour concentration averages above 100 µg m-3 was 166, out
of which most were recorded in summer (81 days). During the observation period there was a statistically significant
negative correlation between O3 and relative humidity
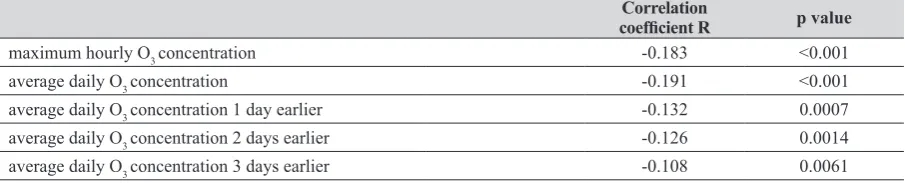
(R=-0.637, p<0.001) as well as air pressure (R=-0.127, p=0.001) (Table 2). The number of CVD-related emergency visits
significantly negatively correlated to the average O3
concentration on the same day, as well as up to three days earlier (Table 4). However, the correlation coefficient between the number of ED cardiac patients and the air temperature measured two days earlier was –0.266, whereas
the correlation to O3 concentrations measured two days
earlier was significantly lower, amounting to –0.126. Meanwhile, the correlation coefficient between the
temperature and O3 amounted to 0.572 regarding the daily
average, or even 0.737 regarding the maximum hourly O3
values within a day.
Multiple stepwise regression analysis
The results of multiple stepwise regression analysis showed that the number of CVD-related emergency visits significantly depended on three variables: air temperature,
NO2 concentration, and O3 concentration. The higher the air
temperatures, the lower the number of CVD-related
emergency visits (r=-0.09). The increase in O3 concentrations
was also associated with a decrease in CVD-related emergency visits (r=-0.190, p=0.006). Moreover, an
increase in NO2 concentrations was associated with an
increase in CVD related emergency visits (r=0.055).
DISCUSSION
In this study, we investigated the impact of air pollutants together with meteorological parameters on the number of CVD-related emergency visits. Our data revealed that air pollutant levels and air temperature were associated with the number of CVD-related emergency visits. A significant increase in the daily number of CVD-related emergency
visits was associated with increased NO2 air concentrations,
lower O3 concentrations on the same day, and lower air
temperature measured no more than three days prior to the visit, with the highest negative correlation coefficient measured two days earlier.
The observed meteorological values were as expected, considering Zagreb’s latitude and climate zone. According to our results, there was a negative correlation of air temperature and the number of CVD-related emergency visits throughout the whole observed period. Mean daily air temperature did not exceed 22.5 °C and most likely for that reason positive correlation was not found in the warmest part of the year. Moreover, the negative correlation coefficient in the warmest part of the year was undoubtedly the least pronounced. In many cities with Cfb climate, as in Zagreb, the mortality rate of cardiovascular disorders during winter
Air temperature
(°C) Air pressure (hPa) humidity (%)Relative NO2 (μg m-3) O3(μ gm-3)
Air temperature
(°C) - -0.194* -0.455* 0.010 0.657*
Air pressure (hPa) -0.194* - 0.000 -0.030 -0.127*
Relative humidity
(%) -0.455* 0.000 - -0.031 -0.637*
NO2 (μg m-3) 0.010 -0.030 -0.031 - -0.384*
O3 (μg m-3) 0.657* -0.127* -0.637* -0.384*
temperature fluctuations cause increased morbidity and mortality from cardiovascular diseases (13, 14). In the winter period, the longer the low temperature period the higher the risk, while in the warm part of the year increased air temperatures affect directly the risk of cardiovascular incidents (13-15). Numerous scientific studies have presented air temperature as the main parameter, with any accompanying air pollutant, which highly affects the risk of cardiovascular incidents (14-17), as confirmed by the results of our work.
Schwarz et al. (18) found that in 12 United States cities, covering a wide range of different geographical regions, the effects of relative humidity on ED cardiac visits were small, almost statistically insignificant, but the effects of low and high temperatures were high, especially with myocardial infarction. They concluded that the effects mainly occurred within a few days after exposure (usually two days) and ceased within ten days after exposure. The results of our study coincide with the results of their work, with an exception that the average relative humidity had a positive correlation coefficient with the number of ED visits of cardiac patients.
Although the levels of NO2 have not exceeded the legally
binding threshold values, there was a significant association
between NO2 concentration and the number of CVD-related
emergency visits, especially in winter time when weather
conditions favour the emergence of higher NO2 concentrations.
In our study, the strongest correlation was found with average
daily values of NO2 measured on the same day. This result
shows that ambient NO2 concentrations, which are below the
legally binding limit values, strongly affect the number of CVD-related emergency visits, which was confirmed in several previous studies (19-21).
Several review studies (2, 9, 22) showed that O3 was
one of the most toxic compounds of mixed photochemical smog. Results of our study revealed a negative correlation
between O3 concentrations and CVD-related emergency
However, many studies showed destructive effects of this pollutant on the cardiovascular system. A study by Koken et al. (25) has proved in the city of Denver, which has a cold continental climate, a significant association of high
temperatures and high O3 values with CVD-related
emergency visits, especially with acute myocardial infarction and cardiac arrhythmias. Similar to this, Shahi et al. (26) indicated that a growing number of cardiac patients examined in the emergency departments of the capital city of Tehran were recorded on the third day after two days of increased concentrations of ozone.
According to our findings, which are in agreement with most previous similar studies, health care systems need to be ready to control and treat diseases arising from air pollution. Data on the number of patients admitted is vital in ensuring suitable equipment and facilities proportionate to the number of admitted patients. On the other hand, because of the differences in pollutant levels of various geographical locations, the pattern of hospital admissions is noticeably different in days of greater pollution. Therefore, it is critical that health care systems of countries are informed about the pattern of hospital admissions and polluted days to have more accurate managing programmes for this crisis. Also, the need for improved legal regulations and lower upper legally binding threshold values of air pollution should be emphasised, because air pollution that is within the permitted legal levels is associated with the increase in CVD-related emergency visits, which was
confirmed in our study, especially for NO2.
Limitations
Although the study period was rather short, there were no exceptional events that could have influenced the results. The study was based on a population as large as 1.2 million
Table 3 Cardiovascular disease related-emergency visits over a period of 692 days correlated with nitrogen-dioxide (NO2) concentrations
Correlation
coefficient R p value
maximum hourly NO2 concentration 0.072 0.057
average daily NO2 concentration 0.191 <0.001
average daily NO2concentration 1 day earlier 0.034 0.378
average daily NO2 concentration 2 days earlier -0.037 0.329
average daily NO2 concentration 3 days earlier -0.009 0.804
Table 4 Cardiovascular disease-related emergency visits over a period of 646 days correlated with ozone (O3) concentrations
Correlation
coefficient R p value
maximum hourly O3 concentration -0.183 <0.001
average daily O3 concentration -0.191 <0.001
average daily O3 concentration 1 day earlier -0.132 0.0007
average daily O3 concentration 2 days earlier -0.126 0.0014
visits were quite frequent and reached the number of 28, which ensured the statistical power of the analysis. However, the results of the study should be considered in
the light of certain limitations. The O3 data was taken from
only one monitoring station, which may lead to the misclassification of exposure level. However, this misclassification is non-differential and should bias the effect estimates towards the null. Moreover, as with every ecological study, there is a lack of precise exposure estimates at individual level and misclassification of exposure due to different daily activity patterns and local mobility of each patient and the deduction of cause-effect relations should be done with caution. Additionally, there are large scale factors that may influence CVD rates and CVD-related emergency visits which were not taken into account.
In conclusion, to the authors’ knowledge this was the first study in Croatia that investigated the influence of air
pollution, including nitrogen dioxide (NO2) and ozone (O3),
and certain meteorological parameters on emergency department visits of patients with cardiovascular diseases.
The authors report no conflict of interest.
Acknowledgments
The authors are grateful to Professor Ivana Zeljkovic for her valuable expert assistance with the English language. Moreover, the authors appreciate the cooperation of the emergency departments’ staff of the University Hospital
Centre Sisters of Charity and University Hospital Holy
Spirit, Zagreb, Croatia.
REFERENCES
1. Lipsett MJ, Ostro BD, Reynolds P, Goldberg D, Hertz A, Jerrett M, Smith DF, Garcia C, Chang ET, Bernstein L. Long-term exposure to air pollution and cardiorespiratory disease in the California teachers study cohort. Am J RespirCrit Care Med 2011;184:828-35. doi: 10.1164/rccm.201012-2082OC 2. Bell ML, Dominici F, Samet JM. A meta-analysis of time-series studies of ozone and mortality with comparison to the national morbidity, mortality, and air pollution study. Epidemiology 2005;16:436-45. PMCID: PMC3581312 3. Le Tertre A, Medina S, Samoli E, Forsberg B, Michelozzi P,
Boumghar A, Vonk JM, Bellini A, Atkinson R, Ayres JG, Sunyer J, Schwartz J, Katsouyanni K. Short-term effects of particulate air pollution on cardiovascular diseases in eight European cities. J Epidemiol Community Health 2002;56:773-9. doi: 10.1136/jech.56.10.773
4. Basagaña X, Jacquemin B, Karanasiou A, Ostro B, Querol X, Agis D, Alessandrini E, Alguacil J, Artiñano B, Catrambone M, de la Rosa JD, Díaz J, Faustini A, Ferrari S, Forastiere F, Katsouyanni K, Linares C, Perrino C, Ranzi A, Ricciardelli I, Samoli E, Zauli-Sajani S, Sunyer J, Stafoggia M; MED-PARTICLES Study group. Short-term effects of particulate matter constituents on daily hospitalizations and
MED-PARTICLES project. Environ Int 2015;75:151-8. doi: 10.1016/j.envint.2014.11.011
5. Brunekreef B, Holgate ST. Air pollution and health. Lancet 2002;360:1233-42. doi: 10.1016/S0140-6736(02)11274-8 6. Samoli E, Aga E, Touloumi G, Nisiotis K, Forsberg B,
Lefranc A, Pekkanen J, Wojtyniak B, Schindler C, Niciu E, Brunstein R, Dodic Fikfak M, Schwartz J, Katsouyanni K. Short-term effects of nitrogen dioxide on mortality: an analysis within the APHEA project. Eur Respir J 2006;27:1129-38. doi: 10.1183/09031936.06.00143905 7. Croatian Bureau of Statistics. Census of Population,
Households and Dwellings 2011 [displayed 6 July 2016]. Available at http://www.dzs.hr/default_e.htm
8. World Health Organization (WHO). The 10 leading causes of death by broad income group, 2004. Geneva: WHO; 2004. 9. Gryparis A, Forsberg B, Katsouyanni K, Analitis A, Touloumi
G, Schwartz J, Samoli E, Medina S, Anderson HR, Niciu EM, Wichmann HE, Kriz B, Kosnik M, Skorkovsky J, Vonk JM, Dörtbudak Z. Acute effects of ozone on mortality from the “air pollution and health: a European approach” project. Am J Respir Crit Care Med 2004;170:1080-7. doi: 10.1164/ rccm.200403-333OC
10. Stieb DM, Judek S, Burnett RT. Meta-analysis of time-series studies of air pollution and mortality: effects of gases and particles and the influence of cause of death, age, and season. J Air Waste Manag Assoc 2002;52:470-84. doi: 10.1080/10473289.2002.10470794
11. Stieb DM, Szyszkowicz M, Rowe BH, Leech JA. Air pollution and emergency department visits for cardiac and respiratory conditions: a multi-city time-series analysis. Environ Health 2009;8:25. doi: 10.1186/1476-069X-8-25 12. Pintarić S, Bodrožić-Džakić T, Pintarić H, Rusan Z, Ljubičić
S. Effects of nitrogen dioxide and meteorological conditions on the number of patients presenting to emergency department. Acta Clin Croat 2012;51:9-15. PMID: 22919997 13. Wang XY, Barnett AG, Yu W, FitzGerald G, Tippett V, Aitken
P, Neville G, McRae D, Verrall K, Tong S. The impact of heatwaves on mortality and emergency hospital admissions from non-external causes in Brisbane, Australia. Occup Environ Med 2012;69:163-9. doi: 10.1136/oem.2010.062141. 14. Nayha S. Cold and the risk of cardiovascular diseases. A
review. Int J Circumpolar Health 2002;61:373-80. PMID: 12546195
15. Liu L, Breitner S, Pan X, Franck U, Leitte AM, Wiedensohler A, von Klot S, Wichmann HE, Peters A, Schneider A. Associations between air temperature and cardio-respiratory mortality in the urban area of Beijing, China: a time-series analysis. Environ Health 2011;10:51-65. doi: 10.1186/1476-069X-10-51
16. Baccini M, Kosatsky T, Analitis A,Anderson HR, D’Ovidio M, Menne B, Michelozzi P, Biggeri A; PHEWE Collaborative Group. Impact of heat on mortality in 15 European cities: attributable deaths under different weather scenarios. J Epidemiol Community Health 2011; 65:64-70. doi: 10.1136/ jech.2008.085639
scitotenv.2013.03.023
18. Schwartz J, Samet JM, Patz JA. Hospital admissions for heart disease: the effects of temperature and humidity. Epidemiology 2004;15:755-61. doi: 10.1097/01.ede.0000134875.15919.0f 19. Metzger KB, Tolbert PE, Klein M,Peel JL, Flanders WD,
Todd K, Mulholland JA, Ryan PB, Frumkin H. Ambient air pollution and cardiovascular emergency department visits. Epidemiology 2004;15:46-56. doi: 10.1097/01. EDE.0000101748.28283.97
20. Vanos JK, Hebbern C, Cakmak S. Risk assessment for cardiovascular and respiratory mortality due to air pollution and synoptic meteorology in 10 Canadian cities. Environ Pollut 2014;185:322-32. doi: 10.1016/j.envpol.2013.11.007 21. Tong L, Li K, Zhou Q. Promoted relationship of cardiovascular
morbidity with air pollutants in a typical Chinese urban area. PLoS One 2014;9:e108076. doi: 10.1371/journal.pone. 0108076
Ozone and cardiovascular injury. Cardiovasc Ultrasound 2009;7:30. doi: 10.1186/1476-7120-7-30
23. Levy JI, Chemerynski SM, Sarnat JA. Ozone exposure and mortality: an empiric bayesmeta regression analysis. Epidemiology 2005;16:458-68. PMID: 15951663
24. Qorbani M, Yunesian M, Fotouhi A, Zeraati H, Sadeghian S, Rashidi Y. Relation between air pollution exposure and onset of acute coronary syndrome in Tehran Heart Center using a case-crossover design. Iran J Epidemiol 2007;3:53-9. 25. Koken PJ, Piver WT, Ye F, Elixhauser A, Olsen LM, Portier
CJ. Temperature, air pollution, and hospitalization for cardiovascular diseases among elderly people in Denver. Environ Health Perspect 2003;111:1312-7. doi: 10.1289/ ehp.5957
26. Shahi AM, Omraninava A, Goli M, Soheilarezoomand HR, Mirzaei N. The effects of air ollution on cardiovascular and respiratory causes of emergency admission. Emergency (Tehran) 2014;2:107-14. PMCID: PMC4614571
Utjecaj meteoroloških parametara i onečišćenja zraka na preglede u Hitnoj službi zbog kardiovaskularnih bolesti u gradu Zagrebu, Hrvatska
Cilj istraživanja bio je ispitati imaju li dušikov dioksid (NO2), ozon (O3) i određene meteorološke prilike utjecaja na broj
pregleda u Hitnoj službi (HS) zbog kardiovaskularnih bolesti (KVB) u gradu Zagrebu. U ovu retrospektivnu, ekološku studiju bilo je uključeno 20.228 bolesnika s primarnom dijagnozom jedne od kardiovaskularnih bolesti, pregledanih u HS-u dviju kliničkih bolnica: Sestre milosrdnice i „Sveti Duh“, u promatranom razdoblju od srpnja 2008. do lipnja 2010. Medijan dnevnih pregleda u HS-u zbog KVB-a tijekom promatranog razdoblja bio je 28, a najviše tijekom zime. Značajna negativna korelacija utvrđena je između broja pregleda u HS-u zbog KVB-a i temperature zraka do tri dana ranije, s najvećim negativnim koeficijentom korelacije dva dana ranije (R=-0,266, p=0,000). Broj pregleda u HS-u zbog KVB-a
značajno korelira s prosječnim koncentracijama NO2 na isti dan (R=0,191, p=0,000). Rezultati stupnjevite regresijske
analize pokazali su da broj pregleda u HS-u zbog KVB-a ovisi o temperaturi zraka i koncentraciji NO2 i O3. Što je viša
temperatura zraka, to je manji broj pregleda u HS-u zbog KVB-a (p=0,000), a slično vrijedi i za koncentraciju ozona
(p=0,006). Povećanje koncentracije NO2 povezano je s povećanjem broja pregleda u HS-u zbog KVB-a (p=0,005).
Zaključno se može ustvrditi da povećanje koncentracije NO2 može biti povezano s povećanjem broja pregleda u HS-u
zbog KVB-a, čak ako su navedene koncentracije unutar pravnoobvezujućih razina, sa sličnim utjecajem niže temperature zraka do tri dana ranije.