Educational Inclusion among Marginalized
Sections in India an Overview
Dr. Ravi kumar S.1 1
Lecturer, Department of P.G. Studies and Research in Economics, Sahyadri Arts College, Shivamogga,
Abstract: It is now universally accepted that the objective of inclusive growth cannot be attained without Educational inclusion. It appears to be a vital tool in achieving inclusive growth, through generating self employment opportunities to the people at the bottom of the pyramid. Access to safe and affordable educational services for the poor and disadvantaged people is a prerequisite for reducing income disparities among rich and poor, eradication of poverty. It is also considered to be a vital tool to provide strengthening the marginalized sections, those who are excluded from the development process, active participate them to the mainstreaming development and also provides skill and enthusiasm to the weaker sections of the society specially Scheduled Caste and Scheduled Tribes. Gandhiji once said “We must approach the poor with the mind of the poor.” It also plays a predominant role in improving the citizen values, improving the standard of living, building better future, taking the right decisions, building the confidence and modifying the personality. Since independence, both Central and State governments have been implemented various policies, programmes for the educational development of these marginalized sections as a result there is increasing trend of literacy rate of these groups and narrowing down, but as compared to rest of the population even today the status of education and as well as higher education among SC and STs there is gap. To minimize the gap between SC and STs, there is urgent need strengthening educational inclusion among SC and STs by effectively and efficiently implementing the policies, programmes is the utmost to achieve Educational inclusion among marginalized sections specially SC and STs. The present paper discusses the Educational Inclusion among Marginalized Sections in India especially Scheduled Castes and Scheduled Tribes. This study is based on the secondary sources of data collected from various books, journals and periodicals. Statistical information on Educational status among SC and STs gathered from the various census reports.
Keywords: Inclusive growth, Educational inclusion, Scheduled Caste and Scheduled Tribes
I. INTRODUCTION
The Government of India, under Eleventh Five Year Plan has emphasized on inclusive growth. It is now universally accepted that the objective of inclusive growth cannot be attained without educational inclusion. Inclusive education is about how we develop and design our schools, class rooms, programs, and activities, so that all students learn and participate together. It includes them to develop individual strengths and gifts, with high and proper expectations for each child and work on individual goals while participating in the life of the classroom with other students their own age. It provides opportunities to learn about and accept human being differences, lessening the collision of harassment bullying positively affect both their school and community to appreciate diversity and inclusion on a broader level. Access to safe and affordable educational services for the poor and disadvantaged people is a pre-requisite for reducing income disparities among rich and the poor. In the words of Gandhiji “We must approach the poor with the mind of the poor. It also plays a predominant role in the improving citizen values, improving the standard of living,
building better future, taking the right decisions, building the confidence, and modifying the personality. According to the Asian
have been implemented various educational developmental schemes for the development of SC and STs but even today the educational status among SC and STs worse there is wider gap between SC and STs as compared to general population. Hence, there is a need to strengthening educational status among SC and STs by effectively, efficiently implementing, policies and programmes to the needy ones, those who are excluded from the mainstreaming development is leading to inclusive growth. In this connection the topic taken for the study is considered as highly justifiable.
II. REVIEW OF LITERATURE
Many studies have been undertaken on educational status of Scheduled Caste and Scheduled Tribes in India. Some of the earlier studies are briefly reviewed here under for getting insight of the topic. Malavika Karlekar (1983), in his study on Educational Experience of Scheduled Castes and Tribes, agreed with the view point of Krishna Kumar that curricula need to be made relevant as well as incorporate the life experiences of deprived groups and an analogy may be drawn between SC/ST children and girls, and also poorly represented in school text books. Das (2009), proved in his study on Tribal Education and Development that the tribal community, for a long time, has not been able to realize their potentials due to low levels of education. Education is essential for tribal development.
It leads to enormous possibilities of enhancing the quality of tribal life and reducing the dreadful poverty by raising household income, bringing down the status of fertility and mortality; making them aware of health and nutrition, enabling them to have awareness and capitalize various schemes operated for their upliftment, a need based quality primary education for tribals in the country. Development of villages have positively influenced on school participation of children. Raju Narayana Swamy (2010), in his study on Tribal Education as a Tool for Rural Transformation: A Case study of Paniyas in Wayanad examined the tribals and found that they are the most socially and educationally disadvantaged groups in India. Tarun Bikash Sukai (2010), in his study on Tribal Development in India viewed that Scheduled Tribes are the weaker section of India’s population, from ecological, economic and education angles and also they constitute the matrix of India’s poverty. Annapoorani and Krithiga (2011), in their study on Tribal Education with Reference to Irulas argued that education is crucial to all-round development as it provides the individual with adequate skill for participating in various economic activities.
They also argued that the importance of education is more pronounced for the tribals since they account for sizeable proportion of India’s population. Gadadhara Mohapatra and Kiran Sharma (2013), in their article on Inclusive Growth, Poverty and Human Development in India, argued that inclusive paradigm of growth is highly essential to promote development of weaker sections of the society. According to them inclusive development is needed to improve the condition of the vulnerable groups of the society and there is necessity of a better governance and deeper involvement of the local people in the development programs. Skill development and employment opportunities must be the important component strategy for inclusive growth. Neera Goutam (2014), an article on Education of Scheduled Tribes in India : Schemes and Programmes, found that Scheduled Tribes are one of the principal categories of the backward classes or historically disadvantaged bottom group of the society. Despite several campaigns to promote formal education ever since independence, the literacy rate among Scheduled Tribes remained low and the female literacy rate still lower when compared to national female literacy rate.
Snehalata Panda (2015), an article on Health Status of Tribes and New Initiatives, found that Five Year Plans since independence have a major health component for tribes with huge fund allocated for human resource and infrastructure development. Comprehensive measuring has been initiated for sanitation, water purification, communication and education. Primarily health centres are instituted for every 20,000 persons in tribal sub-centres are available for 3,000 populations. Both Central and State Governments have implemented programmes for preventive and curative health services.
III. OBJECTIVES
A. To assess the gross enrolment ratio of SC/STs and general population at different levels of education in India.
B. To analyze the growth trends of literacy rates among SC and STs during the census period from 1961 to 2011 in India.
C. To assess the literacy rate of male and female of all social groups, SC and ST population during the period from 1961 to 2011
in India.
IV. SCOPE
V. METHODOLOGY
The present study is based on the secondary data which have been collected from various books, journals and periodicals. Reliable
statistical information on educational status of SC and ST population in India is gathered from the websites, articles, and various
census reports.
VI. SCHEDULED CASTE AND SCHEDULED TRIBES - INDIAN SCENARIO
Scheduled Caste and Scheduled Tribes are the marginalized sections of the society. They are suffering from basic amenities such as health, education and pure drinking water facilities. After independence, the Scheduled Castes (SCs) and Scheduled Tribes (STs) received special attention through the Constitution of India with special provisions in education, employment and political representation. Article 46, for instance, declares: “The State shall promote with special care the educational and economic interests of the weaker sections of the people and in particular of the Scheduled Castes and Scheduled Tribes, and shall protect them from social injustice and all forms of exploitation.” The UNICEF and UNESCO (2014) have reported that Dalit girls have the highest primary school exclusion rate in India. The report also indicates that half of the pre-school aged dalit children are not attending school and the contributing factors to higher rates of exclusion are deep-rooted social inequalities and poverty among dalits
(Scheduled Castes). As per 2011 census, 70.7 per cent of SCs and 64.8 per cent of STs are main workers as against 75.2 per cent for
general population. Similarly, 29.3 per cent of SCs and 35.2 per cent of STs, 24.8 per cent in general population are marginal
workers and 14.8 per cent of SCs, 34.5 per cent for STs are cultivators. About 45.9 per cent of SCs, 44.5 per cent of STs and 30.0
per cent of all groups are agricultural labourers. About 3.2 per cent in case of SCs, 1.8 per cent of STs and 3.8 per cent of general population are in the household industry as per 2011 census. Further, 36.1 per cent of SCs, 19.2 per cent of STs and 41.6 per cent of the general population are other workers. The details of the composition of SC and STs in total population are presented in Table 1.
Table 1 SC and ST Population in India, 1981-2011(Percentage)
Year SC S T Total
1981 15.8 7.8 23.6
1991 16.5 8.1 24.6
2001 16.2 8.2 24.4
2011 16.6 8.6 25.2
Source : Venkatanarayana Motkuri (2013), Scheduled Castes (SCs) and Tribes (STs) in Andhra Pradesh : A Situation Assessment Analysis, S. R. Sankaran Chair (Rural Labour), National Institute of Rural Development, Hyderabad, p. 3.
The SC and STs together constituted 23.6 per cent of the total population as per 1981 census and 25.2 per cent as per 2011 census. The share of SC population was 15.8 per cent in 1981 which was increased to 16.6 per cent in 2011. Proportion of the ST population, which has 7.8 per cent in 1981 increased to 8.6 per cent in 2011. It is clear that the population of SC and STs increased during the various Census periods.
VII.EDUCATIONAL STATUS OF SC AND STS IN INDIA
[image:4.612.61.554.601.727.2]Education is a vital tool for achieving inclusive growth by eradicating poverty and unemployment. Education is not only a tool for enhancing efficiency but also an effective instrument for augmenting and widening democratic participation and improving the overall quality of individual and the society.
Table 02
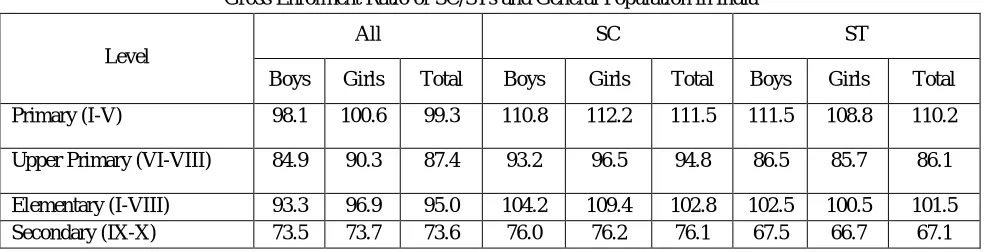
Gross Enrolment Ratio of SC/STs and General Population in India
Level
All SC ST
Boys Girls Total Boys Girls Total Boys Girls Total
Primary (I-V) 98.1 100.6 99.3 110.8 112.2 111.5 111.5 108.8 110.2
Upper Primary (VI-VIII) 84.9 90.3 87.4 93.2 96.5 94.8 86.5 85.7 86.1
Elementary (I-VIII) 93.3 96.9 95.0 104.2 109.4 102.8 102.5 100.5 101.5
I-X 89.4 92.4 90.8 98.6 103.0 97.6 95.9 94.2 95.1
Senior Secondary (XI-XII) 49.1 49.1 49.1 48.1 49.7 48.8 35.5 33.2 34.4
I-XII 83.3 85.9 84.6 91.1 93.3 92.2 87.5 86.0 86.8
Higher Education 22.3 19.8 21.1 16 14.2 15.1 12.4 9.7 11
Source : For School Education: U‐DISE‐2013‐14(Provisional) For Higher Education : AISHE‐2012‐13 (Provisional) Report Data gathered from Educational Statistics At A Glance Government of India Ministry of Human Resource Development Bureau
of Planning, Monitoring & Statistics New Delhi 2014 P.7
The data presented in the Table 2 shows that the Gross Enrolment Ratio (GER) of SC/STs and General Population in India at different level of education. The Gross enrolment of SC and STs girls and boys was found highest than general population at primary level. In the Upper primary level of these categories both SC and STs increased but as compared general population STs
girls were low. In the Elementary both the SCs and STs Boys and girls registered higher than the general population. It was in
secondary level SCs was found higher than general population and but STs were low as compared SCs and general population. In the stage of Up to I to X level the enrolment of these categories was found higher than general population and in senior secondary level the enrolment of SC boys and STs both boys and girls are low as compared general population. The enrolment up to I to XII level among these categories registered higher than all categories. The Status of higher education level of these marginalized sections was found worsen as compared general population. It was 15.1 perc ent of SCs boys and girls and 11 percent of boys and girls in STs, in general population 21.1 per cent of boys and girls enrolled.
VIII. TRENDS IN LITERACY RATES AMONG SC/STS AND GENERAL POPULATION
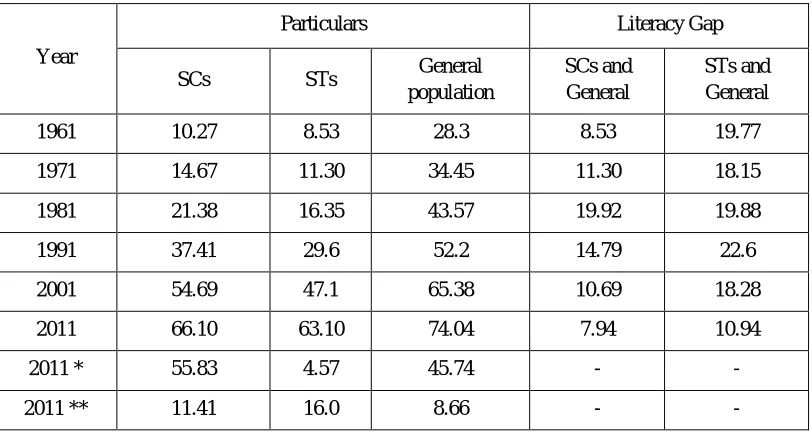
The crude literacy rates distinguish among SC/STs and the general population from 1961 to 2011clearly indicates the gap between
[image:5.612.105.511.393.612.2]SC/STs and the rest of the country’s population. The details are shown in Table 3.
Table 3
Trends in Literacy Rates among SC, STs and General Population (Percentage)
Year
Particulars Literacy Gap
SCs STs General
population
SCs and General
STs and General
1961 10.27 8.53 28.3 8.53 19.77
1971 14.67 11.30 34.45 11.30 18.15
1981 21.38 16.35 43.57 19.92 19.88
1991 37.41 29.6 52.2 14.79 22.6
2001 54.69 47.1 65.38 10.69 18.28
2011 66.10 63.10 74.04 7.94 10.94
2011 * 55.83 4.57 45.74 - -
2011 ** 11.41 16.0 8.66 - -
Note: * Represent percentage increase in 2011 from 1961 and ** percentage increase in 2011 over 2001.
Source: 1) Educational Statistics of Selected Scheduled Castes and Scheduled Tribes, Ministry of Human Resource development1993 and Primary Census Abstract, Census of India 2001, Reproduced in Population Dynamics and Deprivation in Crude Literacy among Scheduled Tribes in India by C.M. Lakshmana (2009), Population Research Centre, Institute forSocial and Economic Change, pp. 23-24; National Commission for SC and STs, Fifth Report and Census, 2011, Reproduced in Kabita Kumari Sahu (2014), Challenging Issues of Tribal Education in India, IOSR Journal of Economics and Finance (IOSR-JEF), Vol. 3, Issue 2, Ver. II, p. 50. 2) Primary Census Abstract for Total Population,
3) Statistical Profile of Scheduled Tribes in India 2013, Ministry of Tribal Affairs, Statistics Division, Government of India, p. 13. 4. Census of India, Office of Registrar General, India, p. 2.
The literacy rate of SCs has increased from 10.27 per cent in 1961 to 66.10 per cent in 2011, registering an increase of 55.83 percentage points in five decades. The literacy rate of STs has increased from 8.53 per cent in 1961 to 63.1 per cent in 2011 registering an increase of 54.57 percentage points. The literacy rate for the general population increased from 28.3 per cent to 74.04 per cent in the same period. It is a welcome development that the literacy gap between the general population and SC/ST population is narrowing down.
IX. LITERACY RATE OF MALE AND FEMALE ALL SOCIAL GROUPS, SC AND ST POPULATION
[image:6.612.76.540.238.449.2]The details of literacy rate of all social groups and SC and STs are presented in below Table 4.
Table 4
Literacy Rate of male and female All Social Groups, SC and ST Population (1961-2011) (Percentage)
Year
All Social Groups SC ST
Male Female Total Male Female Total Male Female Total
1961 40.4 15.35 28.3 16.96 3.29 10.27 13.83 3.16 8.53
1971 45.96 21.97 34.45 22.36 6.44 14.67 17.63 4.85 11.30
1981 56.38 29.76 43.57 31.12 10.93 21.38 24.52 8.04 16.35
1991 64.13 39.29 52.21 49.91 23.76 37.41 40.65 18.19 29.60
2001 75.26 53.67 64.84 66.64 41.9 54.69 59.17 34.76 47.10
2011 80.89 64.64 72.99 75.17 56.46 66.07 68.53 49.35 58.96
Source: Registrar General of India reproduced in Statistical profile of Scheduled Tribes in India 2013,Ministry of Tribal Affairs Statistics Division Government of India Shastri Bhavan New Delhi.p.164.
It can be seen from the Table 4 that, details of literacy rate of male and female all social groups, SC and STs Population during the period from 1961to 2011. The male literacy rate of SCs increased to 75.17 percent (2011) from 16.96(1961) it was in female 56.46 per cent and 3.29 per cent and in the case of STs 68.53 per cent from 10.27 per cent of male and 49.35 per cent 13.83 per cent of female during the above said period. The literacy rate of general population increased to 80.89 per cent of from 40.4 per cent of male and 64.64 percent from 15.35 per cent of female respectively.
X. MAJOR FINDINGS
A.Based on the data some of the important major findings have been made as under:
1) There is increasing trends among SC and ST population during the various Census periods in India.
2) The Gross enrolment of SC and STs girls and boys were found increasing trend at primary, Upper primary, Elementary levels
but as compared to general population upper primary and secondary level STs girls were low.
3) In the level of I to X the enrolment of SC and STs higher than general population. It was in senior secondary level of SC boys
and STs both boys and girls are low as compared general population.
4) The enrolment up to I to XII level among these categories registered higher than the all categories.
5) The Status of higher education levels the enrolment of SC and STs are worsen as compared general population. It was 15.1
percent of SCs boys and girls and 11 percent of boys and girls in STs, in general population 21.1 percent of boys and girls enrolled.
registering an increase of 54.57 percentage points. The literacy rate for the general population increased from 28.3 per cent to 74.04 per cent in the same period. It is a welcome development that the literacy gap between the general population and SC/ST population is narrowing down.
7) The literacy rate of male and female of all social groups, SC and STs was found increasing trend during the period from
1961to 2011. It is found that, the literacy rate of SC and STs narrowing down but as compared to general population there is gap.
XI. SUGGESTIONS
There is a need for the involvement of STs girls in upper primary, secondary and senior secondary level involvement of both SC and STs is the urgent need for the inclusion of education by providing various incentives in India. There is urgent need to effectively and efficiently implementation of higher education system by involvement of SC and STs in the country. Government should take various steps by creating awareness about the need for educational inclusion of SC and STs those who are excluded from the educational facilities There is need to more incentives on higher education among SC and STs in the process educational inclusion of SC and STs. Government should create more awareness by active participation of these marginalized sections in the remote areas.
XII.CONCLUSION
Scheduled Caste and Scheduled Tribes have been considered as the weaker sections of the Indian society. Human development indicators are much lower for SC and STs. As per the enrolment SC and STs in different levels of education in India was found to be increasing trend but as compared to general population in the upper, secondary and in senior secondary level there is gap. In the higher educational level the enrolment of SC and STs found to be increasing trend but as compared to the rest of the population, there is wide gap. Hence, there is a need continuous and intensive efforts are required to minimize this gap from the society. In the present day situation, one can see a tough competition in the world, India is not an exception. The SC and STs, being marginalised groups are suffering from educational facility, economic inequality especially in income distribution. To minimise the gap between rich and poor sections in the society, there is an urgent need to implement government programmes effectively and efficiently in the remote areas. Hence, both the Central and State governments should stimulate the efforts to reach the deprived sections of the society and bring about active participation to them in the development process by providing skillful educational inclusion to achieve faster inclusive growth in the near future.
REFERENCES
[1] Annapoorani, R. and Krithiga, K. (2011). “Tribal Education with Reference to Irulas”, Southern Economist, Vol. 50, No. 14. [2] Das, B.C. (2009). “Tribal Education Trends and Future Scenario”, Regal Publications, New Delhi.
[3] Gadadhara Mohapatra and Kiran Sharma (2013). “Social Action”, A Quarterly Review of Social Trends, Vol. 63, No. 1.
[4] Kalaiselvan and K. Maheswari (2014). “A Study on Exclusion and Inclusion of Dalits in Education”, IOSR Journal Of Humanities And Social Science (IOSR-JHSS), Vol. 19, Issue 5.
[5] Malavika Karlekar (1983). “Educational Experience of Scheduled Castes and Tribes”, Economic and Political Weekly, Vol. 18, No. 3.
[6] Neera Goutam (2014). “Education of Scheduled Tribes in India : Schemes and Programmes”, Edutracks, A Monthly Scanner of Trends in Education, Vol. 13, No. 12.
[7] Osmani, S.R. (2008).*”The Demands of Inclusive Growth: Lessons from South Asia”, The Pakistan Development Review, Vol. 47. [8] Raju Narayana Swamy (2010). “Ministry of Rural Development”, Kurukshetra, Vol. 59, No. 7.
[9] Snehalata Panda (2015). “Health Status of Tribes and New Initiatives”, Kurukshetra, Ministry of Rural Development, Vol. 63, No. 9. [10] Tarun Bikash Sukai (2010). “Tribal Development in India”, Kurukshetra, Vol. 59, No. 1.