Statistical Assessment of Indore Brts
Aditya kushwah1, Akshat man gupta2, Yogesh rajput3, Pranay kumar4 1
B.tech student, Department of Civil Engineering, SRM IST, Delhi NCR campus, Ghaziabad, India1 2
B.tech student, Department of Civil Engineering, SRM IST, Delhi NCR campus, Ghaziabad, India2 3
Associate professor, department of civil engineering, SRM IST, Delhi NCR campus, Ghaziabad, India3 4
Associate professor, department of civil engineering, SRM IST, Delhi NCR campus, Ghaziabad, India4
Abstract: Mass transit system is the key issue in present scenario due to the increasing growth rate in urban areas. Indore being the industrial and educational hub becomes an epicenter of opportunities which in turn attracts great number of migrants and demands for a sustainable transit system. This paper evaluate the performance of BRTS based on several factors of comparison of the BRTS travel time, cost, safety with other private vehicles. Statistical analysis on basis of user review proved that BRTS performs better than other modes of transport and it fulfills its main key objectives i.e. rapid, cost effective and safe journey. Keywords: Bus rapid transit system (BRTS), appraisal study, evaluation of BRTS, statistical review, user satisfaction analysis, performance analysis.
I. INTRODUCTION
Public transport is a critical means by which citizens can effectively access goods and services across the expanse of today’s cities. Bus rapid transit (BRT) has been found to be one of the most cost-effective mechanisms for cities to rapidly develop a public transport system that can achieve a full network as well as deliver a rapid and high quality service. Indore city being the industrial and educational hub attracts huge number of migrants from all over the state.
The network of roads in the city does not meet the required demand of traffic due to the increasing population of the city. To solve this problem there was a need of mass transit system and so BRTS was planned to meet the travel requirement over the entire city. Bus rapid transit (BRTS) is a high-quality bus-based system that delivers fast, comfortable, and cost effective urban mobility through the provision of segregated right-of- way infrastructure, rapid and frequent operation, and excellence in marketing and customer service.
The main planned objectives of BRT were safe, cost effective and rapid journey. Indore is the economical capital of the state with the rapidly increasing population. The travel demand on public transport system by 2025 will be 2.75 million trips per day. With an estimated average trip length pf 6.02 km. With the limited space in the parameter of city it is the need of today to manage the available resources and make the potential use of it.
II. OBJECTIVES
BRTS is constructed on the busiest route of the city in order to reduce the traffic congestion and delay in journey along the route and improve the quality of travel.
The present study is carried out with following objectives:
A. To assess the performance of existing BRT system within the study area.
B. Analyze user satisfaction based on a survey for services provided by the BRT system
C. Recommend appropriate measures to convey more commuters in order to reduce the usage of private vehicle along the BRTS route.
III. METHODOLOGY
In order to meet the stated objective following methodology has been proposed
User satisfaction and level of service approach is used to check the performance of BRT system. Authors carried out a user survey through questionnaire survey from iBus passengers.
It sought information on travel time, travel cost, connectivity, and safety and security parameters. An on board survey has been conducted to compare the travel time, cost of travel and speed analysis of BRTS busses with other commercial vehicles and private vehicles.
IV. SITE INTRODUCTION
[image:3.612.216.422.123.307.2]In order to evaluate the performance of the ab road pilot corridor was selected as the study area which is 11.3 km long with 22 stations located 500m to 700m apart from each other.
Fig. 1 Ab road corridor
V. DATA COLLECTION AND ANALYSIS
The process of data collection was carried out in two steps. First was the questionnaire survey that delivers the user satisfaction level of the BRTS and second was the on board survey which helps in analyzing the BRTS bus performance over its route in comparison with the other modes of transport.
A. Questionnaire Survey
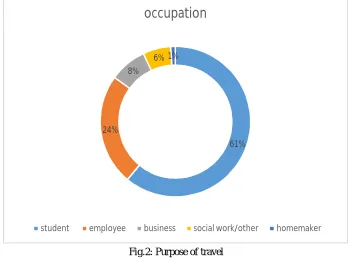
In order to check the performance of BRTS based on user satisfaction the data collected through questionnaire survey from iBus passengers. Special care was taken to randomize the questionnaire distribution process in order to eliminate any reviewer bias. . A total of 5000 individual replies were collected for this study.It is necessary to understand the purpose of trips that are generated over the route which forms the base of providing any transport facility.
Fig.2: Purpose of travel
Passenger safety and security were considered at the bus stop and in the vehicles and the result is shown in figure. More than 86% of the commuters find BRTS safe.
61% 24%
8%
6% 1%
occupation
[image:3.612.130.484.437.696.2]Fig.3: user satisfaction w.r.t. safety parameters Fig.4: user satisfaction w.r.t. fare
B. Fare
The overall customer satisfaction related to the cost of travelling via ibus is shown in the figure. It has been found that the majority of the passengers i.e. 92% are satisfied with the fare charged by the iBus.
C. Connectivity
The user rating for the connectivity of BRTS with the other transport system at various interchanges are shown in figure and majority of the commuters are satisfied with the connectivity of the BRTS.
Fig.5: user satisfaction w.r.t. connectivity of BRTS
D. On Board Survey
This analysis producesa detailed idea regarding the priority given by passenger to BRTS and other commercial vehicles and private vehicles by direct comparison of various parameters between BRTS and other commercial and private vehicles. Fare details: The result of this survey show that fare of auto rickshaw and private vehicle is higher than BRTS between each stop. Fig 6 shows comparison between different modes of transport.
57% 29%
14%
FOR children,aged and ladies, iBus
is:-extreamly safe safe unsafe
21%
71% 8%
Indicate your satisfaction with iBus fare
Extreamly satisfied satisfied unsatisfied
8%
71% 21%
connectivity
Fig.6: Fare comparison for different mode of transport
The other objective of BRTS is rapid service and so a speed survey was carried out between each BRTS stop of BRTS buses and auto/private vehicle/other commercial vehicle. The result show that at the initial stops the speed of auto and private vehicle is higher in both peak and non-peak hours, whereas during peak hours the speed of auto and private vehicle is reduced at the mid-block section of the BRTS corridor and is almost equal to the speed of the BRTS busses.
Fig.7: speed comparison of different mode of transport during peak and non-peak hours
E. Journey Time Detail
For comparison of journey time the data collected was presented in graphical form where the time in minutes is represented on the vertical axis. The journey time of BRTS bus does not include the boarding and alighting time.When the journey time was analyzed, it was found that at every stop BRTS buses takes less time to travel than auto rickshaw and private vehicles during both peak and non-peak hours. It was observed that during peak hours there is a marginal difference in the journey time of BRTS busses and auto rickshaw and private vehicle.
0 5 10 15 20 25 30 35 ru p e es stops
fare detail
brts other commercial/auto private vehicle
0 5 10 15 20 25 30 35 40 45 sp ee d in k m p h stops
Speed analysis
(non peak hour)
brts auto/private vehi./other commercial vh.
0 5 10 15 20 25 30 35 40 sp ee d in k m p h stops
Speed analysis
(peak hour)
Fig.8: journey time comparison for different modes of transport during peak and off peak hours
This survey analyzes the boarding and alighting pattern of passengers at every stop which helps in understanding the usage ofevery stop. The graph represents the no. of passengers boarding and alighting at every stop where it is observed that the maximum movement of passengers is at the three major intersection i.e. vijaynagar, palasia and bhawarkuan and at some intermediate stops i.e. matagujri, holker subway, aictsl there is hardly any movement of passengers.
. Fig.9: Boarding and alighting details
VI. CONCLUSION
Hence the objective that were planned for the BRTS i.e. Rapid, cost effective and safe transit system have been taken care of and delivered effectively to the passengers while operating the BRTS corridor according to both the surveys (questionnaire and on board survey).
A. The questionnaire survey carried out indicate that about 91% commuters are satisfied by the performance of BRTS.
B. During on board survey it was found that omitting of certain less used stops like matagujri, holkar subway, aictslwill further reduce the travel time and attract more no. of commuters.
C. The operating speed of BRTS busses lower than the auto-rickshaw and private vehicle but due to its segregated lane it maintains the journey time to be lesser than the other modes.
0 5 10 15 20 25 30 35 m in u te s stops
journey time
(Non peak hour)
brts auto/private vh./other commercial vh.
0 5 10 15 20 25 30 35 40 45 50 m in u te s stops
journey time
(peak hour)
brts auto/private vh./other commercial vh.
D. The speed and journey time of BRTS is adversely effected from industry house to geetabhavan this is because of BRTS busses are operated without segregated lane from industry house to plasia intersection
E. Private vehicle holders coming from far side of city to travel along BRTS route seek for parking facility and quick connectivity at the intermediate stops.Overall the present working ab road corridor of the planned BRTS can be termed as a successful measure towards public transport still it does not reduce the congestion at the major intersection and so there is a need of re-planning and proper designing of these intersections. Operating all phases of BRTS in the city could result in more number of passengers and reduce the use of private vehicles and effectively reduce the congestion and pollution in the city.
REFERENCES
[1] AdvaniMukti, Srirama B., Pathan S. K.(2008) - Improvement in Transit service using GIS- Case study of BhavnagarAvailable:http://www.academia.edu/7604699/Improvement_in_Transit_Service_using_GIS__Case_study_of_Bhavnagar _State_TransportDepot [2] JaiswalAnuj, Sharma Ashutosh, Yadu Krishnan (2012),”Potential Of Bus Rapid Transit System: A Case Study Of Ahmedabad”
Available:http://www.technicaljournalsonline.com/ijaers/VOL%20I/IJAERS%20VOL%20I%20ISSUE%20III%20APRIL%20JUN E%202012/169.pdf [3] Agarwal P.K, Sharma Anupama, Singh A. P (2010) an overview on Bus Rapid Transit System, Journal of Engineering Research and studies
[4] Advani, M., and Tiwari, G.2005. “Evaluation of public transport systems: case study of Delhi metro”. Conference held at IIT Kharagpur
[5] Kanishka.R.R et al “Environmental Impact Assessment (EIA) For Bus–Based Rapid Transit System (BRTS) Bhopal, MP, India”. Research journal recent sciences; Vol:1
[6] Rizvi A., Bhandari V, 2014,”Compared Ahmadabad BRT with Delhi metro”, journal of engineering research and studies”.
[7] Velmurugan.S. Evaluating Bus Rapid Transit (BRT) Corridor Performance from Ambedkar Nagar to Mool Chand, Delhi, Final report (2012),CRRI, Delhi [8] J Gurjar, P K Agarwal, P K Jain(2016),Performance Evaluation Of Public Transport System From User Point Of View, International Journal of Advanced