0095-1137/11/$12.00 doi:10.1128/JCM.02302-10
Copyright © 2011, American Society for Microbiology. All Rights Reserved.
Performance of Various Testing Methodologies for Detection of
Heteroresistant Vancomycin-Intermediate
Staphylococcus aureus
in Bloodstream Isolates
䌤
Sebastian J. van Hal,
1,2†* Michael C. Wehrhahn,
1† Thelma Barbagiannakos,
1Joanne Mercer,
1Dehua Chen,
1David L. Paterson,
3and Iain B. Gosbell
1,2Department of Microbiology & Infectious Diseases, Sydney South West Pathology Service-Liverpool Hospital, Locked Bag 7090, Liverpool BC NSW 1871,1Antibiotic Resistance & Mobile Elements Group, School of Medicine, University of Western Sydney,
Sydney,2and University of Queensland Centre for Clinical Research (UQCCR), Brisbane,3Australia
Received 15 November 2010/Returned for modification 20 December 2010/Accepted 6 January 2011
The best screening method for detecting heteroresistant vancomycin-intermediate Staphylococcus aureus
(hVISA) remains unclear. Using population analysis profiling utilizing the area under the concentration-time
curve (PAP-AUC) as the gold standard, we screened 458 consecutive methicillin-resistantS. aureus(MRSA)
bloodstream isolates to determine the most accurate and cost-effective testing strategy to detect the presence of heteroresistance. All isolates were also tested using the macromethod Etest (MET) and glycopeptide resistance detection (GRD) Etest. The MIC was determined by several methods, including standard vanco-mycin Etest, vancovanco-mycin broth microdilution (BMD), and Vitek2 testing. Fifty-five (12%) hVISA and 4 (1%) VISA isolates were detected by PAP-AUC. Compared to PAP-AUC, the sensitivities and specificities of MET,
GRD Etest, BMD (using a MIC cutoff of>2 mg/liter), and standard vancomycin Etest (using a MIC cutoff of
>2 mg/liter) were 89 and 55%, 71 and 94%, 82 and 97%, and 71 and 94%, respectively. Combination testing
increased the overall testing accuracy by reducing the number of false-positive results. Cost was determined predominately by the number of PAP-AUC runs required following a screening assay. The most cost-effective
strategy was BMD (using a MIC cutoff of>2g/ml) as a standalone assay or in combination with PAP-AUC,
provided that BMD testing was batched. GRD Etest remained an alternative, with 71% of hVISA isolates detected. Prevalence influenced both cost and test accuracy, with results remaining unchanged for hVISA prevalences of up to 25%. Implementation of any testing strategy would therefore be dependent on balancing cost with accuracy in a given population and clinical context.
Heterogenous vancomycin-intermediate (heteroresistant)
Staphylococcus aureus(hVISA) is characterized by the pres-ence of a resistant subpopulation, usually at a frequency of 1 in 106, in an otherwise fully susceptible population (26).
In-creased cell wall thickness is a consistent feature of these isolates (11).In vitro, it has been demonstrated that these isolates emerge from vancomycin-sensitive Staphylococcus aureus(VSSA) isolates under appropriate selection pressure (6).
Subsequent to its first description in Japan in 1997 (8), hVISA has been reported worldwide, with the first Australian isolates reported in 2001 (24). The prevalence of hVISA varies worldwide, with rates dependent on multiple factors. These include testing methodologies employed, patient populations tested, and the source of the original Staphylococcus aureus
isolates selected (e.g., infection versus colonization isolates) (20). In Australia, hVISA represents approximately 9 to 13% of all methicillin-resistantS. aureus(MRSA) bloodstream iso-lates (3, 9).
The clinical significance of these isolates remains uncertain.
Vancomycin treatment failures have been associated with hVISA infections (2, 3, 24). In addition, these isolates have been associated with high bacterial loads and persistent bac-teremia (7, 13, 15). Despite these associations, no study has detected worse outcomes with hVISA infections than with infections with susceptible isolates.
The optimal laboratory detection of hVISA remains unclear (10). Many of the traditional susceptibility platforms prove unreliable because the inocula used are below the required threshold to detect resistant subpopulations (10, 26). A mod-ified population analysis profile method using the area under the concentration-time curve (PAP-AUC) is considered the gold standard and most reliable method (25). However, PAP-AUC is very labor-intensive and time-consuming, which limits its use. As a consequence, several screening assays, including the macromethod Etest (MET) and glycopeptide resistance detection (GRD) Etest, have been developed (10, 22, 23). Controversy remains, however, regarding which testing algo-rithm to use for the accurate detection of hVISA. A recent review attempted to address this question and suggested using either a laboratory-directed approach, utilizing the vancomycin broth microdilution (BMD) MIC, MET, GRD Etest, and/or PAP, or a clinically directed approach based on treatment failure, defined as persistent bacteremia despite adequate van-comycin trough levels (10).
We therefore undertook this study to determine the utility of various testing strategies, the accuracy of testing algorithms,
* Corresponding author. Mailing address: Department of Microbi-ology & Infectious Diseases, Liverpool Hospital, Locked Bag 7090, Liverpool BC, NSW 1871, Australia. Phone: 61 2 98285163. Fax: 61 2 98285129. E-mail: [email protected].
† S.J.V.H. and M.C.W. contributed equally to the preparation of the manuscript.
䌤Published ahead of print on 26 January 2011.
1489
on May 16, 2020 by guest
http://jcm.asm.org/
and the most cost-effective approach to detecting hVISA in patients with MRSA bacteremia, using PAP-AUC as the gold standard.
(This work was presented in part at the 50th Interscience Conference on Antimicrobial Agents and Chemotherapy, Bos-ton, MA, 12 to 15 September 2010 [21].)
MATERIALS AND METHODS
Isolate selection.All stored (⫺80°C) consecutive nonduplicate MRSA blood-stream infection (BSI) isolates from Liverpool Hospital, Sydney, Australia, dur-ing the period 1997 to 2008 were included in the study. Retrieved isolates were subcultured twice for 48 h on horse blood agar (HBA) prior to testing. For each patient episode, the initial isolate was examined. Multiple isolates from the same patient were included if these isolates represented (i) a new BSI episode, defined as an episode occurring more than 14 days after the initial isolate; and/or (ii) a
persistent BSI episode, defined as a positive blood culture isolate occurring⬎3
days and⬍14 days after the initial isolate.
All runs included the following appropriate negative and positive controls: Mu3 (ATCC 700698; hVISA), Mu50 (ATCC 700699; VISA), and a
vancomycin-sensitiveStaphylococcus aureusstrain (ATCC 29213). All testing results were
read by 2 independent scientists. Discordant results between scientists were resolved by a third scientist, with 2 similar readings accepted as the true result.
Laboratory methods. (i) PAP-AUC ratio.PAP-AUC was performed on all isolates as previously described (23). Briefly, following an overnight culture in brain heart infusion (BHI) broth (BBL, Becton Dickinson, MD), serial dilutions of the isolate were inoculated onto BHI agar (BBL, Becton Dickinson, MD)
plates containing increasing vancomycin concentrations (0 to 8g/ml) and
in-cubated for 48 h (in air at 35°C). All subsequent colonies were counted and plotted against the vancomycin concentration. Isolates were classified as hVISA or VISA if the ratio of the AUC of the test strain to that of Mu3 (ATCC 700698)
was 0.9 to 1.3 or⬎1.3, respectively (23, 25). PAP-AUC runs with results close to
the cutoff (AUCs of 0.8 to 1) were repeated.
(ii) Vancomycin BMD.Vancomycin BMD MICs were determined according to CLSI criteria (4). In brief, isolate suspensions prepared in Mueller-Hinton II broth (MH II; cation adjusted) (BBL, Becton Dickinson, MD) were serial diluted
from a starting concentration of 1⫻106
CFU/ml with increasing concentrations
of vancomycin (0.25 to 32g/ml). Following 24 h of incubation at 35°C in air, the
MIC was recorded as the concentration of the first well with complete inhibition of growth by the naked eye. Since BMD is not a routine test in our laboratory,
the test was repeated for a subset of isolates (n⫽137, including all hVISA
isolates [according to PAP-AUC results]) with high MICs (⬎1g/ml) to
deter-mine the reproducibility of our results.
(iii) MET.Modified Etests were performed according to the manufacturer’s
instructions (AB Biodisk, Solna, Sweden). Briefly, 200l of a suspension at a 2
McFarland standard (prepared in BHI broth) was inoculated onto a 90-mm BHI agar plate and swabbed evenly. Vancomycin and teicoplanin Etest strips were applied to the dry agar surface and read after an incubation of 48 h at 35°C in air.
The test was considered positive if (i) the teicoplanin MIC wasⱖ12 mg/liter or
(ii) the teicoplanin MIC wasⱖ8 mg/liter and the vancomycin MIC wasⱖ8
mg/liter. METs with discordant results compared to the gold standard were repeated.
(iv) GRD Etest.The GRD Etest (AB Biodisk, Solna, Sweden) was performed according to the manufacturer’s instructions. Briefly, a saline suspension at a 0.5 McFarland standard was inoculated onto MH plus 5% blood agar plates (BBL, Becton Dickinson, MD) and incubated for 48 h at 35°C in air. Isolates were
con-sidered GRD positive if the MIC of vancomycin or teicoplanin wasⱖ8g/ml. GRD
Etests with discordant results compared to the gold standard were repeated.
(v) Vancomycin Etest.The vancomycin Etest MIC was determined according to the manufacturer’s instructions (AB Biodisk, Solna, Sweden). Briefly, a saline sus-pension at a 0.5 McFarland standard was inoculated onto MHA (BBL, Becton Dickinson, MD) and incubated for 24 h at 35°C in air. The MIC was determined as the point at which the growth inhibition ellipse intersected the Etest strip.
(vi) Vitek2 testing.Determination of the MIC by Vitek2 testing (AST-P579
Gram-positive susceptibility card; bioMe´rieux, Inc., Durham, NC) was
per-formed for all isolates according to the manufacturer’s instructions.
Statistical analysis, multiple testing strategy, cost-benefit analysis, and im-pact of disease prevalence.The chi-square test was used for categorical data, using SAS, version 9.2, for Windows (SAS Institute, Cary, NC). All testing was compared to PAP-AUC as the gold standard. Testing accuracy was determined
by the following equation: accuracy⫽(number of true negative results⫹
num-ber of true positive results)/numnum-ber of tested isolates. Cost-benefit analyses and multiple testing strategies were compared using an algorithm adapted from the work of Crobach et al. (5) (Fig. 1), with test accuracy derived by the following
equation for a given prevalence: accuracy⫽{(sensitivity of test 1⫻sensitivity of
test 2⫻prevalence)⫹(1⫺prevalence)⫻[specificity of test 1⫹(1⫺specificity
of test 1)⫻(1⫺specificity of test 2)]}⫻100. The impact of disease prevalence
on single-test accuracy was calculated using the following equation: accuracy⫽
[sensitivity⫻prevalence⫹(1⫺prevalence)⫻specificity]⫻100.
RESULTS
Four hundred seventeen MRSA BSI cases were identified over the 12-year study period (Table 1). One hundred fifty-two cases had a subsequent blood culture after the initial blood culture (⬎3 and ⬍14 days after the initial blood
FIG. 1. Application of a two-step algorithm to test 10,000 isolates with a population hVISA prevalence of 10%. This resulted in a testing accuracy of 97.8% [(828⫹8,955)/10,000] based on the following equation: accuracy⫽(total number of true positive samples⫹total number of true negative samples)/total number of samples tested. (Adapted from reference 5 with permission of the publisher.)
on May 16, 2020 by guest
http://jcm.asm.org/
culture bottle), of which 41 (27%) were positive for MRSA. Population analysis profiling of all 458 isolates identified 55 (12%) hVISA and 4 (1%) VISA isolates. The 4 VISA iso-lates were excluded from the remaining analysis. The rates of hVISA prevalence varied widely throughout the 12 years, with a biphasic pattern (Table 1).
hVISA isolates were detected in the initial blood culture in 93% (51/55 isolates) of cases, with the remaining 4 hVISA isolates confirmed with the subsequent blood culture only. The hVISA phenotype was stable, with no reversion to VSSA de-tected for hVISA infection episodes with repeat blood cul-tures.
Persistent bacteremia occurred in 39% (7/18 episodes) of hVISA infection episodes, compared to 25% (34/134 episodes) of VSSA infection episodes (thePvalue for the difference was not significant). Although limiting hVISA testing to these iso-lates would increase the prevalence to 17% (7/41 isoiso-lates), the
overall effect would be small and would underestimate the total hVISA burden.
Vancomycin MICs determined by broth microdilution, stan-dard Etest, and Vitek2 testing were determined for all isolates. A correlation between heteroresistance and MIC existed, irre-spective of the method used. The likelihood of detecting hetero-resistance increased with higher MICs (Fig. 2) (P⬍0.001).
The sensitivity, specificity, negative and positive predictive values, and testing accuracy relative to PAP-AUC as the gold standard were determined for the various methods, including using various MIC cutoffs (Table 2). Vancomycin broth mi-crodilution using a MIC cutoff of ⱖ2 g/ml resulted in the highest specificity (97%) and was the most accurate test, giving an hVISA prevalence of 12%. Decreasing the MIC cutoff in-creased the testing sensitivity, with a corresponding decline in specificity and test accuracy. The GRD Etest performed sim-ilarly to a standard Etest using a MIC cutoff ofⱖ2g/ml, with an accuracy of 91.2%. Although the macromethod Etest was one of the more sensitive tests (89%), it had a low specificity and was thus the least accurate assay in determining the pres-ence of heteroresistance. The low sensitivity and accuracy of the Vitek method precluded using this method for hVISA detection, and no further cost or performance analysis was done for this method.
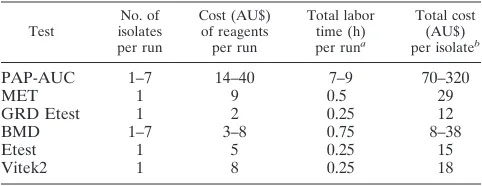
The cost estimate and labor time required for each of the different testing methods are shown in Table 3. For PAP-AUC and BMD, costs of consumables declined with increased num-bers of samples tested, with an optimal run size of 7. Since costs and labor times were prohibitive for single PAP-AUC and BMD tests, the remaining calculations are for batched testing using the optimal run size (i.e., 7).
To increase overall accuracy and to determine the most cost-effective testing strategy, multiple testing algorithms were evaluated (Fig. 1). Only testing algorithms that resulted in an overall accuracy of ⱖ90% and detected more than 70% of hVISA isolates are presented in Table 4. Regardless of the number of tests included, overall sensitivity (i.e., the
[image:3.585.43.282.90.239.2]percent-FIG. 2. Proportions of hVISA isolates detected by different methods of vancomycin MIC determination. BMD, broth microdilution; Etest, standard Etest.
TABLE 1. Numbers of MRSA BSI episodes and hVISA isolates and hVISA frequencies over a 12-year span
Period
No. of episodes
Total no. of isolates
No. of hVISA isolates
% hVISA isolates MRSA
BSIa
Episodes with repeat blood
culturesb
Episodes with subsequent
positive blood culture
1997–1998 19 5 0 19 0 0
1999–2000 52 17 2 54 3 5.5
2001–2002 80 26 2 82 28 34.1
2003–2004 79 20 3 82 6 7.3
2005–2006 83 39 17 100 15 15
2007–2008 104 45 17 121 3 2.4
Total 417 152 41 458 55 12
a
Multiple isolates from the same patient were included if these isolates
rep-resented a new bacteremic episode, defined as occurring⬎14 days after the
initial isolate.
b
Repeat cultures were taken⬎3 days and⬍14 days after the initial isolate.
on May 16, 2020 by guest
http://jcm.asm.org/
[image:3.585.135.450.504.703.2]age of hVISA isolates detected) was determined predomi-nantly by the sensitivity of the initial test. In contrast, overall testing accuracy was determined predominantly by the speci-ficity of the final assay. Since PAP-AUC was the most expen-sive test, the addition of PAP-AUC to any other test increased the cost and labor time required. However, this corresponded with an increase in overall accuracy by effectively differentiat-ing true positive results from false-positive results. Of all the testing strategies analyzed, BMD using a MIC cutoff of ⱖ2 g/ml was the most cost-effective single test (11% of PAP-AUC cost), with 82% of hVISA isolates detected. The addition of PAP-AUC following a positive BMD run (using a MIC cutoff ofⱖ2g/ml) was the most effective combination. For laboratories that do not have access to BMD or PAP-AUC, testing using the GRD or standard Etest (with a MIC cutoff of
ⱖ2g/ml) will give the highest predictive value for a reason-able cost (Treason-able 4).
Both accuracy and cost were codependent on hVISA prev-alence. Thus, we undertook a sensitivity analysis of testing accuracy to determine whether our findings changed with dif-fering prevalence rates (Fig. 3). Tests with higher sensitivities were more accurate with increasing prevalences, while tests with higher specificities became less accurate. Although thresholds existed at which certain tests were more accurate than others, our findings remained unchanged for hVISA prev-alences between 5 and 25%.
One hundred thirty-seven (30%) isolates had repeated BMD testing, with 99% (135/137 isolates) reproducibility. Sim-ilarly, 6% (29/454 tests) of all PAP-AUC tests were repeated
and represented PAP-AUC results of between 0.8 and 1.1. Although the AUC varied by a mean of ⫾0.1, 90% (26/29 classifications) of the original PAP-AUC classifications were reproducible. Repeat testing of samples with discordant GRD Etest and MET results was performed, with overall agreement with the original discordant result in 99% of cases for both methods.
DISCUSSION
Screening for heteroresistance remains difficult, as no opti-mal laboratory approach has been determined. Our study, con-taining the largest number of consecutive MRSA bloodstream isolates categorized by the PAP-AUC gold standard, provides useful insights into the utility of the various proposed testing algorithms (10). Furthermore, the overall prevalence of hVISA (12%) detected was sufficiently high to make assessment of the various screening assays possible.
A clinically directed approach limiting testing to high-risk patients would underestimate the overall hVISA burden. An alternate strategy is therefore required if documentation of the total burden is necessary. For patient management, this may not be essential, as hVISA isolates in less severe infec-tions are not associated with significantly worse clinical out-comes (9, 20).
A laboratory-directed approach, in contrast, significantly im-proves the ability to determine the hVISA burden. However, no single test was accurate enough compared to PAP-AUC. The GRD Etest sensitivity (74%) was lower than those in other published reports (89 to 93%) (12, 27). Similarly, the specificity of MET (54%) in our study was significantly lower than those in previous reports (88 to 96%) (12, 22, 27). Reasons for these differences are unclear and may reflect specific MRSA subtype characteristics. However, recent MET and GRD Etest assess-ments performed on consecutive clinical isolates showed sig-nificantly lower sensitivities (44% to 69%) and specificities (48% to 98%) (1, 17, 18) than those in previous laboratory-characterized evaluations. This suggests that some of these differences may reflect hVISA phenotype instability (22).
[image:4.585.44.541.82.180.2]The proportion of hVISA isolates detected, similar to the case in other studies, increased with higher MICs, irrespective of the testing method (14, 16, 19), and thus MIC cutoffs were evaluated by method to determine appropriate screening as-says. An Etest using a MIC cutoff of ⱖ1.5 g/ml had the
TABLE 2. Comparison of hVISA detection methods to PAP-AUC at hVISA prevalence of 12%c
Method
(MIC cutoff关g/ml兴)
No. of isolatesa
Sensitivity (%) Specificity (%) NPV (%) PPV (%) % Accuracyb
hVISA (TP⫽55) VSSA (TN⫽399)
Etest (ⱖ1.5) 50 263 91 66 98 27 69
BMD (ⱖ1.5) 49 335 89 84 98 43 85
MET 49 218 89 55 97 21 59
BMD (ⱖ2) 45 388 82 97 97 80 95
Etest (ⱖ2) 39 375 71 94 96 62 91
GRD Etest 39 375 71 94 96 62 91
Vitek2 (ⱖ2) 14 382 25 96 90 45 87
a
A total of 454 isolates were examined (4 VISA isolates were excluded).
b
Accuracy⫽(TP⫹TN)/total number of isolates tested (454 isolates).
c
TP, number of true positive results; TN, number of true negative results; NPV, negative predictive value; PPV, positive predictive value; BMD, vancomycin broth microdilution; GRD Etest, glycopeptide resistance detection Etest; MET, macromethod Etest.
TABLE 3. Labor times and costs for hVISA detection by various testing methods
Test
No. of isolates per run
Cost (AU$) of reagents per run
Total labor time (h)
per runa
Total cost (AU$)
per isolateb
PAP-AUC 1–7 14–40 7–9 70–320
MET 1 9 0.5 29
GRD Etest 1 2 0.25 12
BMD 1–7 3–8 0.75 8–38
Etest 1 5 0.25 15
Vitek2 1 8 0.25 18
a
Labor time includes setup, result reading, and interpretation.
b
Total cost per isolate⫽ 关(reagent cost⫹labor cost关at AU$40/h兴)⫻time兴/
number of isolates per run. Cost ranges are representative of 1 to 7 isolates per run. Costs are quoted in Australian (AU) dollars.
on May 16, 2020 by guest
http://jcm.asm.org/
[image:4.585.42.283.600.693.2]highest sensitivity (91%) but was associated with a test accu-racy of 69%. In contrast, vancomycin broth microdilution using a MIC cutoff of 2g/ml was the most accurate test (95%) but had a corresponding decline in sensitivity. Including cost as part of the analysis, BMD was the most cost-effective strategy. However, this method requires batch testing, which may be infrequent in settings with a low MRSA prevalence and may prompt the use of the GRD Etest as a suitable alternative test. An alternative strategy is to employ a 2- or 3-step combina-tion testing algorithm. Although combinacombina-tions are able to in-crease the overall accuracy of testing by reducing the number of false-positive results, the percentage of hVISA isolates de-tected does not increase and is determined by the initial test. In assessing cost, the highest cost and most labor time are asso-ciated with PAP-AUC; thus, decreasing or eliminating the need for PAP-AUC significantly impacts the overall cost and
labor required. Among the testing strategies examined, a MET screening assay followed by PAP-AUC was similar in cost to PAP-AUC (91% of PAP-AUC cost) and thus would negate MET as a viable screening assay.
Both accuracy and cost are dependent on the prevalence of hVISA, with our findings remaining unchanged for hVISA prevalences of up to 25%. Application of our results should be instituted only with knowledge of local hVISA epidemiology. The optimal choice of testing strategy for a given institution is thus dependent on balancing the prevalence and required rate of hVISA detection against the cost and labor required. In our opinion, the combination of BMD (using a MIC cutoff ofⱖ2 g/ml) followed by PAP-AUC is the most cost- and time-effective strategy. Alternatively, if detection of hVISA is criti-cal, despite increasing the cost, BMD using a MIC cutoff of
ⱖ1.5g/ml followed by PAP-AUC is the testing strategy to
[image:5.585.135.448.509.705.2]FIG. 3. Sensitivity analysis of testing accuracies sorted by hVISA prevalence. BMD, broth microdilution; Etest, standard Etest. The GRD Etest was equivalent in performance to the standard Etest using a MIC cutoff ofⱖ1.5g/ml.
TABLE 4. Performance costs and labor times required for various testing strategies to test 454 MRSA isolates for the presence of hVISA at a heteroresistance prevalence of 12%
Test 1
(MIC cutoff关g/ml兴)
Test 2
(MIC cutoff关g/ml兴) Test 3 % Accuracy
a % of hVISA
isolates detected
Total cost (AU$)b
(% of PAP-AUC cost)
Total labor time (h) (% of PAP-AUC time)
PAP-AUC 100 100 32,200 (100) 460 (100)
Etest (ⱖ1.5) PAP-AUC 98.9 91 19,789 (61) 352 (77)
BMD (ⱖ1.5) PAP-AUC 98.7 89 11,501 (36) 193 (42)
MET PAP-AUC 98.7 89 29,145 (91) 520 (113)
BMD (ⱖ2) PAP-AUC 97.8 82 7,598 (24) 121 (26)
BMD (ⱖ1.5) Etest (ⱖ1.5) PAP-AUC 97.7 81 11,360 (35) 188 (41)
BMD (ⱖ1.5) MET PAP-AUC 97.5 79 12,374 (38) 206 (45)
BMD (ⱖ2) Etest (ⱖ1.5) PAP-AUC 96.9 75 8,615 (27) 138 (35)
BMD (ⱖ2) MET PAP-AUC 96.7 73 9,329 (29) 151 (33)
Etest (ⱖ2) PAP-AUC 96.5 71 11,196 (35) 194 (42)
GRD Etest PAP-AUC 96.5 71 9,834 (31) 194 (42)
BMD (ⱖ2) 95.4 82 3,632 (11) 49 (11)
BMD (ⱖ2) MET 93.9 73 5,623 (17) 83 (18)
BMD (ⱖ2) Etest (ⱖ1.5) 93.5 75 4,662 (14) 66 (14)
Etest (ⱖ2) 91.2 71 6,810 (21) 114 (25)
GRD Etest 91.2 71 5,448 (17) 114 (25)
aAccuracy⫽(number of true positive samples⫹number of true negative samples)/total number of samples.
bBMD and PAP-AUC costs are based on 7 samples per run. For multitest strategies, only positive samples from the prior test were tested (Fig. 1).
on May 16, 2020 by guest
http://jcm.asm.org/
use. However, batch testing is required for these cost savings, so this strategy may not be practical in instructing patient management.
Unfortunately, no ideal strategy was found that would reli-ably allow for hVISA testing to be introduced into routine laboratory testing, and thus further research is needed in this area.
This study has several limitations. Since no genetic marker for heteroresistance exists, PAP-AUC is assumed to be the gold standard test for detecting the hVISA phenotype (10). The variability and problems with reproducibility of laboratory testing with respect to heteroresistance are well documented (22). Repeat testing of all isolates may have altered our results. However, this was not detected in the subset of isolates re-tested. hVISA phenotypes are known to be unstable, with the ability to revert to VSSA under various conditions, including isolate passage on vancomycin-free media (22). It is unclear whether storage and subculture of the isolates impacted our results. However, all hVISA MICs were retested, with no phe-notype instability detected. VISA isolates were excluded from the analysis. However, our results did not change if these were considered hVISA isolates (data not shown). Finally, intraob-server variability was not corrected for with multiple operators over the 12-year study period.
In conclusion, we believe that this study contributes to an increasing understanding of detection of hVISA in the current literature. Previously accepted screening methods (MET and GRD Etest) did not perform as well as expected in our study, raising the possibility that they may not be as reliable as pre-viously thought. Based on our data, laboratory implementation of optimal hVISA testing strategies should take into account clinical settings, with the aim of balancing maximum detection and cost. Ongoing research is required to determine better detection methods that are less costly and time-consuming than those currently available, allowing for more widespread laboratory implementation.
REFERENCES
1.Adam, H. J., et al.2010. Detection and characterization of heterogeneous vancomycin-intermediate Staphylococcus aureus isolates in Canada: results from the Canadian Nosocomial Infection Surveillance Program, 1995–2006.
Antimicrob. Agents Chemother.54:945–949.
2.Ariza, J., et al.1999. Vancomycin in surgical infections due to methicillin-resistant Staphylococcus aureus with heterogeneous resistance to
vancomy-cin. Lancet353:1587–1588.
3.Charles, P. G., P. B. Ward, P. D. Johnson, B. P. Howden, and M. L. Grayson.
2004. Clinical features associated with bacteremia due to heterogeneous
vancomycin-intermediate Staphylococcus aureus. Clin. Infect. Dis.38:448–
451.
4.Clinical Laboratory Standards Institute (CLSI).2010. Performance stan-dards for antimicrobial susceptibility testing; 16th informational supplement. CLSI document M100-S20. CLSI, Wayne, PA.
5.Crobach, M. J., O. M. Dekkers, M. H. Wilcox, and E. J. Kuijper.2009. European Society of Clinical Microbiology and Infectious Diseases (ESCMID): data review and recommendations for diagnosing
Clostrid-ium difficile-infection (CDI). Clin. Microbiol. Infect.15:1053–1066.
6.Cui, L., et al.2003. Cell wall thickening is a common feature of vancomycin
resistance in Staphylococcus aureus. J. Clin. Microbiol.41:5–14.
7.Hidayat, L. K., D. I. Hsu, R. Quist, K. A. Shriner, and A. Wong-Beringer.
2006. High-dose vancomycin therapy for methicillin-resistant Staphylococcus
aureus infections: efficacy and toxicity. Arch. Intern. Med.166:2138–2144.
8.Hiramatsu, K., et al.1997. Dissemination in Japanese hospitals of strains of
Staphylococcus aureus heterogeneously resistant to vancomycin. Lancet350:
1670–1673.
9.Horne, K. C., et al.2009. Prospective comparison of the clinical impacts of heterogeneous vancomycin-intermediate methicillin-resistant Staphylococ-cus aureus (MRSA) and vancomycin-susceptible MRSA. Antimicrob.
Agents Chemother.53:3447–3452.
10.Howden, B. P., J. K. Davies, P. D. Johnson, T. P. Stinear, and M. L. Grayson.
2010. Reduced vancomycin susceptibility in Staphylococcus aureus, including
vancomycin-intermediate and heterogeneous vancomycin-intermediate
strains: resistance mechanisms, laboratory detection, and clinical
implica-tions. Clin. Microbiol. Rev.23:99–139.
11.Howden, B. P., P. D. Johnson, P. B. Ward, T. P. Stinear, and J. K. Davies.
2006. Isolates with low-level vancomycin resistance associated with persistent methicillin-resistant Staphylococcus aureus bacteremia. Antimicrob. Agents
Chemother.50:3039–3047.
12.Leonard, S. N., K. L. Rossi, K. L. Newton, and M. J. Rybak.2009. Evaluation of the Etest GRD for the detection of Staphylococcus aureus with reduced
susceptibility to glycopeptides. J. Antimicrob. Chemother.63:489–492.
13.Lodise, T. P., et al.2008. Relationship between vancomycin MIC and failure among patients with methicillin-resistant Staphylococcus aureus bacteremia
treated with vancomycin. Antimicrob. Agents Chemother.52:3315–3320.
14.Musta, A. C., et al.2009. Vancomycin MIC plus heteroresistance and out-come of methicillin-resistant Staphylococcus aureus bacteremia: trends over
11 years. J. Clin. Microbiol.47:1640–1644.
15.Neoh, H. M., et al.2007. Impact of reduced vancomycin susceptibility on the therapeutic outcome of MRSA bloodstream infections. Ann. Clin.
Micro-biol. Antimicrob.6:13.
16.Rybak, M. J., et al.2008. Characterization of vancomycin-heteroresistant Staphylococcus aureus from the metropolitan area of Detroit, Michigan,
over a 22-year period (1986 to 2007). J. Clin. Microbiol.46:2950–2954.
17.Satola, S. W., M. M. Farley, K. F. Anderson, and J. B. Patel.2011. Com-parison of detection methods for heteroresistant vancomycin-intermediate Staphylococcus aureus, with the population analysis profile method as the
reference method. J. Clin. Microbiol.49:177–183.
18.Sun, W., et al. 2009. Prevalence and characterization of heterogeneous vancomycin-intermediate Staphylococcus aureus isolates from 14 cities in
China. Antimicrob. Agents Chemother.53:3642–3649.
19.Tenover, F. C., and R. C. Moellering, Jr.2007. The rationale for revising the Clinical and Laboratory Standards Institute vancomycin minimal inhibitory concentration interpretive criteria for Staphylococcus aureus. Clin. Infect.
Dis.44:1208–1215.
20.van Hal, S. J., and D. L. Paterson.2011. Systematic review and meta-analysis of the significance of heterogeneous vancomycin-intermediate
Staphylococ-cus aureus isolates. Antimicrob. Agents Chemother.55:405–410.
21.van Hal, S. J., D. L. Paterson, and I. B. Gosbell.2010. The presence of vancomycin heteroresistance in methicillin-resistant Staphylococcus aureus bloodstream infections is not associated with increased mortality, abstr. D-157, p. 10. Abstr. 50th Intersci. Conf. Antimicrob. Agents Chemother., Boston, MA. American Society for Microbiology, Washington, DC. 22.Voss, A., et al.2007. A multi-center blinded study on the efficiency of
phenotypic screening methods to detect glycopeptide intermediately suscep-tible Staphylococcus aureus (GISA) and heterogeneous GISA (h-GISA).
Ann. Clin. Microbiol. Antimicrob.6:9.
23.Walsh, T. R., et al.2001. Evaluation of current methods for detection of staphylococci with reduced susceptibility to glycopeptides. J. Clin. Microbiol.
39:2439–2444.
24.Ward, P. B., P. D. Johnson, E. A. Grabsch, B. C. Mayall, and M. L. Grayson.
2001. Treatment failure due to methicillin-resistant Staphylococcus aureus
(MRSA) with reduced susceptibility to vancomycin. Med. J. Aust.175:480–
483.
25.Wootton, M., et al.2001. A modified population analysis profile (PAP) method to detect hetero-resistance to vancomycin in Staphylococcus aureus
in a UK hospital. J. Antimicrob. Chemother.47:399–403.
26.Wootton, M., A. P. MacGowan, T. R. Walsh, and R. A. Howe.2007. A multicenter study evaluating the current strategies for isolating Staphylococ-cus aureus strains with reduced susceptibility to glycopeptides. J. Clin.
Mi-crobiol.45:329–332.
27.Yusof, A., et al.2008. Evaluation of a new Etest vancomycin-teicoplanin strip for detection of glycopeptide-intermediate Staphylococcus aureus (GISA),
in particular, heterogeneous GISA. J. Clin. Microbiol.46:3042–3047.