Technology Forecasting: The Case of Cloud Computing
and Sub-Technologies
Amol C. Adamuthe
Assistant Professor, Dept. ofCSE,
Rajarambapu Institute of Technology Sakharale, MS, India.
Jyoti V. Tomake
M Tech student, Dept. of CSE,Rajarambapu Institute of Technology Sakharale, MS, India.
Gopakumaran T. Thampi
Professor, Dept. of IT,TSEC, Bandra, Mumbai, MS, India
ABSTRACT
Forecasting natural phenomena and cycles of various events of human interest gains importance in the contemporary world. A spurt of research and investigative patents and documentation shows the patronage of the same by mammoth enterprises and competitive governments looking for cost arbitrage for greater market share for their products and processes. Awareness of self-gratifying technologies, product life cycles and products and process innovations having a greater bearings on these nascent and concerted research initiatives in the realm of technology forecasting.
This paper reports a study of the use of number of patents filed as indicators of technological development in the field of cloud computing technology. The relevant data is accessible from US patent office. This paper focuses on trend analysis forecasting techniques to analyze the evolutionary process and the level of maturity of cloud computing technology. Trend projection and logistic growth curve methods are applied for long range forecasting of cloud computing and it‟s sub-technologies. The result shows that the growth of the technologies is fast and except Web 2.0 all technologies have crossed the inflection point.
General Terms
Technology forecasting, computational technologies, trend projections methods.
Keywords
Cloud computing, Growth curves, Technology forecasting, Trend projection.
1.
INTRODUCTION
Cloud computing is the megatrend in the IT world which offers resources and services over the Internet. According to Voas and Zhang [1] cloud computing is the next paradigm after mainframes, personal computers (PC), networked computing, the Internet and grid computing. This new paradigm is quickly attracting a number of customers due to pay per use model, scalability, dynamic resource provisioning etc. According to special report of The Economist in 2008, cloud computing “will undoubtedly transform the information technology (IT) industry. Gartner reported that cloud services across all segments grew 20.8% and will reach 91.4 billion US dollar in 2011 [2]. Infrastructure as a service (IaaS) is the fastest growing segment of public cloud services. IaaS spending will surpass 72 billion US dollar from 2012 through 2016. According to Cisco Global Cloud Index [3], by 2016, nearly two-thirds of all workloads will be processed in the cloud and global cloud IP traffic will account for nearly two-thirds of total data center traffic.
Different researchers have proposed different definitions of technology forecasting (TF). Various researchers see different
meaning of technology forecasting in different disciplines. So a widely accepted definition of TF is not formulated. Technology forecasting refers to purposeful, focused and systematic attempts to understand the potential direction, rate, characteristics technological change. Though imperfect, technology enables better plans and decisions [4]. Dr. Eric Jantz, one of the pioneers in the practice of technology forecasting, once identified over 150 different TF techniques. Coates et al. [5] classified TF methods into nine categories: Expert Opinion, Trend Analysis, Monitoring and Intelligence, Modeling and Simulation, Scenarios, Statistical, Descriptive, Creativity and Valuing / Decision / Economics Methods. In this paper trend analysis techniques are investigated for long range forecasting of cloud computing and it‟s sub- technologies. From the category of trend analysis techniques, trend projections and growth curve method are selected for forecasting. Trend line is one of the extrapolation methods used for medium to long-range forecasting. Trend line is fitted to historical data points and projected for future values. Growth curves are commonly used in technology forecasting. They show the paths of product / technology performance in relation to time or R&D investment. It is a useful tool to describe the inflection points and the limit of improvement of a technology. Growth Analysis is highly quantitative and requires numerical data and uses S-shaped curves. Most used S-shaped curve is logistic curve, is helpful for estimating the level of technological growth (or decline) at each stage in the life cycle and for predicting when a specific technology will reach a particular stage. In this paper, trend line functions and Logistic growth curve method are applied for specific technology forecasting. The main objective of this paper is to find the direction and rate of progress of cloud computing. A group of researchers describes cloud computing as “a technological change brought about by the convergence of a number of new and existing technologies”. This paper also forecast the direction and rate of progress of cloud computing sub-technologies.
The rest of the paper is organized as follows: In Section 2, related work of technology forecasting is described. Cloud computing and it‟s sub-technologies are then explained in Section 3. Section 4 and 5 are about details of trend projection methods and Logistic growth curve respectively. The results and discussion are given in Section 6. It provides details of the dataset, results obtained and discussion of results. Finally, the conclusions of our study are outlined in Section 7.
2.
RELATED WORK
Dubaric et al. [6] reports a study into the use of patent application numbers as indicators of technological development in the field of wind power technology. It shows that patent information can be used with life cycle approach to analyze the evolution and the level of maturity of this technology.
Daim et al. [7] presents the forecasts for three emerging technology areas, fuel cell, food safety and optical storage technologies. Results are presented with integrating the use of bibliometrics and patent analysis into well known technology forecasting tools such as scenario planning, growth curves and analogies. Author demonstrates that technology forecasting results can be improved by integrating multiple methodologies.
Pretorius et al. [8] focused on the forecasting of Computational Fluid Dynamics technology. Techniques such as bibliometric analysis and bass diffusion model are used in this paper to assess the growth rate and market penetration of Computational Fluid Dynamics (CFD) as a technology. Bae et al. [9] describes long term forecasting for RFID technology using bibliometrics analysis and bass diffusion model. Bibliometric analysis and patent analysis provides a way of identifying the possible position of the technology in a technology maturity plane. It is expected that a technology that is under development will see quite a number of articles and papers being published in industry and academic journals. A mature technology on the other hand might see a reduction in the number of papers being published. The paper analyses the number of articles and patents published in the field of RFID in an effort to identify how mature the technology is. Sheikh et al. [10] state that forecasting advanced or emerging technologies by determining their technology diffusion rates is a science and an art because of lack of experiential data. One method to assist in forecasting is data mining and analysis of bibliometric data from a variety of sources such as patents, journal citations and science awards. This information can then be used in well known technology diffusion models such as Fisher-Pry where emerging technologies substitute older ones. Author uses global bibliometric analysis to forecast the growth of advanced or next-generation electronic packaging technologies relying on analogous technology growths.
Intepe et al. [11] investigated the applicability of S-curve to the evolution of 3D TV technology. Results show that 3D TV appears to fit patent data properly. Authors reported that S curve is easy to use and easy to understand. But, proper care needed in parameter selection, measurement. The major limitation of S-curve method is it does incorporate an unpredictable event from alternative technologies which may stop technology to reach its natural limit.
It is difficult to forecast emerging technologies as there is no historical data available. In such cases, researchers reported that use of bibliometrics and patent data has provided useful data for quantitative methods such as growth curve.
3.
CLOUD COMPUTING AND IT’S
SUB-TECHNOLOGIES
This section describes cloud computing, it‟s sub-technologies and relationship between them.
3.1
Cloud Computing
In 1961, a computer scientist, John McCarthy, predicted that “Computation may someday be organized as a public utility.” But due to unavailability of required infrastructure and development models, cloud computing remains in conceptual form for approximately 30 years.
Cloud computing offers its benefits through three types of service or delivery models namely infrastructure-as-a-service (IaaS), platform-as-a-service (PaaS) and software-as-a- Service (SaaS). It delivers its service through four deployment models namely, public cloud, private cloud, community cloud and hybrid cloud. Vaquero et al. [12] listed ten key characteristics of cloud computing – user friendliness, virtualization, Internet centric, variety of resources, automatic adaptation, scalability, resource optimization, pay per use, service SLAs, infrastructure SLAs.
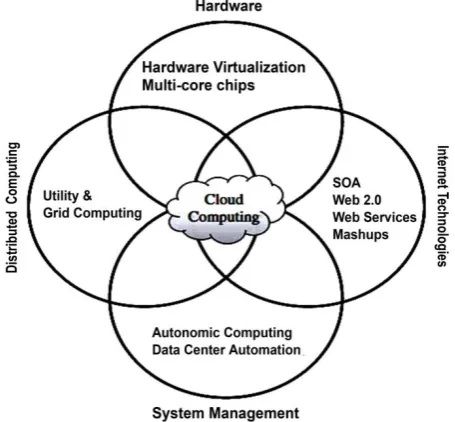
Cloud computing is result of evolutionary development of several different technologies and has characteristics of many preceding operating models and technologies [13], [14]. Skilton [15] describes cloud computing as “a technological change brought about by the convergence of a number of new and existing technologies.” According to Louridas [16], cloud computing “expresses technologies that are reaching maturity after many years of progress, aided by specific market forces.” By observing the advancement of several technologies Rajkumar Buyya et al. [17, ch. 1] investigated the roots of cloud computing. Technologies especially in hardware (virtualization, multi-core chips), Internet technologies (Web services, service-oriented architectures, Web 2.0), distributed computing (clusters, grids) and systems management (autonomic computing, data center automation) contributed to the advent of cloud computing. Figure 1 shows the convergence of technology fields that significantly advanced and contributed to the advent of cloud computing.
Fig 1: Convergence of various advances leading to the advent of cloud computing. (Taken from [17, ch. 1])
[image:2.595.322.550.447.658.2]3.2
Virtualization
Virtualization is important backbone technology for cloud computing. It enables cloud computing technology for infrastructure as service. It utilizes the hardware more efficiently by allowing multiple users to share resources simultaneously. The idea of virtualization of processors, memory, storage, network and I/O devices aims the improvement of data centre infrastructure. Virtualization enables high, reliable deployment mechanisms and management of services by providing on-demand cloning and live migration services [17].
3.3
Distributed Computing
Multiple autonomous computers connected with each other to solve a complex problem. Distributed computing model provides better price to performance ratio because of dividing and assigning the big processes to different systems. But, it causes the wastage of resource and money when there is no big process.
3.4
Utility Computing
The utility computing follows pay per use model. Instead of purchasing, operating and maintaining the resources in-house, organizations can subscribe to an external service provider. The resources may be virtual machine, storage capacity or network. Consumer organization pay only for the hardware and software resources they use.
3.5
Grid Computing
Evolution of Internet in 1990s has significantly changed the computing technologies. In 1999 grid computing come in to existence which uses the facility of Internet and cluster computing. Grid computing combines computers from multiple administrative domains to reach a common goal, to solve a single task and may then disappear. It is analogous to the power grid. Grid computing involves computation in a distributed fashion, which may also involve the aggregation of large-scale cluster computing based systems. The size of a grid may vary from small a network of computer workstations within a corporation to large collaborations across many companies and networks.
3.6
Service Oriented Architecture (SOA)
The purpose of a SOA is to address requirements of loosely coupled, standards-based and protocol-independent distributed computing. In a SOA, software resources are packaged as “services,” which are well-defined, self contained modules that provide standard business functionality and are independent of the state or context of other services [17, ch. 1].3.7
Web 2.0
The advancement of web services enabled the creation of powerful services that can be accessed on-demand and in a uniform way. Aim of Web 2.0 is to enhance creativity, secure information sharing, increase collaboration and improve the functionality of the Web 1.0. Web 2.0 websites typically include some of the features such as search, links, authoring, tags, extensions and signals.
3.8
Autonomic Computing
In the year 2001, IBM presented new version of computing called as autonomic computing. Basic principle behind it is computer systems regulate themselves similar to the way human nervous systems regulates and protects human body. In an autonomic environment, system components (hardware and software) are self-configuring, self-healing, self-optimizing and self-protecting. This new view of computing will
necessitate changing the industry's focus on processing speed and storage to one of developing distributed networks that are largely self-managing, self-diagnostic and transparent to the user.
4.
TREND PROJECTION METHODS
Trend of technology is persistent for long period, often several years duration. In applications like stock markets user may be interested in shorter term trends. Trend line is overall upward or downward pattern. Trend projection methods uses historical data rate to determine the rate of progress of technology in the past and extends it into the future. It is assumed that the factors which affected the past trends will continue to impact in the same known manner.
The use of a linear trend projection function is common. However, sometimes time series exhibit a curvilinear (nonlinear) trend and curvilinear model should be used. In this paper we have tested five trend-line functions, which are as given below.
Linear: It indicates that a linear relationship exists between the variables X and Y. First plot the historical data and draw a "best-fit" straight line through the data. This relationship is governed by the straight line equation.
Y AXB (1) The variable ‘A’ and ‘B’ indicates slope and y-intercept respectively.
Exponential: Historical data is modeled by a function which is a nonlinear combination of the model parameters and depends on one independent variable.
Y e BX (2)
Logarithmic: A logarithmic trendline is a best-fit curved line that is most useful when the rate of change in the data increases or decreases quickly and then levels out. A logarithmic trendline can use negative and/or positive values.
Y A log(X)B (3)
Polynomial: Polynomial regression is a form of linear regression in which the relationship between the independent variable X and the dependent variable Y is modeled as an nth order polynomial. Equation for 2nd order polynomial is as given below.
Y A BX C X 2 (4)
Power Law: It is a functional relationship between two quantities, where one quantity varies as a power of another. Empirical power-law distributions hold only approximately or over a limited range.
Y AX B (5)
5.
LOGISTIC GROWTH CURVE
Growth Curve to predict population growth. Dmitry and Roland [18] stated that Growth curves possess a lot of different names: Logistic curve, Verhulst-Pearl equation, Pearl curve, Richard's curve (Generalized Logistic), S-shaped curve, Gompertz curve, S-curve, S-shaped pattern, Saturation curve, Sigmoid(al) curve, Foster‟s curve, Bass model and many others.
Growth curve method involves fitting a growth curve to historical data and then extrapolating the growth curve beyond the range of the data to obtain an estimate of future values. In Logistic growth model, growth is really slow in the early stage of adoption and becomes faster as product demand approaches the saturation level. It is therefore appropriate to use the logistic model to predict process of technology diffusion. The model for the simple Logistic curve is controlled by three coefficients ‘a’, ‘b’, and ‘L’ is expressed as,
1 L
yt bt
ae
(6)
The most important characteristic of simple logistic model is that it is symmetric about the point of inflection. This feature indicates that the process which will happen after the point of inflection is the mirror image of the process that happened before the point [18].
6.
RESULTS AND DISCUSSION
This section describes the dataset used in experimentation and results obtained using trend projection methods & growth curve method.
6.1
Dataset
This paper focus on cloud computing and it‟s sub-technologies such as virtualization, distributed computing, utility computing, grid computing, autonomic computing, service oriented architecture and Web 2.0. The factors considered for forecasting the each technology change is yearly count of US patents filed. Patents are useful for competitive analysis and technology trend analysis. The dataset for this study is constructed from patents filed at US patent office (http://www.uspto.gov/). To search count of patents following keywords are used in the title field, „virtualization‟, „distributed computing‟, „utility computing‟, „grid computing‟ , „autonomic computing‟, „web 2.0‟, „service oriented architecture‟ and „cloud computing‟.
6.2
Trend Lines
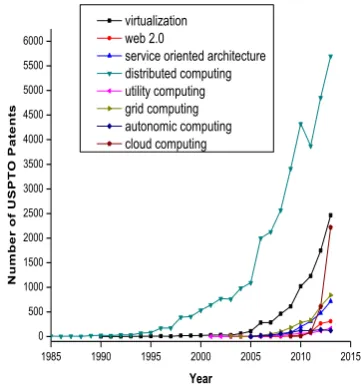
Figure 2 shows the actual US patents for selected technologies. Distributed computing is the oldest sub-technology behind cloud computing. The number of patents filed in distributed computing is more than remaining technologies for all the years.
The Trend line equations such as linear, exponential, logarithmic, polynomial and power law are applied on yearly patent data of selected technologies. The best fitted trend-line is selected using Mean Absolute Error (MAE) calculation method. Table 1 shows the obtained best fitted trend line functions to selected technologies.
1985 1990 1995 2000 2005 2010 2015
0 500 1000 1500 2000 2500 3000 3500 4000 4500 5000 5500 6000
N
u
m
b
e
r
o
f
U
S
P
T
O
P
a
te
n
ts
Year virtualization web 2.0
[image:4.595.332.513.83.278.2]service oriented architecture distributed computing utility computing grid computing autonomic computing cloud computing
[image:4.595.320.532.317.682.2]Fig 2: Actual US patents for selected technologies.
Table 1. Obtained best fitted trend lines to technologies.
Technology Best Fitted Trend Line
Cloud computing Exponential
Virtualization Exponential
Distributed computing Polynomial Utility computing Exponential
Grid computing Polynomial
Service oriented architecture Polynomial
Web 2.0 Polynomial
Autonomic computing Polynomial
1990 2000 2010 2020 2030 2040
-4000 -2000 0 2000 4000 6000 8000 10000 12000 14000 16000 18000 20000 22000 24000 26000 28000 30000 32000
N
u
m
b
e
r
o
f
U
S
P
T
O
P
a
te
n
ts
Year web 2.0
service oriented architecture distributed computing grid computing autonomic computing
Fig 3: Results of best fitted trend line function on US patents for selected technologies.
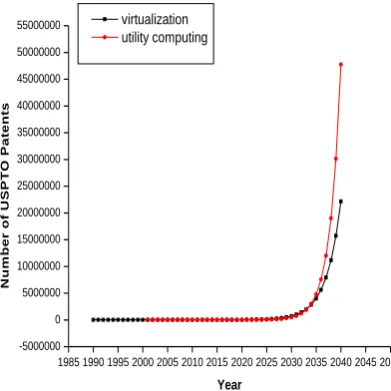
fitted with polynomial trend line of 2nd order. Except autonomic computing, all other technologies shows positive upward trend. The results show that virtualization, utility computing and cloud computing are growing very fast as compared with other technologies.
1985 1990 1995 2000 2005 2010 2015 2020 2025 2030 2035 2040 2045 2050 -5000000
0 5000000 10000000 15000000 20000000 25000000 30000000 35000000 40000000 45000000 50000000
55000000 virtualization
utility computing
N
u
m
b
e
r
o
f
U
S
P
T
O
P
a
te
n
ts
Year
Fig 4: Results of best fitted trend-line function on US patents for virtualization.
2010 2020 2030 2040
-5.00E+023 0.00E+000 5.00E+023 1.00E+024 1.50E+024 2.00E+024 2.50E+024
N
u
m
b
e
r
o
f
U
S
P
T
O
P
a
te
n
ts
Year
cloud computing
Fig 5: Results of best fitted trend-line function on US patents for cloud computing.
6.3
Logistic Growth Curve
In this study cumulative US patent numbers are used for technology forecasting. The number of patents reflects increments in the level of knowledge accumulation in the technology field and helps to improve understanding of that technology.
Figure 6 and 7 shows the actual cumulative US patents for selected computing technologies.
1985 1990 1995 2000 2005 2010 2015 0
5000 10000 15000 20000 25000 30000 35000 40000
C
u
m
u
la
ti
v
e
N
u
m
b
e
r
o
f
U
S
P
T
O
P
a
te
n
ts
Year
[image:5.595.329.529.86.280.2]virtualization grid computing distributed computing
Fig 6: Actual cumulative US patents for virtualization, grid computing and distributed computing.
2000 2005 2010 2015
0 500 1000 1500 2000 2500 3000 3500
C
u
m
u
la
ti
v
e
N
u
m
b
e
r
o
f
U
S
P
T
O
P
a
te
n
ts
Year web 2.0
service oriented architecture utility computing autonomic computing cloud computing
Fig 7: Actual cumulative US patents for selected technologies.
Figure 8 shows forecasted results of computing technologies using logistic growth curve. Distributed computing and virtualization are older technologies. Upper limits for these two technologies is high as compared to other technologies. Virtualization, utility computing and cloud computing shows fast growth rate than other technologies.
[image:5.595.62.258.143.339.2] [image:5.595.332.523.332.529.2] [image:5.595.57.272.394.580.2]1980 1990 2000 2010 2020 2030 2040 2050 2060 2070 0
10000 20000 30000 40000 50000
virtualization web 2.0
service oriented architecture distributed computing utility computing grid computing autonomic computing cloud computing
C
u
m
u
la
ti
v
e
N
u
m
b
e
r
o
f
U
S
P
T
O
P
a
te
n
ts
Year
[image:6.595.56.267.97.260.2]Fig 8: Forecasted results on US patents for selected technologies using logistic growth curve method.
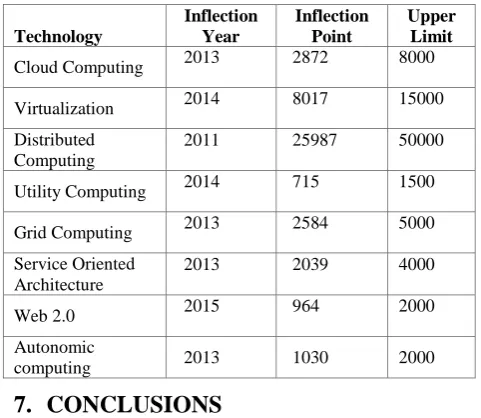
Table 2. Results obtained by logistic growth curve.
Technology
Inflection Year
Inflection Point
Upper Limit
Cloud Computing 2013 2872 8000
Virtualization 2014 8017 15000
Distributed Computing
2011 25987 50000
Utility Computing 2014 715 1500
Grid Computing 2013 2584 5000
Service Oriented Architecture
2013 2039 4000
Web 2.0 2015 964 2000
Autonomic
computing 2013 1030 2000
7.
CONCLUSIONS
In this paper trend projection methods and growth curve method are investigated for forecasting cloud computing and it‟s sub-technologies. US patents data is used as historical dataset for investigation. Results show that polynomial or exponential trend projection methods are best fitted to all the technologies. All technologies except autonomic computing show positive upward trend.
Growth curve results shows that growth pattern of distributed computing, grid computing and virtualization follows a pattern similar to S-curve. Remaining technologies shows very fast growth in early life time. Inflection point of all the technologies is around the year 2013.
8.
REFERENCES
[1] Voas, J. and Zhang, J. 2009. Cloud Computing: New Wine or Just a New Bottle? J. IEEE IT Professional, 11(2), 15-17.
[2] Forecast Overview: Public Cloud Services, Worldwide, 2011-2016, 2Q12 Update. Market Analysis and Statistics. Gartner 2012.
[3] Cisco Global Cloud Index: Forecast and Methodology 2011–2016.
[4] Firat, A. K., Madnick, S. and Woon, W. L. 2008. Technology Forecasting: A Review. Working Paper CISL# 2008-15, MIT.
[5] Coates, V., Faroque, M., Klavins, R., Lapid, K., Linstone, H. A., Pistorius, C. and Porter, A. L. 2001. On the future of technological forecasting. J. Technological Forecasting and Social Change, 67(1), 1 – 17.
[6] Dubaric, E., Giannoccaro, D., Bengtsson, R. and Ackermann, T. 2011. Patent data as indicators of wind power technology development. J. World Patent Information, 33, 144-149.
[7] Daim, T. U., Rueda, G., Martin, H. and Gerdsri, P. 2006. Forecasting emerging technologies: Use of bibliometrics and patent analysis. Technological Forecasting & Social Change, 73, 981-1012.
[8] Pretorius, L., Benade, S. J. and Kruger, S. 2008. Technology Forecasting: The Case of Computational Fluid Dynamics (CFD). In Proceedings of the ICMIT, IEEE.
[9] Bae, J., Seetharaman, K., Suntharasaj, P. and Ding, Y. 2007. Technology Forecasting of RFID by using Bibliometric Analysis and Bass Diffusion Model. IEEE. [10]Sheikh, N., Gomez, F. A., Cho, Y. and Siddappa J.
2011. Forecasting Advanced Electronic Packaging Technologies Using Analysis and Fisher-Pry Diffusion Model. IEEE.
[11]Intepe, G. and Koc, T. 2012. The Use of S Curves in Technology Forecasting and its Application On 3D TV Technology. J. World Academy of Science, Engineering and Technology, 71, 1482-1486.
[12]Vaquero, L. M., Rodero-Merino, L., Caceres, J. and Lindner, M., 2009. A Break in the Clouds. Towards a Cloud Definition. Computer Communications Review, 39 (1), 50-55.
[13]Iyer, B. and Henderson, J. C. 2010. Preparing for the Future: Understanding the Seven Capabilities of Cloud Computing. MIS Quarterly Executive, 9(2), 117-131. [14]Zhang, Q., Cheng, L. and Boutaba, R. 2010. Cloud
computing: state-of-the-art and research challenges. J. of Internet Services and Applications, 1(1), 7-18.
[15]Skilton, M., 2010. Building Return on Investment from Cloud Computing. White Paper. Cloud Business Artifacts Project, Cloud Computing Work Group, The Open Group.
[16]Louridas, P. 2010. Up in the Air: Moving Your Applications to the Cloud. IEEE Software, 27(4), 6-11. [17]Buyya, R., Broberg, J. and Goscinski, A. M. 2010. Cloud
Computing Principles and Paradigms, WILEY publication.
[image:6.595.47.288.308.517.2]