Georgia State University
ScholarWorks @ Georgia State University
Nutrition Theses Department of Nutrition
Spring 5-9-2015
The Relationship Between Within-day Energy
Balance and Protein Distribution on Body
Composition in Collegiate Female Basketball
Players
Robert Bergia
Follow this and additional works at:https://scholarworks.gsu.edu/nutrition_theses
This Thesis is brought to you for free and open access by the Department of Nutrition at ScholarWorks @ Georgia State University. It has been accepted for inclusion in Nutrition Theses by an authorized administrator of ScholarWorks @ Georgia State University. For more information, please contact
Recommended Citation
Bergia, Robert, "The Relationship Between Within-day Energy Balance and Protein Distribution on Body Composition in Collegiate Female Basketball Players." Thesis, Georgia State University, 2015.
AUTHOR’S STATEMENT
In presenting this thesis as a partial fulfillment of the requirements for the advanced degree from Georgia State University, I agree that the library of Georgia State University shall make it available for inspection and circulation in accordance with its regulations governing materials of this type. I agree that permission to quote, to copy from, or to publish this thesis may be granted by the professor under whose direction it was written, by the Byrdine F. Lewis School of Nursing and Health Professions director of graduate studies and research, or by me. Such quoting, copying, or publishing must be solely for scholarly purposes and will not involve potential financial gain. It is understood that any copying from or publication of this thesis which involves potential financial gain will not be allowed without my written permission.
____________________________
NOTICE TO BORROWERS
All theses deposited in the Georgia State University library must be used in accordance with the stipulations prescribed by the author in the preceding statement. The author of this thesis is:
Robert Emerson Bergia III
450 Piedmont Ave
Atlanta, GA 30308
The director of this thesis is:
Dan Benardot, PhD, RD, LD, FACSM
Professor
Department of Nutrition
Byrdine F. Lewis School of Nursing and Health Professions
Georgia State University
VITA
Robert E Bergia III
450 Piedmont Ave
Atlanta, GA 30308
Education
Georgia State University
Master of Science Degree Candidate
Major: Nutrition
Pennsylvania State University
Bachelor of Science
Major: Nutrition
Minor: Psychology
Professional Experience
Graduate Teaching Assistant (Fall 2014) : Dr. Anita Nucci
Graduate Research Assistant (Spring 2015) : Dr. Anita Nucci
Professional Societies
American Society for Nutrition
Academy of Nutrition and Dietetics
o Sports, Cardiovascular, and Wellness Nutrition Community Group
ABSTRACT
THE RELATIONSHIP BETWEEN WITHIN-DAY ENERGY BALANCE AND PROTEIN DISTRIBUTION ON BODY COMPOSITION IN COLLEGIATE FEMALE
BASKETBALL PLAYERS
Robert Bergia, Dan Benardot, Anita Nucci, Walter Thompson
Background: Previous research suggests associations between energy balance, eating frequency, macronutrient content, and macronutrient distribution with body composition. In particular, energy balance and protein intake have been conventionally evaluated in 24-hr time blocks, consistent with dietary recommendations and general public
understanding. However, there is a potential benefit to investigating energy balance and protein intake in smaller increments of time to account for dynamic changes that occur within-day.
Objective: The purpose of this study was to evaluate protein intake/distribution relative to energy balance fluctuations during the day and body composition in collegiate female basketball players.
Methods: Subjects provided information on dietary intake and expenditure. Body
composition was assessed by multi-current bioelectrical impedance. Energy balance (EB) and related protein distribution variables were determined with a Computerized Time-Line Energy Analysis procedure. Data were analyzed for associations between energy balance, protein intake and distribution, and body composition. Data are displayed as either traditional 24-hr EB and total protein intake or dynamic protein variables in relation to real-time EB (ingestion within ± 400 kcal EB or > 0 kcal EB).
Results: There was no relationship between net 24-hr energy balance and percentage body fat. A statistically significant positive relationship was observed between total protein intake and body fat mass (R = .597; p = .031). No relationship was observed between protein distribution variables (g in ± 400 kcal EB, g in > 0 kcal EB) and percentage body fat. Protein eating occurrences (>10g, ± 400 kcal EB) was inversely correlated with BMI (R = -.650; p = .016). Subjects with the greatest energy deficits presented with lower lean body mass (R= -.736; p = .004).
THE RELATIONSHIP BETWEEN WITHIN-DAY ENERGY BALANCE
AND PROTEIN DISTRIBUTION ON BODY COMPOSITION IN
COLLEGIATE FEMALE BASKETBALL PLAYERS
by
Robert E. Bergia III
A Thesis
Presented in Partial Fulfillment of Requirements for the Degree of
Master of Science in Health Sciences
The Byrdine F. Lewis School of Nursing and Health Professions
Department of Nutrition
Georgia State University
Atlanta, Georgia
2015
THESIS COMMITTEE
Dan Benardot, PhD, RD, LD, FACSM (Chair)
Anita Nucci, PhD, MPH, RD, LD
ii
ACKNOWLEDGMENTS
This thesis would not have been possible without assistance from the following people:
Dr. Anita Nucci - for her valuable edits, suggestions, and general helpfulness.
Dr. Walter Thompson - for his time and refinement of the thesis.
iii
TABLE OF CONTENTS
List of Tables ... iv
List of Appendices ...v
List of Abbreviations ... vi
Chapter I. INTRODUCTION ...1
II. LITERATURE REVIEW ...4
Eating Frequency ...4
Protein Intake and Distribution ...6
Protein and Energy Restriction ...13
Energy Availability ...16
III. METHODS………. .20
IV. RESULTS……… ....25
V. DISCUSSION AND CONCLUSIONS……….. .30
REFERENCES ...35
iv
LIST OF TABLES
Table Page
1. Descriptive Statistics of Collegiate Female Basketball Players ...25
2. Energy Balance Descriptive Statistics of Collegiate Female Basketball
Players ...26
3. Protein Intake and Distribution Descriptive Statistics of Collegiate Female
Basketball Players ...27
4. Correlations Between Total Protein Intake, Body Fat Mass, and Total Kcal
v
LIST OF APPENDICES
Appendix Page
A. Informed Consent Form ...41
B. NutriTiming Data Entry Form ...44
vi
LIST OF ABBREVIATIONS
ANOVA Analysis of Variance
CHO Carbohydrate
CTLEA Computerized Time-Line Energy Analysis
EO Eating Occurrence
EB Energy Balance
FSR Fractional Synthetic Rate
hr/hrs Hour/s
kcal Kilocalories
kg Kilograms
LBM Lean Body mass
MPS Muscle Protein Synthesis
NHANES National Health and Nutrition Examination Survey
RED-S Relative Energy Deficiency in Sport
RDA Recommended Daily Allowance
1
CHAPTER I
THE RELATIONSHIP BETWEEN WITHIN-DAY ENERGY BALANCE AND PROTEIN DISTRIBUTION ON BODY COMPOSITION IN COLLEGIATE
FEMALE BASKETBALL PLAYERS
INTRODUCTION
Discussions about how to best optimize diet for body composition benefits usually
center on total daily distribution of energy substrates (protein, fat, and carbohydrate) and
total energy intake. Predictive equations are performed that will give an energy goal for
the day, and it is assumed by many that if you meet these requirements you will attain
weight stability. Unfortunately, bioenergetics is much more complex than a “calories in”,
“calories out” model. Energy availability is a concept that recognizes that dietary energy
expended in one process (cellular maintenance, thermoregulation, growth, reproduction,
locomotion, etc.) is not available for others (Loucks et al. 2011). Bioenergeticists define
energy availability as dietary energy intake minus the energy expended in a particular
metabolic demand of interest. For example, in exercise physiology, energy availability is
defined as dietary energy intake minus the energy expended in exercise (EA = EI-EEE)
(Loucks et al. 2011).
The International Olympic Committee has even recognized the importance of energy
availability. Recently, the term RED-S (Relative Energy Deficiency in Sport) has
supplanted the Female Athlete Triad as it was recognized that the phenomenon is not a
2
relative energy deficiency that affects other physiological aspects (Mountjoy et al. 2014).
In this case, energy requirements for locomotion may double or even quadruple, which
will result in less available energy for other processes such as reproduction and cellular
maintenance. For this reason, it is important to look at energy balance relatively. It is less
important that an athlete meets total 24-hr energy requirements than that they have
energy available when they need it throughout the course of the day.
“The Recommended Dietary Allowance (RDA) is an estimate of the minimum
daily average dietary intake level that meets the nutrient requirements of nearly all (97 to
98 percent) healthy individuals.”(Trumbo et al. 2002) The RDA for protein is set at 0.8 g
protein/(kg x d) to meet needs and prevent deficiency for most of the population.
Recently, there is evidence that the maximal rate of protein synthesis can be achieved for
most with 20-30g of high quality protein per meal (to achieve 0.8g/kg per day), a level
that is not met by most Americans (Paddon-Jones & Rasmussen, 2009; Symons et al.
2009). Energy and protein consumption is typically skewed toward the evening meal
(38g protein) as opposed to the morning meal, which has a relatively low protein content
(13g protein) (NHANES, USDA Agr Research Service, 2012). This 3-fold difference can
explain how Americans easily meet the daily protein requirement yet may still be
deficient for much of the day.
One of the prime reasons that real-time energy balance analysis is being examined
instead of twenty-four hour total energy balance is that energy expenditure and hormone
activity can be reliable factors. Twenty-four hour energy balance is just a description of
calories in, and calories out. Analyzing dietary intake in real time accounts for periods of
important when looking at body composition because dietary factors influence numerous
hormones with substantial impact on fat and fat-free mass. For example, a prolonged
period in an energy deficit will increase concentrations of cortisol, which has particularly
deleterious effects on fat-free mass. On the other hand, a notable energy deficit followed
by a large meal will exponentially raise insulin which will result in marked increase in fat
storage. Therefore, this study will examine protein intake and distribution relative to
current energy balance to determine if a relationship exists between body composition
and energy status when protein is ingested.
STUDY PURPOSE
The purpose of this study is to determine if protein intake and distribution, relative to
current energy balance, is related to body composition in collegiate female basketball
players.
HYPOTHESES
Hypothesis 1: Subjects with greater protein distribution (< 30g) while in positive EB (> 0
kcal) will have a lower percentage body fat than those with less protein distributed in EB.
Hypothesis 2: Subjects with greater protein distribution (< 30g) while in ± 400 kcal EB
will have a lower percentage body fat than those with less protein distributed in relative
EB.
Hypothesis 3: Subjects with a greater number of eating occurrences containing >10 g
protein intake in a positive energy balance will have lower percentage body fat than those
4
CHAPTER II
REVIEW OF LITERATURE
INTRODUCTION
Body composition has been examined as a phenomenon of net energy balance, or
‘calories in, calories out’ for decades. Macronutrient content and distribution, meal
frequency and timing, and relative within-day energy balance has more recently gained
traction in an effort to explain proportions of body composition variance. The following
review covers a body of knowledge spanning the major sub-categories of eating
frequency, protein intake and distribution, differential metabolic properties according to
energy state, and energy availability. The purpose is to provide a solid foundation to
justify the need to examine new indices to explain body composition differences in
individuals.
EATING FREQUENCY
Research investigating eating frequency and body composition are a good base to
build theories pertaining to energy balance upon. After all, it can be assumed that those
who are frequent eaters spent a greater proportion of the day in relative energy balance
and surpluses. In fact, the 24h energy balance theory is often challenged by findings of
eating frequency studies. Typically, frequent eating is associated with an increase in total
daily energy intake. Those who had ≥ 5 eating occurrences (EO)/day consumed 800 kcal
per day more than those who had ≤2 EO/day (Kerver et al. 2006). However, meals that
stimulate a rapid increase (and subsequent decline) in blood glucose, such as large meals
typical in infrequent eating patterns, have been implicated in promoting increased hunger
and energy dysregulation (Roberts, 2000). The mechanism behind these findings appears
to be a prolonged elevation of ghrelin as a result of large meals inducing a
hyperinsulinemic response which will not inhibit ghrelin release (Saad et al. 2002).
Frequent eating (≥3 EO/day) is related to decreased visceral fat and triglycerides
despite an increase in total daily calories consumed (House et al. 2014). Building upon
this finding in an expanded replication study, House et al. (2015) found that frequent
eaters had lower BMIs, waist circumferences, fasting insulin values, insulin resistance,
and triglycerides than infrequent eaters, despite consuming more calories per day. A
potential gender difference has been reported by Drummond et al. (1998), where in a
cross-sectional study men exhibited a significant negative correlation between eating
frequency and body weight/BMI, while women subjects displayed no such relationship.
Ramadan, an Islamic holiday involving fasting from sunrise to sunset for 29-30
days, presents as a unique opportunity to study differential meal frequency with
reliability in a free-living setting. Results of Ramadan feeding (and hence a reduced meal
frequency) on body composition have been inconclusive. A classic Ramadan pilot study
detected an increase in caloric intake and body weight during Ramadan (Frost & Pirani,
6
BMI, body fat percentage, and total body water in young women after Ramadan. Muscle
mass was unaffected despite a reduction in eating frequency. Recently, Nourouzy et al.
(2013) observed differential reductions to body composition depending on age and
gender. All subjects lost a significant amount of lean body mass as a result of reduced
eating frequency. Men and subjects <35 years old lost the most weight and body fat.
Women >35 years old were the only group to experience no reduction in body fat despite
a significant decrease in lean body mass. More research is needed to investigate the
potential deleterious effects of reduced eating frequency on adiposity in general, and
visceral adiposity in particular.
Protein Intake and Distribution
The RDA for protein was established from studies that estimated minimum
protein intake necessary to prevent a progressive loss of LBM as reflected by nitrogen
balance (Wolfe et al. 2008). This methodology has numerous drawbacks, including the
potential for low-protein diets to induce adaptions to spare nitrogen; thus confounding
results (Morse et al. 2001). In fact, the Food and Nutrition Board acknowledged the
limitations to basing the RDA upon nitrogen balance studies due to there being no
relevant physiological end point (Wolfe et al. 2008). The problem that has arisen in
recent years is that the RDA is minimalist (by design), yet it is often considered
indicative of optimal intake. The RDA certainly does not address what the ideal amount
of protein for optimal function is (Volpi et al. 2003). The key distinction between optimal
functioning and the prevention of wasting cannot be overlooked. Athletes are not seeking
to simply prevent deficiency or replete amino acids lost to catabolic pathways. Rather,
of reference for athletes, as suggested in the ACSM guidelines which recommend intakes
for athletes ranging from 1.2 to 1.7 g/kg.
National Health and Nutrition Examination Survey (NHANES) data indicate that
protein consumption is skewed towards the evening (NHANES, USDA Agr. Research
Service. 2012). This suggests that the majority of our population is protein deficient for
much of the day followed by back-loading in the evening. The mean protein intake at
breakfast is 13g, and the mean protein intake in the evening meal is 38 grams (NHANES.
2012). Using a secondary analysis of NHANES data, this indicates that the typical
protein distribution pattern is dispersed as 10%, 20%, and 60% across breakfast, lunch,
and dinner, respectively (10% snacking) (Krebs-Smith et al. 2010).
The question of how much protein we can utilize for muscle protein synthesis
(MPS) if ~60% is consumed in one meal is being investigated. Symons et al. (2009)
sought to answer that question by having one pair of groups (young, elderly) consume a
moderately sized protein meal (113g lean beef, 30g protein, 10g EAAs, 220 kcal) and
another pair consume a threefold larger meal (340g lean beef, 90g protein, 30g EAAs,
660kcal) and measuring protein synthesis responses. The study found that post-absorptive
mixed muscle fractional synthetic rate (FSR) were similar across all groups. In essence,
this study found that participants who consumed 90g protein gained no further protein
synthetic advantage when compared to the smaller 30g meal. Moore et al. (2009)
conducted a similar dose response study following resistance training exercise. Drinks
contained 0, 5, 10, 20, or 40g whole egg protein. Results indicate that MPS was
8
One recent study specifically investigated within-day dietary protein distribution
on 24-h MPS (Mamerow et al. 2014). This crossover study spanned 7 days and included
a normally distributed protein group (30g protein for breakfast, lunch, and dinner) and a
skewed protein group (10g protein for breakfast, 15g for lunch, 65g for dinner). Results
indicated that 24-h MPS was ~25% greater when protein intake was evenly distributed,
compared with the skewed diet. Most studies suggest 20-30g protein to be the anabolic
maximum in the normal healthy population, although it is worth noting that a blunted
anabolic response to dietary protein intake has been reported with aging. One such study
found that protein pulse feeding (72% of daily protein consumed in one meal at noon)
was superior to normally distributed protein intake in conferring lean body mass index
(Bouillanne et al. 2013).
Attention has been drawn to specific amino acids (particularly leucine and
essential amino acids) being primarily responsible for the stimulation of muscle protein
synthesis. One study assessed whether nonessential amino acids are required to stimulate
muscle protein anabolism (Volpi et al. 2003). Groups were given either 18g EAAs or 40g
balanced amino acids (18g EAA + 22g nonessential amino acids) in small boluses every
10 min for 3h. Results indicate that there was no difference between groups in degree of
MPS. This implies that EAAs are primarily responsible for amino-acid stimulation of
muscle protein anabolism and that EAAs are more anabolically efficient. An important
consideration is that the 18g EAA could have been enough to attain maximal muscle
protein synthesis and the additional nonessential amino acids would confer no further
Just as the threshold for maximal MPS has been postulated as ~30g, a similar
threshold is suggested for EAAs. Research indicates that ~15g of EAAs are required to
maximally stimulate MPS (Paddon-Jones et al. 2004). EAA-only supplementation has
been shown to increase muscle protein anabolism to a similar degree as mixed amino acid
solutions (Tipton et al. 1999; Volpi et al. 2003).
Indeed, the necessity of certain substrates for muscle protein synthesis can be
refined even further. Leucine has been suggested as a prime activator of anabolic
processes in muscle. Aside from leucine’s role as a constituent of protein, leucine
exhibits potent translational control of protein synthesis and glycemic regulation (Norton
et al. 2006). Leucine stimulates MPS through the protein kinase mammalian target of
rapamycin (mTOR), as well as through mTOR-independent mechanisms, which are
outside the scope of this review (Norton et al. 2006). Leucine alone has been shown to be
capable of stimulating MPS to a similar degree as complete protein or mixtures of amino
acids, albeit the effects were acute (Crozier et al. 2005; Norton et al. 2009). The authors
posited that leucine stimulatory effects on MPS were transient in nature due to prolonged
increases in synthesis requiring a full complement of amino acids to act as substrate
(Crozier et al. 2005). It can be inferred that as leucine serves as a signaling molecule to
initiate protein synthesis, a threshold must be passed to maximally stimulate these
processes. Norton et al. (2009) posited that a specific threshold of leucine intake is
required to initiate mRNA translation and muscle protein synthesis, and that a low intake
of some protein sources may not reach this ‘initiating’ threshold. This non-linear
threshold response is evinced by MPS being 80% greater in egg protein feeding
10
(Norton et al. 2012). The precise leucine initiating threshold in humans has not been
elucidated. This general finding of an ‘initiating’ threshold being required is supported in
the literature (Areta et al. 2013). Researchers examined MPS in response to 80g whey
protein distributed as 2x40g (BOLUS), 4x20g (INT), and 8x10g (PULSE). Results
indicated that the INT group had the overall highest rates of MPS (Areta et al. 2013).
Thus, a PULSE (grazing) meal pattern does not produce enough of a plasma rise in amino
acids or leucine to initiate muscle protein synthesis, while the BOLUS feeding pattern
does not stimulate MPS often enough. West et al. (2011) assessed MPS in response to
BOLUS and PULSE feeding as well. Results indicate that despite an identical net area
under the EAA curve, MPS was elevated to a greater extent after BOLUS than after
PULSE at time points 60 and 180 minutes after exercise. PULSE protein ingestion
resulted in a smaller but sustained increase in aminoacidemia, but the spike (supporting
the initiating threshold hypothesis) in EAA concentrations (162% in BOLUS vs 53% in
PULSE) is posited as a primary trigger for MPS (West et al., 2011).
The saturating dose of leucine appears to be 2.5-3g, in which further increases
would not likely promote further muscle protein synthesis (Churchward-Venne et al.
2012). Various protein sources have different proportions of leucine, hence it will require
a larger serving of a protein source under-represented in leucine to reach the saturating
dose. This has implications for consideration of protein quality and source in determining
dietary adequacy of protein intake. Thus, there appears to be a ‘Goldilocks principle’ for
protein and leucine ingestion, where it is ineffective to consume too little and inefficient
to consume too much (and ineffective if displacing protein intake from other more
If 20-30g protein intake is required for maximal MPS, a 75kg person would need
to eat 20g at each meal (breakfast, lunch, dinner) to meet the 0.8 g PRO/kg/d RDA, an
amount that can be met relatively easily. However, imagine a 100kg athlete seeking to
efficiently ingest 1.5g PRO/kg/d (to optimize muscle protein synthesis and not simply
prevent deficiency). This athlete would require 5 meals containing 30g protein to prevent
wasteful oxidation above the threshold. An eating pattern to efficiently accommodate
150g of protein would require much more planning.
Protein synthesis as stimulated by leucine feeding or EAA ingestion has been
shown to be elevated for approximately two hours (Bohe et al. 2001; Anthony et al.
2002). Different considerations, such as insulin rise, gastric emptying, and elevated fatty
acid levels must be taken into account when considering a mixed-meal, however. Norton
et al. (2009) determined the duration of protein synthesis to a complete meal of
carbohydrate, fatty acids, and protein to be approximately 3 hours. Protein and amino
acid concentrations do not fully explain muscle protein synthesis, it seems. Synthetic
response fell off after the aforementioned 3 hours despite plasma leucine being elevated
3-fold over baseline (Norton et al., 2009). A similar finding by Bohe et al. (2001) has
been reported where duration of elevated muscle protein synthesis in response to EAA
infusion was only two hours long despite the infusion lasting six hours. Hence, it appears
that muscle protein synthesis becomes ‘refractory’ to elevated plasma amino acid
concentrations alone (Norton et al. 2009). This finding has been described as the
‘muscle-full effect’ (Atherton et al. 2010), where amino acid concentrations no longer correlate
with rates of MPS. A cyclical pattern of rapid increases in amino acids followed by
12
refractory periods to MPS in muscle (West et al. 2011). This could potentially explain a
proportion of variance as to why more is not always better in eating frequency trials.
The incongruity between initiation signals and postprandial duration of MPS has
not been fully elucidated. Potential explanations include a refractory response to external
stimuli (previously mentioned), reduced availability of amino acids, or reduced signaling
from insulin or other key signals (Wilson et al. 2011). Research by Wilson et al. (2011)
supported the findings of significant correlation between translation initiation and MPS in
the first 90 minutes, and a subsequent drop-off in the postprandial period despite elevated
amino acid levels and mTORC1 signaling compounds. So, leucine and translation
initiation signaling are required to facilitate an initial rise in MPS, but how can the
response be sustained? It appears that insulin is not the sole critical factor in extending
MPS (Wilson et al. 2011), due to leucine supplementation post-meal extending MPS to a
similar degree as CHO despite decreased insulin concentration. The ratio of AMP/ATP
and AMPKα phosphorylation in the muscle (and thus the energy status of muscle) was
determined to be the prime limiting factor for MPS at 180 minutes after a meal (Wilson et
al. 2011). In essence, amino acids do not always present themselves as the limiting factor
in MPS, often an energy deficit is the prime culprit. This finding further supports the
importance of examining protein intake and distribution relative to current energy
balance, as neither component can adequately explain body composition variance by
itself.
As it is established that there is a threshold for protein synthesis, the next logical
step is to determine how often one can attain that threshold and still gain the synthetic
mixed meals invoking 3 hours of elevated protein synthesis is a good starting point to
estimate required meals per day. As previously mentioned, a larger, more physically
active person may require more protein feeding opportunities during the day to satisfy
optimal intake recommendations. Loenneke et al. (2012) investigated the relationship
between the number of times an individual hits the EAA threshold (~10g) and central
adiposity. Results indicate that individuals who hit the EAA threshold more times present
with lower central adiposity (Lonneke et al. 2012); which is significant because a
physiological end-point is now associated with research which has been acute in nature.
To summarize, the literature points to anything above 20-30g protein per meal
(~15g EAAs, 3g leucine) as potentially being energetically inefficient for most people.
There is no great inherent danger to excessive oxidation of amino acids in the context of
energy balance considerations, however, excess protein intake means the displacement of
other important macronutrients. On the other end of the spectrum, it may not be prudent
to follow a grazing pattern, as evidence of an ‘initiation threshold’ (Norton et al. 2009) is
mounting. This narrow ‘Goldilocks zone’ (in which the optimal intake lies between
extremes of both amount and frequency) warrants closer investigation. Daily distribution
of protein is an important topic that is now being explored, but the ratio of real-time
energy balance in relation to protein intake is a new frontier.
Protein and Energy Restriction
A review of literature concerning metabolic and body composition matters in the
context of energy restriction is particularly important for the present study given the
population investigated. The female basketball players presently studied are at risk for
14
estimated needs, and female athletes appear to be more vulnerable to eating disorders.
(Sundgot-Borgen, 1996). In fact, in comparison to male athletes (even when normalized
for body weight) female athletes consume only ~70% of estimated energy and
carbohydrate requirements (Loucks, 2004). Three distinct origins of energy deficiency
threaten the athlete: 1.) Obsessive eating disorders in conjunction with mental illness, 2.)
Misguided effort to reduce body size and fatness to succeed in competition, 3.) Failure to
increase energy intake to meet the increase in energy expenditure (Loucks, 2011). In past
research utilizing Computerized Time Line Energy Analysis, athletes presented with a far
greater proportion of the day spent in a relative energy deficit as opposed to an energy
surplus (Deutz et al. 2000). Furthermore, even when psychosocial factors are not
considered, energy deficits caused by increased exercise energy expenditure do not
stimulate concomitant increase in energy intake to the degree of food deprivation-induced
hunger (Hubert et al. 1998). Therefore, examination of metabolic function during energy
restriction/deficit is warranted.
Protein intake above the RDA has been proposed to attenuate loss of lean body
mass during periods of energy deficiency by inducing alterations in protein turnover
(Phillips, 2008). One study of interest was performed by Pasiakos et al. (2013) who
sought to explore body composition and muscle anabolic responses to varying levels of
protein intake. Participants were placed on isoenergetic diets containing either 1x PRO
RDA (0.8g PRO/kg/d), 2x PRO RDA (1.6g PRO/kg/d), or 3x PRO RDA (2.4g
PRO/kg/d) and then underwent a 10d weight maintenance diet followed by a 21d 40%
energy deficient diet. Results indicate that consuming dietary protein at levels above the
58% of weight lost in the RDA group, while the 2x- and 3x-RDA groups lost 30 and
36%, respectively, of fat-free mass as a proportion of total weight lost. Notably, a
threshold effect was detected as the group consuming 3x the RDA for protein
experienced no greater protection of fat-free mass than the group consuming 2x the RDA.
Proportion of energy from protein may be even more critical in periods of energy
deficit. Pikosky et al. (2008) observed a decline in nitrogen balance in subjects
consuming 0.9g PRO/kg/d when placed on a 7d diet producing a 1000-kcal energy
deficit. However, nitrogen balance was maintained in the group consuming 1.8g
PRO/kg/day throughout the same 7d 1000-kcal energy deficit diet, suggesting a
protective effect.
The question of how protein influences mechanisms to improve retention of lean
body mass is of central importance to helping many attain a healthy body composition.
Likely, lean body mass is lost during periods of caloric restriction due to an increase in
muscle cell proteolysis as opposed to muscle protein synthesis being downregulated.
Research by Villareal et al. (2012) and Campbell et al. (2009) suggest that protein
synthetic response can be maintained during energy restriction, but high rates of
proteolysis are observed. Of interest to the present study population, Campbell et al.
(2009) detected salient metabolic protective effects of resistance training on lean body
mass. Additionally, Villareal et al. (2012) identified an increased anabolic response to
feeding in subjects in an acute energy deficit, but did not detect the same effect after
weight loss had occurred (suggesting an adaptive response).
The adaptive response to increased protein intake could explain some of the
16
whole-body protein turnover rate (Pannemans et al. 1995). When protein intake notably
surpasses maximal postprandial protein synthesis capacity, amino acid oxidation has been
observed to increase 63-95% (Pannemans et al. 1998). Thus, increasing protein intake
could simply increase the protein turnover rate, which would increase the protein
requirement to maintain nitrogen balance (Gaine et al. 2006). In essence, the supply
produces the demand to ultimately create a balance. However, the most potent modulator
aside to the whole body protein turnover equation is exercise, which in tandem with
increased protein intake can maintain anabolic sensitivity and result in a net positive
nitrogen balance (Gaine et al. 2006; Campbell et al. 2009).
The means by which dietary protein can induce an energy deficit are also of
interest. The effects of macronutrient proportions on diet-induced energy expenditure
(DEE) is one potential contributor to the equation. DEE concerns the energy-requiring
reactions in the post-prandial period: including intestinal absorption of nutrients,
initiation of metabolism, and storage of those nutrients not immediately oxidized (Tappy,
1996). DEE for each specific nutrient varies, with fat having the lowest DEE value at
0-3%, carbohydrate at 5-10%, and protein at 20-30% (Tappy, 1996). Typically, DEE
represents 10% of daily energy expenditure when in energy balance (Westerterp, 2004).
Thus, a high-proportionate protein diet can induce a small but significant change in
long-term energy balance.
Energy Availability
Relative energy availability is particularly important to athletes as energy
expenditure for locomotion is notably increased. The impact of relative energy deficiency
of the other four major metabolic activities (cellular maintenance, thermoregulation,
growth, and reproduction) from energy deficits around the time of exercise, even if
complete energy balance by the end of the day is achieved. The effect of low energy
availability is particularly salient on reproduction in mammalian females (Loucks, 2003).
Issues concerning this are outside the scope of this review, but it should be noted that
secondary amenorrhea and oligomenorrhea are typical warning signs of low EA and
disordered eating. This is dependent upon suspicion of athlete at risk and self-reporting,
however, as there is currently no standardized guidelines to determine EA (Mountjoy et
al. 2014).
Many athletes engage in energy restriction in an effort to attain a physique that is
expected of them. This pressure is particularly pronounced on women and athletes in
aesthetic sports. The practice of energy restriction in combination with exercise-related
energy expenditure to reduce body fat is ineffective at achieving its goal. In response to
energy restriction, the human adaptive response results in a reduction in resting metabolic
rate. One study examined this phenomenon by having endurance runners consume either
a low-energy diet or adequate energy diet and measuring resting metabolic rate
(Thompson et al. 1993). The resting metabolic rate was significantly down-regulated in
the group consuming the low-energy diet. A similar homeostatic response in regards to
energy expenditure in runners compared to non-runners has also been observed (Mulligan
& Butterfield, 1990). The finding relevant to the present study from the Mulligan &
Butterfield (1990) research being that runners, in spite of greater energy expenditure than
18
By this mechanism the body adapts to energy restriction by lowering daily energy
expenditure, often by shedding metabolically active tissue (muscle). Whereas glucose has
glycogen and fatty acids have triglycerides, there is no inactive storage compound for
amino acids (Volpi et al. 2003). This makes skeletal muscle protein particularly
susceptible to significant losses in periods of fasting (Biolo et al. 2002). Indeed, it is
counterproductive for an athlete who is trying to achieve an optimal strength to weight
ratio to remove the tissue that generates strength.
The old model of 24h energy balance has many shortcomings, as illustrated by
this comparison of studies with similar subjects and variables, but different methods of
analysis. One such study examines 24h energy balance and body composition in juvenile
elite gymnasts (Filaire & Lac, 2002). Body composition, dietary intake, and energy
expenditure were examined in 12 elite female gymnasts with 15+ hours/wk physical
activity and in 9 control subjects age-matched with less than 4 hours/wk physical activity.
Results indicate that the gymnasts were significantly shorter and had lower body weight
than controls. The primary finding of this investigation is that in both groups, the mean
daily energy intake met the energy requirement. Thus, the gymnasts did not restrict
total energy and were presumably in energy balance. Using 24-hour energy balance does
not reveal when and for how long energy deficits occurred during the day. It must
rationally be assumed that something must be causing this significant height difference
between gymnasts and controls. The most likely culprit is relative energy deficiency for
much of the day due to increased expenditure in locomotion which will inhibit the other
A more complete understanding of energy balance is achieved by a study utilizing
real-time energy balance analysis (Deutz et al. 2000). This study examined intake and
expenditure using Computerized Time-Line Energy Analysis (NutriTiming) to determine
number and frequency of within-day energy deficits, surpluses, and relative balance.
Results indicate that those with the most hours spent in energy deficit had the highest
percentage body fat. Furthermore, the magnitude of the deficits was also positively
associated with body fat percentage. In this study, 24hr energy balance showed no
relationship with body fat percentage. Further refuting the 24hr energy balance theory is
evidence of energy surpluses being inversely associated with body fat percentage.
Although it must be noted that the energy surpluses observed were typically of a lower
magnitude and frequency than the deviations of the relatively larger energy deficits.
Mechanistically, this manifests as a potential lower insulin response and concomitant
increase in fat storage as a result of the relatively small energy surpluses. Therefore, it
cannot be stated that large magnitudes or frequencies of energy surplus is advised (due to
basic thermodynamics of weight stability), but rather small energy surpluses appear to
have a favorable effect on body composition.
Comparing these two studies which examine similar populations and variables
illustrate the problem with the often employed 24hr energy balance analysis. Some
athletes with high body fat percentage in the Deutz et al. (2000) study had pronounced
and/or prolonged energy deficits, but ended the day in perfect energy balance. The issue
is manifest using real-time energy balance analysis, but these same athletes would
20
CHAPTER III
METHODS
INCLUSION CRITERIA
Individuals were eligible for inclusion only if they were on the Georgia State
University Women’s Basketball Team. For this reason, there are no minors or men in the
study. The team consisted of 17 potential subjects, aged 19-26 years old. Procedures were
approved by the Georgia State University Institutional Review Board.
SUBJECTS
Of the 17 potential subjects, 13 completed the full study protocol. Recruitment occurred
in the Georgia State University Sports Annex. Recruitment proceeded as follows:
1. The student PI and PI were invited to talk about sports nutrition to the team and
coaches. The study was introduced at this time.
2. Players interested in volunteering for the study were provided the email address of
the student PI, and could contact the student PI directly.
3. A mutually acceptable time for the student PI and volunteer subject was
established for them to meet in Room 455, Petit Science Center. At that time, the
student PI covered the content of the informed consent form with the player.
4. Subjects interested in volunteering for the student then signed the informed
5. Following data acquisition, participants were given the option to review the
results of their data after analysis had been performed.
DATA ACQUISITION PROTOCOLS
All evaluations took place in the Laboratory for Elite Athlete Performance (455
Petit Science Center) on the campus of Georgia State University. Data collection
occurred in a 2-month period from October to December, 2014. On arrival in the
laboratory, subjects were asked to describe the previous day’s schedule to the interviewer
(student PI). NutriTiming® (NutriTiming® LLC, Atlanta, GA), a computerized timeline
energy analysis (CTLEA) program, was used to assess real-time energy balance. This
method of analysis has been validated previously (Benardot, 1996), although not with
collegiate basketball athletes.
A full description of CTLEA methodology has been previously described (Benardot,
1996. Deutz et al. 2000). Briefly, CTLEA simultaneously assesses food intake and energy
expenditure. The energy content of consumed foods in NutriTiming was based upon the
USDA nutrient database for standard reference (Version 26). Foods reported by the
athlete that were not included in the nutrient database were manually added from
information on the food label or data provided by the food producer. Programmed into
CTLEA is the methodology for determination of energy expenditure data as presented by
the Physical Activity Guidelines Advisory Committee (U.S. Department of Health and
Human Services, 2008) and the National Research Council (NRC, Food and Nutrition
Board, 1989). As opposed to a daily activity factor, real time energy expenditure was
assessed by asking participants to assign an activity factor to all daily activities using a 13
22
activity was emphasized. Energy intake data were obtained using a method similar to
24-hr recall, except that activity and food intake information are obtained simultaneously
(Deutz et al. 2000).
Subjects entering 455 Petit Science Center had their height, weight, body
composition, and previous day dietary record and energy expenditure recorded.
1. Measurement of Height: Height was measured on a standard physician
stadiometer in inches (then converted to cm). Subjects were asked to stand
straight with no socks or shoes for the measurement. There is no risk or
discomfort associated with this measurement.
2. Measurement of Weight and Body Composition (fat mass and fat-free mass in
kg): A multi-current BIA body composition analyzer (Tanita BC-418) was used to
assess body weight and composition. Subjects stood on the scale without their
shoes and socks and held additional handles in each hand. There is no discomfort
associated with this test, which took approximately 2 minutes to set up and run.
There is no harm or risk associated with this assessment.
3. Measurement of Diet/Fluid Intake and Energy Expenditure: Subjects completed a
questionnaire and interview. Hourly energy intake and expenditure were recorded,
with an emphasis placed on timing of intake and expenditure, using the
NutriTiming Data Entry Form (Appendix II). There are no risks associated with
this task.
DATA ANALYSIS
Statistical analysis of data was analyzed using SPSS for Windows 7 (version 22.0,
SPSS, Inc., Chicago, IL). Abnormal distribution of the data were assumed due to the
small sample size (n = 13). Thus, analyses were performed utilizing non-parametric
statistical methods. Numerous indices of protein intake in relation to energy balance were
examined. Variables examined for determination of energy balance included Net Energy
Balance (24hr Starting EB – Ending EB), Hours anabolic (EB > 0 kcal), Hours catabolic
(EB < 0 kcal), Hours in EB Surplus (EB > +400 kcal), Hours in EB Deficit (EB < -400
kcal), and Hours Within Optimal EB (EB within ± 400 kcal). Variables examined for
determination of protein intake and distribution included, Protein (grams ingested),
Optimal Protein (ingested within ± 400 kcal EB), Protein in EB (ingested in > 0 kcal EB),
Protein Eating Occurrences (PEO) (number of meals containing > 10 g PRO), and
Optimal PEO (number of meals containing >10g PRO within ± 400 kcal).
Descriptive statistics, frequencies, independent samples t-tests (normal variances
not assumed), and Spearman correlations were utilized to evaluate potential relationships
between energy balance, protein intake and distribution, and body composition. In all
cases, statistical significance was set at P < 0.05.
DATA SECURITY
Special care was taken to assure that no coercion was involved with participation in
this study. The subject pool consists of the Georgia State University Women’s Basketball
Team, and the coach has agreed that participation is totally voluntary. The coach and
24
volunteered for the study. Non-participation in the study in no way affected their
membership on the team or their status as a student at Georgia State University.
Volunteer subjects were assessed individually, so no other person on the team was
aware of their participation. Only subjects who voluntarily agree to participate with the
study were included in the study. Subjects used a ‘code’ and no individually identifiable
information was included on any study documents or on information that summarizes
study results. This code sheet was kept in a locked drawer in a separate room (413 Petit,
the PI’s office). All Data sheets were kept in a locked file cabinet in 455 Petit Science
Center, and electronic databases associated with this study were kept on a secure,
code-requiring, computer in 455 Petit Science Center. The electronic data had no personally
25
CHAPTER IV
RESULTS
ANTHROPOMETRIC DATA
Of the 16 eligible participants on the basketball team, 13 completed the study. Mean
weight, height, and BMI were determined to be 75.70 kg (± 12.92), 175.638 cm (± 7.47),
and 24.4 kg/m² (±3.13), respectively. Mean percentage body fat was 23.3% (± 5.2%),
with a high of 31.3% and a low of 16.0%. Mean body fat mass and lean body mass were
[image:36.612.108.526.431.590.2]18.10 kg (± 6.95 kg) and 57.60 kg (± 6.91 kg), respectively.
Table 1: Descriptive Statistics of Collegiate Female Basketball Players (N = 13)
Minimum Maximum Mean Std. Deviation
Age (yrs) 19.0 26.0 20.5 1.8
Height (cm) 165.1 190.5 175.6 7.5
Weight (kg) 59.8 105.9 75.7 12.9
Lean Body Mass (kg) 47.0 72.7 57.6 6.9
Body Fat Mass (kg) 10.5 33.1 18.1 7.0
Body Mass Index 19.3 29.1 24.4 3.1
Percent Body Fat (%) 16.0 31.3 23.3 5.2
ENERGY BALANCE
The average energy intake for all subjects was 2,259 kcal (± 411), and the average energy
26
-204 (± 629). The average largest within-day surplus was 454 kcal (± 423), and the
average greatest within-day deficit was -862 kcal (± 783). The greatest energy deficit
observed was -2,255 kcal, and the largest energy surplus was 1,460 kcal. Athletes spent
more time in energy deficit (17.46, ± 4.66) than in energy surplus (6.54, ± 4.66).
Additionally, the average number of hours spent in energy deficit greater than 400 kcal
6.46 (± 6.09). In comparison, the average number of hours spent in energy surplus greater
than 400 kcal was 2.46 (± 3.66). Athletes spent 15.08 hours (± 6.33) in relative energy
balance (± 400 kcal EB). No participant was in a state of optimal energy balance (± 400
kcal) for the full 24 hrs (2 subjects were in EB ± 400 kcal for 23 hrs, however). A
[image:37.612.105.511.374.572.2]thorough report of intake and energy balance data can be found in Table 2.
Table 2: Energy Balance Descriptive Statistics of Collegiate Female Basketball Players (N = 13)
Minimum Maximum Mean Std. Deviation
Kcal (in) 1638 3088 2259.8 410.7
Kcal (out) 1968 3676 2463.2 472.0
Energy Balance (24-hr Net) -1374 953 -204.2 629.0
Highest Energy Surplus (kcal) 10.00 1460.0 454.2 423.0
Lowest Energy Deficit (kcal) -2255.0 -374.0 -956.6 654.3
Energy Balance (hrs > +400 kcal) 0 10 2.5 3.7
Energy Balance (hrs < -400 kcal) 0 18 6.5 6.1
Energy Balance (hrs >0 kcal) 0 14 6.5 4.7
Energy Balance (hrs < 0 kcal) 10.0 24.00 17.5 4.7
Energy Balance (hrs within +/- 400 kcal) 5 23 15.1 6.3
PROTEIN INTAKE AND DISTRIBUTION
Mean total protein intake and protein intake/kg were 79.21g (± 22.01) and 1.06 (± 0.27),
respectively. Protein intake was examined in relation to various energy states and
intake while in relative energy balance (± 400 kcal) averaged 49.13g (±29.17). Lastly,
number of eating occurrences containing >10g protein (PEO) were examined, as well as
energy status modifiers. Mean PEO, PEO in ± 400 kcal EB, and PEO in > 0 kcal EB were
2.54 (± 1.19), 2.00 (± 1.29), and 1.46 (± 1.19), respectively. Table 3 summarizes protein
[image:38.612.109.529.246.404.2]intake and distribution data.
Table 3: Protein Intake and Distribution Descriptive Statistics of Collegiate Female Basketball Players
(N = 13)
Minimum Maximum Mean Std. Deviation
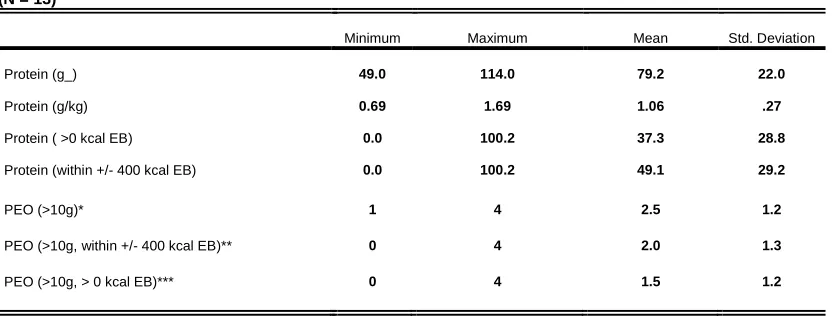
Protein (g_) 49.0 114.0 79.2 22.0
Protein (g/kg) 0.69 1.69 1.06 .27
Protein ( >0 kcal EB) 0.0 100.2 37.3 28.8
Protein (within +/- 400 kcal EB) 0.0 100.2 49.1 29.2
PEO (>10g)* 1 4 2.5 1.2
PEO (>10g, within +/- 400 kcal EB)** 0 4 2.0 1.3
PEO (>10g, > 0 kcal EB)*** 0 4 1.5 1.2
*Number of meals containing >10g protein
**Number of meals containing >10g protein while within ± 400 kcal EB *** Number of meals containing >10g protein while > 0 kcal EB
RELATIONSHIP BETWEEN ENERGY BALANCE, PROTEIN INTAKE AND DISTRIBUTION, AND BODY COMPOSITION
Net 24-hr energy balance was not associated with percentage body fat (R = .137;
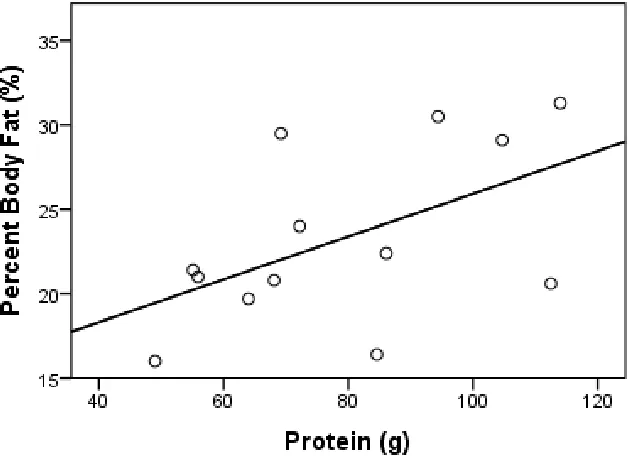
p = .655). There was no statistically significant relationship between total protein intake
and percentage body fat (R = .533; p = .061), although a notable trend was detected
(Figure 1). Furthermore, there was no statistically significant relationship between protein
ingested in relative energy balance (± 400 kcal) and percentage body fat (R = -.187; p =
28
(>10g), PEO (>10g, ± 400 kcal EB), and PEO (>10g, >0 kcal EB) and percentage body
fat (R = .117; p = .704, R = -.313; p = .298, R = -.051; p = .868).
A statistically significant relationship was observed between total protein intake
and body fat mass (r = .597*; P = .031). PEO (>10g, ± 400 kcal EB) was inversely
correlated with BMI (r = -.650; P = .016). No correlation between total energy intake and
[image:39.612.123.438.139.367.2]protein intake was detected (R = .549; p = .052).
Table 4: Correlations Between Total Protein Intake, Body Fat Mass, and Total Kcal
Intake of Collegiate Female Basketball Players (N = 13)
Kcal (in) Protein (g) Body Fat Mass (kg)
Spearman's rho Kcal
(intake)
Correlation Coefficient 1.000 .549 .223
Sig. (2-tailed) . .052 .464
Protein (g) Correlation Coefficient .549 1.000 .597
Sig. (2-tailed) .052 . .031
The highest energy surplus and net 24-hr energy balance were both inversely
associated with lean body mass (R = -.577; p = .012, R = -.670; p = -.670). Additionally,
there was a significant inverse association between the lowest energy deficit and lean
body mass (R = -.736; p = .004).
A Kruskal-Wallis H test was conducted to determine if there were differences in
body fat percentage, lean body mass, fat mass, and BMI between tertiles of protein intake
in relative EB (± 400 kcal) (lowest: n = 4, moderate: n = 4, highest: n = 5). Distribution
of body fat mass (p = .694), lean body mass (p = .173), BMI (p = .221), and percentage
body fat (p = .985) were not statistically significantly different between tertiles of protein
30
CHAPTER V
DISCUSSION AND CONCLUSIONS
This study sought to investigate new indices to assess dietary adequacy in
promoting optimal body composition from dietary recall techniques. Typical recall
analysis examines total energy and specific macronutrients in 24-hr time blocks. CTLEA
has been utilized in an attempt to better understand dynamic requirements previously
(Deutz et al. 2000), and the hypotheses were developed and tested to primarily assess
differential energy availability on body composition. Accordingly, the present study was
designed to build upon these findings by expanding the focus into analysis of specific
macronutrient content (protein) in relation to real-time energy balance. This study, like
previous CTLEA analysis (Deutz et al. 2000), observed no association between 24hr net
energy balance and percentage body fat. Our findings suggest that within-day protein
distribution relative to energy balance is associated with BMI. In addition, the greatest
energy balance deficit during the day was inversely associated with lean body mass,
indicative of potentially deleterious effects of energy restriction. However, the present
study failed to detect differences in percentage body fat across within-day energy balance
variables.
There is general agreement that almost all dietary assessment methodologies are
subject to reporting bias; typically in the form of underreporting as opposed to
random, and varies by key health determinants (Garriguet, 2008). The author concluded
that “under-reporting was greater among people who were overweight or obese, those
who were physically active, adults compared with teenagers, and women compared with
men.” (Garriguet, 2008) The present study population meets three out of four
characteristics of inaccurate reporting. Furthermore, the only significant difference in
under-reporting of six classified age groups occurred between men and women in the
19-30 yr old group, with women significantly under-reporting more than men (Garriguet,
2008). Under-reporting is a manifestation of social desirability, and women have been
shown to score higher in the social desirability trait and be influenced more strongly by
social desirability in patterning responses (Herbert et al. 1997). Social desirability is
defined as ‘the tendency to respond in such a way as to avoid criticism’ (Herbert et al.
1997). Essentially, it is telling the investigator what they believe the investigator wants to
hear.
As part of the recruitment process, the student PI and PI were invited to speak
with the basketball team and give a presentation. The presentation provided information
on the importance of relative energy availability in sport, and may have given potential
subjects a model to pattern optimal responses on. Since the presentation described
optimal eating for sport as distributing energy and macronutrient intake to meet dynamic
energy needs, the paradigm may have shifted the desirability trait-derived response from
underreporting (the classical manifestation) to frequent/balanced meals. As previously
cited, this inaccurate reporting would not be random, and overweight/obese respondents
would likely modify reporting to a greater extent (Garriguet et al. 2008). Thus, a potential
social-32
desirability reporting based upon the model of optimal meal patterning demonstrated to
participants before the study.
Subject data is consistent with past CTLEA analysis. Athletes spent a far greater
proportion of the day in an energy deficit (~17 hours) than in a surplus. Additionally, the
subjects averaged spending ~6.5 hours in a sizable energy deficit (<-400 kcal EB), which
has been associated with higher percentage body fat (Deutz et al., 2000). The inverse
association between lowest energy deficit and lean body mass is not surprising, as there is
no inactive storage for amino acids (Volpi et al. 2003) and periods of fasting are
associated with lean tissue losses (Nourouzy et al. 2013). Further, a potential gender
difference exists, where one study found high eating frequency to be associated with
leanness in men, but no link existing between eating frequency and body weight status in
women (Drummond et al., 1998).
The substantial gap between mean total protein intake (79.2g) and protein
estimated to be usable for MPS (49.1g) is cause for concern in this population. The mean
protein intake displayed as g/kg intake was 1.1 g/kg/d; below the ACSM
recommendation of 1.2-1.7 for athletes. When protein over the maximal threshold and
protein ingested in significant energy deficits (< - 400 kcal EB) are controlled for, the
mean intake is 0.69 g/kg/d; approximately half of the low end of the ACSM
recommendation.
The present study does not reveal an overt connection between protein intake
relative to current energy balance on percentage body fat. In particular, we hypothesized
that those with a higher consumption of protein in a positive energy balance (excluding
Statistical analysis failed to detect any difference in body composition amongst protein
intake variables. Likely, nonparametric cross-sectional analysis of single-day dietary
recall was not powerful enough to detect differences very specific protein variables on
body composition in the small study population (N=13). Further limitations include
potential response bias and lack of random selection. An interesting finding is that total
daily protein intake was associated with higher body fat mass. Moreover, a
near-significant trend was detected between total protein intake and percentage body fat (R =
.533; p = .061). No association between total protein intake and total energy intake (the
most logical explanation) was found, however a near-significant trend was observed (R =
.549; p = .052).
CONCLUSIONS
This study is exploratory in nature and was designed to test the validity of new
indices to assess dietary adequacy. However, as old indices (net energy balance, meal
frequency, total protein intake, etc.) did not exhibit associations with body fat percentage
to be considered superior measurements, the question remains unresolved.
The rationale for dynamic analysis of energy balance is sound (Benardot, 1996;
Deutz et al. 2000; Benardot, 2013), and literature elucidating the importance of timing
and distribution of protein intake (Mamerow et al. 2014; Symons et al. 2009; Moore et al.
2009) make the two a natural marriage. The finding that plasma amino acid
concentrations do not linearly correlate with MPS across various time points and that
energy status of the muscle is often the limiting factor (Wilson et al. 2011) further
strengthens the argument to simultaneously investigate energy availability and protein
34
quality into consideration. Experimental control over balanced and skewed protein intake
in various states of energy balance (skewing or balancing energy intake within-day)
would provide clarity to the issue. Complex relationships exist between specific nutrients
and available energy which cannot be explained by simplistic net value analyses. Just as a
human body does not make a single calculation at the end of a 24hr period, we should not
do the same to assess dietary adequacy and expect an accurate representation. Methods of
determining dietary adequacy should no mirror a bomb calorimeters net ‘calories in,
calories out’ model, but instead should reflect the complexity inherent to having an
35
REFERENCES
Anthony JC, Lang CH, Crozier SJ, Anthony TG, MacLean DA, Kimball SR, Jefferson LS. Contribution of insulin to the translational control of protein synthesis in skeletal muscle by leucine. American journal of physiology. Endocrinology and metabolism. May 2002;282(5):E1092-1101.
Atherton PJ, Etheridge T, Watt PW, Wilkinson D, Selby A, Rankin D, Smith K, Rennie MJ. Muscle full effect after oral protein: time-dependent concordance and discordance between human muscle protein synthesis and mTORC1 signaling. The American journal of clinical nutrition. Nov 2010;92(5):1080-1088.
Areta JL, Burke LM, Ross ML, Camera DM, West DW, Broad EM, Jeacocke NA, Moore DR, Stellingwerff T, Phillips SM, Hawley JA, Coffey VG. Timing and
distribution of protein ingestion during prolonged recovery from resistance exercise alters myofibrillar protein synthesis. The Journal of physiology. May 1 2013;591(Pt 9):2319-2331.
Benardot D. Working with young athletes: views of a nutritionist on the sports medicine team. International journal of sport nutrition. Jun 1996;6(2):110-120.
Benardot D. Energy thermodynamics revisited: Energy intake strategies for optimizing athlete body composition and performance. Pensar en Movimiento: Revista de Ciencias del Ejercicio y la Salud (Journal of Exercise Science and Health) 2013; 11(2): 1-13. (Refereed & Invited; Published in English and Spanish)
Biolo G, Fleming RY, Maggi SP, Nguyen TT, Herndon DN, Wolfe RR. Inverse regulation of protein turnover and amino acid transport in skeletal muscle of hypercatabolic patients. The Journal of clinical endocrinology and metabolism. Jul 2002;87(7):3378-3384.
Bohe J, Low JF, Wolfe RR, Rennie MJ. Latency and duration of stimulation of human muscle protein synthesis during continuous infusion of amino acids. The Journal of physiology. Apr 15 2001;532(Pt 2):575-579.
Bouillanne O, Curis E, Hamon-Vilcot, B, Nicolis I, Chretien P, Schauer N, Vincent JP, Cynober L, Aussel C. Impact of protein pulse feeding on lean mass in
36
Campbell WW, Haub MD, Wolfe RR, Ferrando AA, Sullivan DH, Apolzan JW, Iglay HB. Resistance training preserves fat-free mass without impacting changes in protein metabolism after weight loss in older women. Obesity (Silver Spring, Md.). Jul 2009;17(7):1332-1339.
Churchward-Venne TA, Burd NA, Mitchell CJ, West DW, Philp A, Marcotte GR, Baker SK, Baar K, Phillips SM. Supplementation of a suboptimal protein dose with leucine or essential amino acids: effects on myofibrillar protein synthesis at rest and following resistance exercise in men. The Journal of physiology. Jun 1 2012;590(Pt 11):2751-2765.
de Jonge L, Bray GA, Smith SR, Ryan DH, de Souza RJ, Loria CM, Champagne CM, Williamson DA, Sacks FM. Effect of diet composition and weight loss on resting energy expenditure in the POUNDS LOST study. Obesity (Silver Spring, Md.). Dec 2012;20(12):2384-2389.
Deutz RC, Benardot D, Martin DE, Cody MM. Relationship between energy deficits and body composition in elite female gymnasts and runners. Med Sci Sports Exerc, 2000;32(3), 659-668.
Filaire E, Lac G. (2002). Nutritional status and body composition of juvenile elite female gymnasts. J Sports Med Phys Fitness, 42(1), 65-70.
Frost G, Pirani S. Meal frequency and nutritional intake during Ramadan: a pilot study. Human nutrition. Applied nutrition. Feb 1987;41(1):47-50.
Gaine PC, Pikosky MA, Martin WF, Bolster DR, Maresh CM, Rodriguez NR. Level of dietary protein impacts whole body protein turnover in trained males at rest. Metabolism: clinical and experimental. Apr 2006;55(4):501-507.
Garriguet D. Under-reporting of energy intake in the Canadian Community Health Survey. Health reports. Dec 2008;19(4):37-45.
Hebert JR, Ma Y, Clemow L, Ockene IS, Saperia G, Stanek EJ III, Merriam PA, Ockene JK. Gender differences in social desirability and social approval bias in dietary self-report. American journal of epidemiology. Dec 15 1997;146(12):1046-1055.
House BT, Cook LT, Gyllenhammer LE, Schraw JM, Goran MI, Spruijt-Metz D, Weigensberg MJ, Davis JN. Meal skipping linked to increased visceral adipose tissue and triglycerides in overweight minority youth. Obesity (Silver Spring, Md.). May 2014;22(5):E77-84.
Hubert P, King NA, Blundell JE. Uncoupling the effects of energy expenditure and energy intake: appetite response to short-term energy deficit induced by meal omission and physical activity. Appetite. Aug 1998;31(1):9-19.
Kerver JM, Yang EJ, Obayashi S, Bianchi L, Song WO. Meal and snack patterns are associated with dietary intake of energy and nutrients in US adults. Journal of the American Dietetic Association. Jan 2006;106(1):46-53.
Krebs-Smith SM, Guenther PM, Subar AF, Kirkpatrick SI, Dodd KW. Americans do not meet federal dietary recommendations. The Journal of nutrition. Oct
2010;140(10):1832-1838.
Loucks, A. B. Energy availability, not body fatness, regulates reproductive function in women. Exerc Sport Sci Rev, 2003;31(3), 144-148.
Loucks AB. Energy balance and body composition in sports and exercise. Journal of sports sciences. Jan 2004;22(1):1-14.
Loucks, A. B., Kiens, B., & Wright, H. H. Energy availability in athletes. J Sports Sci, 29 Suppl 1, 2011.S7-15. doi: 10.1080/02640414.2011.588958
Mamerow, M. M., Mettler, J. A., English, K. L., Casperson, S. L., Arentson-Lantz, E., Sheffield-Moore, M., Paddon-Jones, D. Dietary protein distribution positively influences 24-h muscle protein synthesis in healthy adults. J Nutr, 144(6), 2014;876-880. doi: 10.3945/jn.113.185280
McCrory MA, Howarth NC, Roberts SB, Huang TT. Eating frequency and energy regulation in free-living adults consuming self-selected diets. The Journal of nutrition. Jan 2011;141(1):148-153.
Moore DR, Robinson MJ, Fry JL, Tang JE, Glover EI, Wilkinson SB, Prior T, Tarnolpolsky MA, Phillips SM. Ingested protein dose response of muscle and albumin protein synthesis after resistance exercise in young men. The American journal of clinical nutrition. Jan 2009;89(1):161-168.
Morse MH, Haub MD, Evans WJ, Campbell WW. Protein requirement of elderly
women: nitrogen balance responses to three levels of protein intake. The journals of gerontology. Series A, Biological sciences and medical sciences. Nov
2001;56(11):M724-730.