Georgia State University Georgia State University
ScholarWorks @ Georgia State University
ScholarWorks @ Georgia State University
Chemistry Theses Department of Chemistry
4-19-2010
Purification and Structural Characterization of a Novel Class of
Purification and Structural Characterization of a Novel Class of
Protein- Based Magnetic Resonance Imaging Contrast Agents
Protein- Based Magnetic Resonance Imaging Contrast Agents
Kendra Lynette Hubbard
Georgia State University, [email protected]
Follow this and additional works at: https://scholarworks.gsu.edu/chemistry_theses
Recommended Citation Recommended Citation
Hubbard, Kendra Lynette, "Purification and Structural Characterization of a Novel Class of Protein- Based Magnetic Resonance Imaging Contrast Agents." Thesis, Georgia State University, 2010.
https://scholarworks.gsu.edu/chemistry_theses/33
This Thesis is brought to you for free and open access by the Department of Chemistry at ScholarWorks @ Georgia State University. It has been accepted for inclusion in Chemistry Theses by an authorized administrator of
PURIFICATION AND STRUCTURAL CHARACTERIZATION OF A NOVEL CLASS OF
PROTEIN-BASED MAGNETIC RESONANCE IMAGING CONTRAST AGENTS
by
KENDRA LYNETTE HUBBARD
Under the Direction of Dr. Jenny J. Yang
ABSTRACT
More than one-third of all Magnetic Resonance Imaging (MRI) scans employ
image-enhancing contrast agents to increase the differential signal intensity between diseased and normal
tissue. Because current clinical contrast agents exhibit low relaxivity (mM-1 s-1), low dose
efficiency, and rapid secretion, we have designed a group of protein-based MRI contrast agents
with multiple gadolinium binding sites. In this study, the developed purification method for Class
ProCA-3 agents allows for a quick and cost-effective way to abstract up to 109 mg of pure, soluble
protein from a 1L E. Coli cell pellet devoid of DNA or RNA “contamination” for extensive animal
studies. Circular dichroism far-UV spectra ensure the metal stability of the agents, revealing
maintenance of their native α-helical structure in the presence and absence of metal ions.
Furthermore, substantial evidence supports the high dose efficiency of these agents, exhibiting up
PURIFICATION AND STRUCTURAL CHARACTERIZATION OF A NOVEL CLASS OF
PROTEIN-BASED MAGNETIC RESONANCE IMAGING CONTRAST AGENTS
by
KENDRA LYNETTE HUBBARD
A Thesis Submitted in Partial Fulfillment of the Requirements for the Degree of
Master of Science
in the College of Arts and Sciences
Georgia State University
Copyright by
PURIFICATION AND STRUCTURAL CHARACTERIZATION OF A NOVEL CLASS OF
PROTEIN-BASED MAGNETIC RESONANCE IMAGING CONTRAST AGENTS
by
KENDRA LYNETTE HUBBARD
Committee Chair: Dr. Jenny J. Yang
Committee: Dr. Aimin Liu Dr. Zhi-Ren Liu Dr. Jenny J. Yang
Electronic Version Approved:
iv DEDICATION
Firstly and above all, I would like to dedicate this work and my future to my Lord and
Saviour Jesus Christ. The provisions you have made for me during this research program and in
every aspect of my life are too many to count! I could never repay you for the insight and
wisdom you have imparted to me thus far in my journey. Thank you for divinely guiding me here
and teaching me many valuable lessons along the way. It is only by your grace and unfailing
love that I have the opportunity to serve you and allow you to shine through me. Lord bless this
work and may it continue to prosper and bring glory to your Holy name.
I would also like to dedicate this work to my family and close friends, both new and old.
To my mother, Irene Hubbard, also known as “boss,” for being my #1 supporter and always
encouraging me to live out my dreams. To my dad, Kenneth Hubbard, for all of your refreshing
ideas on how I can apply the skills I have acquired to maximize my career potential. To my
brother and sister, Alista and K.J., for being my absentee roommates this past year lol! You have
lovingly created a home for us all to share. To my brother from another mother, Xiaojun
“Maximillo” Xu, for pure, unrestricted friendship and the countless encouraging speeches that
we have had. You truly are the big brother God has blessed me with. Last, but not least, I would
like to thank all of my true friends. I prayed to the Lord for true friends from whom we could
both enrich each other’s lives by bringing glory to His name and one by one, the Lord lovingly
sent you to me. Each of you has encouraged me and believed in the vision that the Lord has for
me, even when I failed to do so. I’m so glad you all have joined me on this journey and I look
forward to the many great experiences we will share. I love you all!
v ACKNOWLEDGEMENTS
I must express great gratitude to Dr. Jenny Yang and Georgia State University for giving
me the opportunity to expand my foundational knowledge on biochemical principles and for
challenging me to grow into an outstanding scientist. My relationship with Dr. Yang began as
my principle investigator and has now evolved into becoming both one of my mentors and a
supportive friend. Her passion for her research continues to inspire me to chase after and reach
for my dreams. I would also like to thank senior graduate student Shenghui “David” Xue for
ushering me into this project and teaching me the necessary skills to critically analyze the
observed results. A special thanks is due to Dr. Jin Zhou for his aid in helping me to design and
interpret the data of many relaxivity experiments. I’d also like to thank Jie “Jasmine” Jiang for
her willingness to answer countless questions and offer advice regarding many elements of my
project. Last, but not least, I would like to thank the rest of Dr. Yang’s lab for their noteworthy
suggestions during our group discussions and for their overall support in the lab.
This work was supported in part by a supplemental grant received from the Department
of Health and Human Services of the National Institutes of Health, which aids in promoting
vi TABLE OF CONTENTS
DEDICATION iv
ACKNOWLEDGEMENTS v
LIST OF TABLES x
LIST OF FIGURES xi
CHAPTER 1. INTRODUCTION ... 1
1.1. Modern Methods for Medical Imaging ... 1
1.1.1. Background ... 1
1.1.2. Principles of MRI and the Use of Contrast Agents ... 3
1.1.3. Factors Contributing to MRI Relaxivity... 7
1.3. Criteria for Contrast Agent Design ... 13
1.4. Theory Preceding the Development of Protein-Based Contrast Agents ... 14
1.5. Designed Multi-Binding Site Contrast Agents by Protein Engineering ... 15
1.7. Overview of Objectives ... 18
2. MATERIALS AND METHODS ... 21
2.1. Cloning and Transformation ... 21
2.2. Protein Overexpression ... 22
2.2.1. Pilot Expression ... 22
2.2.2. Innoculation ... 23
2.2.3. Overexpression ... 23
2.3. Tagless Purification ... 26
vii
2.3.2. Nucleic Acid Precipitation ... 27
2.3.3. Ion Exchange Chromatography ... 29
2.3.4. Protein Concentration Calculation ... 31
2.4. Circular Dichroism ... 32
2.5. Fluorescence Spectroscopy ... 36
2.6. Relaxometry ... 39
3. EXPRESSION AND PURIFICATION RESULTS ... 41
3.1. Background ... 41
3.2. Expression Results ... 41
3.3. Optimizing the Purification Protocol ... 48
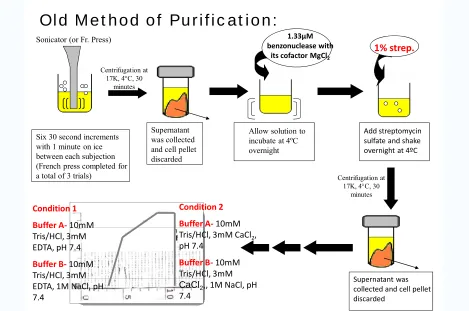
3.3.1. Old Purification Method and Its Limitations ... 48
3.3.2. Streptomycin Variation to Reduce Nucleic Acid Concentration in the Supernatant . 55 3.3.3. Modified FPLC Program ... 61
3.4. Final Yield ... 67
4. CONFORMATIONAL ANALYSIS AND METAL STUDIES ... 70
4.1. Background ... 70
4.2. Magnesium-Induced Structural Effects ... 71
4.2.1. ProCA-30 ... 72
4.2.2. ProCA-31 ... 72
4.2.3. ProCA-32 ... 73
4.2.4. ProCA-33 ... 74
4.3. Calcium-Induced Structural Effects ... 75
viii
4.3.2. ProCA-31 ... 76
4.3.3. ProCA-32 ... 77
4.3.4. ProCA-33 ... 78
4.4. Gadolinium-Induced Structural Effects ... 79
4.4.1. ProCA-30 ... 79
4.4.2. ProCA-31 ... 80
4.4.3. ProCA-32 ... 81
4.4.4. ProCA-33 ... 82
4.5. Terbium-Induced Structural Effects ... 83
4.5.1. ProCA-30 ... 83
4.5.2. ProCA-31 ... 84
4.5.3. ProCA-32 ... 85
4.5.4. ProCA-33 ... 86
4.6. Summary of Metal-Dependent Secondary Structural Changes ... 87
5. RELAXIVITY MEASURES ... 93
5.1. Introduction ... 93
5.3. Traditional Methods for Measurement ... 96
5.4. Measuring Relaxivity by Fixing [Gd3+] and Increasing Protein Concentration ... 116
5.4.1. Protocol Optimization Using ProCA-30 ... 116
5.4.2. ProCA-31 ... 121
5.4.3. ProCA-32 ... 122
5.4.4. ProCA-33 ... 125
ix
6. FINAL CONCLUSIONS AND FUTURE WORK ... 133
x LIST OF TABLES
Table 1.1. Summary of the discussed members of Class ProCA-3 agents. ... 20
Table 3.1. ProCA-3 Purification Yields ... 68
Table 4.1. pH Effects Observed Before and After the Addition of EGTA. ... 90
Table 5.1. In vitro relaxivity of designed contrast agents under low salt conditions. ... 97
xi LIST OF FIGURES
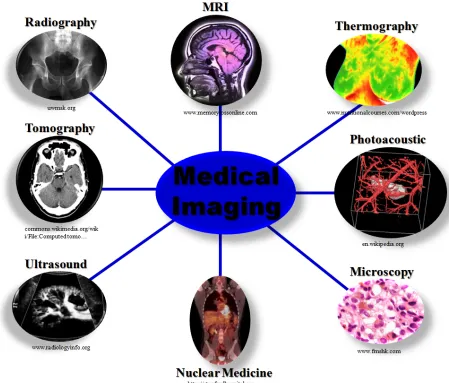
Figure 1.1. Summary of current clinically applied imaging techniques for disease diagnosis... 2
Figure 1.2. Simplified schematic illustration of the intrinsic properties of the hydrogen proton in its original state. (A) Hydrogen proton spinning about its axis. (B) Generated angular momentum from the proton spin. ... 4
Figure 1.3. Simplification of the basic principles underlying MRI. ... 6
Figure 1.4. FDA Approved Commercial Contrast Agents [12]. ... 9
Figure 1.5. The need for improved MRI gadolinium-based contrast agents. (A) Low relaxivity of commercial contrast agents compared to theoretical values. (B) Explanations for low observed relaxivity for commercial agents [7-8, 15]. ... 10
Figure 1.6. Visible symptoms or signs of NSF/NSD [16-17]. ... 11
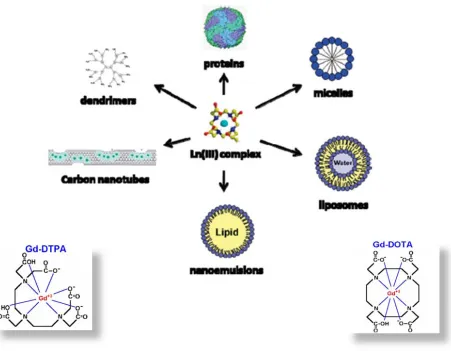
Figure 1.7. Current MRI contrast agent development. ... 12
Figure 1.8. Pymol structure of rat-derived α-parvalbumin. ... 16
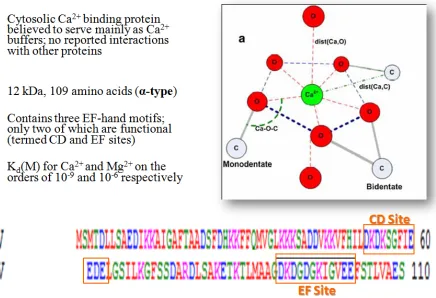
Figure 1.9. Summarizing the CD and EF binding domains of α-parvalbumin and their pentagonal bipyramidal geometries. ... 17
Figure 2.1. pET-22b(+) vector for Class ProCA-3 overexpression [30]. ... 21
Figure 2.2. Summary of the Expression Procedures for ProCA3 Agents. ... 25
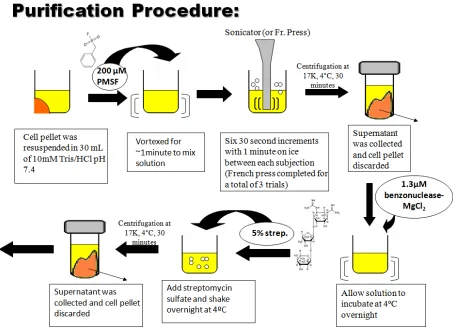
Figure 2.3. Summary of ProCA3 Purification Procedures. ... 30
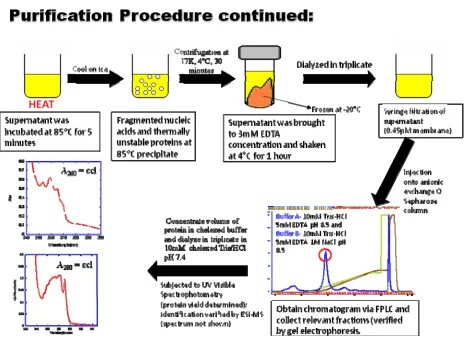
Figure 2.4. Summary of Purification Procedures Continued. ... 31
Figure 2.5.Published UV spectrum of Parvalbumin. (A) Wildtype. (B) Parvalbumin-F103W; Dashed line, metal-free form; solid line, Ca2+ loaded form [25, 35]. ... 32
xii Figure 2.7. Chemical structure of rhodamine-5N tripotassium salt used in fluorescence titrations
[38]. ... 37
Figure 2.8. Fluorescence spectrum of free metal titration experiment. ... 38
Figure 3.1. Cellular growth curve of pilot expression results. ... 42
Figure 3.2. SDS-PAGE gel pilot expression results. ... 43
Figure 3.3. SDS-PAGE gel results following pilot expression cell fractionation. ... 44
Figure 3.4. 30 Overexpression. (A) E. Coli 30 cellular growth curve. (B) ProCA-30 overexpression in E. Coli BL-21 pLys (DE3) cells in LB media. ... 45
Figure 3.5. ProCA-31 Overexpression. (A) E. Coli 31cellular growth curve. (B) ProCA-31 overexpression in E. Coli BL-21 pLys (DE3) cells in LB media. ... 46
Figure 3.6. 32 Overexpression. (A) E. Coli 32 cellular growth curve. (B) ProCA-32 overexpression in E. Coli BL-21 pLys (DE3) cells in LB media. ... 47
Figure 3.7. 33 Overexpression. (A) E. Coli 33 cellular growth curve. (B) ProCA-33 overexpression in E. Coli BL-21 pLys (DE3) cells in LB media. ... 48
Figure 3.8. Original purification protocol prior to modifications. ... 49
Figure 3.9. ProCA-30 Old Purification Protocol Results. (A) SDS-PAGE from purification. (B) FPLC Condition 1 in the absence of calcium. (C) Left to Right: FPLC Condition 2 results in the presence of calcium and UV-Spectrum results of collected fractions. ... 50
xiii Figure 3.11. ProCA-32 Old Purification Protocol Results. (A) SDS-PAGE from purification. (B)
FPLC Condition 1 in the absence of calcium. (C) FPLC Condition 2 results in the presence of
calcium. (D) UV-Spectrum results of collected fractions. ... 52
Figure 3.12. ProCA-33 Old Purification Protocol Results. (A) SDS-PAGE from purification. (B)
FPLC Condition 1 in the absence of calcium. (C) FPLC Condition 2 results in the presence of
calcium. (D) UV-Spectrum results of collected fractions. ... 53
Figure 3.13. Varying Strep. Treatment Conditions to S56D and E60D. (A) PV-S56D results. (B)
PV-E60D results. ... 57
Figure 3.14. PV-G99D varying streptomycin sulfate treatment agarose gel results. (A)
Streptomycin screening for optimal conditions. (B) Changes in nucleic acid concentration at 5%
streptomycin sulfate. ... 60
Figure 3.15. Typical FPLC chromatogram of ProCA-3 agents by Q-column separation and the
UV absorbance of each fraction. ... 62
Figure 3.16. Mass spectrometry results of peaks 2 and 3 from the modified purification protocol.
... 63
Figure 3.17. ProCA-30 Purification. (A) SDS-Page results of purification process. (B) FPLC
chromatogram depicting isolation of target variant. ... 64
Figure 3.18. ProCA-31 Purification. (A) SDS-Page results of purification process. (B) FPLC
chromatogram depicting isolation of target variant. (C) Relevant SDS Page results from FPLC
separation. ... 65
Figure 3.19. ProCA-32 Purification. (A) SDS-Page results of purification process. (B) FPLC
chromatogram depicting isolation of target variant and relevant SDS Page results from FPLC
xiv Figure 3.20. ProCA-33 Purification. (A) SDS-Page results of purification process. (B) FPLC
chromatogram depicting isolation of target variant and relevant SDS Page results from FPLC
separation. ... 67
Figure 3.21. Maldi-TOF results confirming identity and purity of isolated members of Class
ProCA-3 agents. ... 68
Figure 3.22. Final UV absorbance spectra of class ProCA-3 agents. ... 68
Figure 4.1.Published Far-UV spectrum of wildtype parvalbumin; Dashed line, metal-free form;
solid line, Ca2+ loaded form [39]. ... 70
Figure 4.2. Far UV spectra of 6 µM ProCA-30 in the presence varying protein to magnesium
ratios. (A) Low salt conditions. (B) High salt conditions. A buffer of 10mM Tris/HCl chelex pH
7.4 100mM NaCl was used. ... 72
Figure 4.3. Far UV spectra of 6 µM ProCA-31 in the presence varying protein to magnesium
ratios. (A) Low salt conditions. (B) High salt conditions. A buffer of 10mM Tris/HCl chelex pH
7.4 (100 mM NaCl) was used. ... 73
Figure 4.4. Far UV spectra of 6 µM ProCA-32 in the presence varying protein to magnesium
ratios. (A) Low salt conditions. (B) High salt conditions. A buffer of 10mM Tris/HCl chelex pH
7.4 (100 mM NaCl) was used. ... 74
Figure 4.5. Far UV spectra of 6 µM ProCA-33 in the presence varying protein to magnesium
ratios. (A) Low salt conditions. (B) High salt conditions. A buffer of 10mM Tris/HCl chelex pH
7.4 (100 mM NaCl) was used. ... 75
Figure 4.6. Far UV spectra of 6 µM ProCA-30 in the presence varying protein to calcium ratios.
(A) Low salt conditions. (B) High salt conditions. A buffer of 10mM Tris/HCl chelex pH 7.4
xv Figure 4.7. Far UV spectra of 6 µM ProCA-31 in the presence varying protein to calcium ratios.
(A) Low salt conditions. (B) High salt conditions. A buffer of 10mM Tris/HCl chelex pH 7.4
(100 mM NaCl) was used. ... 77
Figure 4.8. Far UV spectra of 6 µM ProCA-32 in the presence varying protein to calcium ratios.
(A) Low salt conditions. (B) High salt conditions. A buffer of 10mM Tris/HCl chelex pH 7.4
(100 mM NaCl) was used. ... 78
Figure 4.9. Far UV spectra of 6 µM ProCA-33 in the presence varying protein to calcium ratios.
(A) Low salt conditions. (B) High salt conditions. A buffer of 10mM Tris/HCl chelex pH 7.4
(100 mM NaCl) was used. ... 79
Figure 4.10. Far UV spectra of 6 µM ProCA-30 in the presence varying protein to gadolinium
ratios. (A) Low salt conditions. (B) High salt conditions. A buffer of 10mM Tris/HCl chelex pH
7.4 (100 mM NaCl) was used. ... 80
Figure 4.11. Far UV spectra of 6 µM ProCA-31 in the presence varying protein to gadolinium
ratios. (A) Low salt conditions. (B) High salt conditions. A buffer of 10mM Tris/HCl chelex pH
7.4 (100 mM NaCl) was used. ... 81
Figure 4.12. Far UV spectra of 6 µM ProCA-32 in the presence varying protein to gadolinium
ratios. (A) Low salt conditions. (B) High salt conditions. A buffer of 10mM Tris/HCl chelex pH
7.4 (100 mM NaCl) was used. ... 82
Figure 4.13. Far UV spectra of 6 µM ProCA-33 in the presence varying protein to gadolinium
ratios. (A) Low salt conditions. (B) High salt conditions. A buffer of 10mM Tris/HCl chelex pH
xvi Figure 4.14. Far UV spectra of 6 µM ProCA-30 in the presence varying protein to terbium ratios.
(A) Low salt conditions. (B) High salt conditions. A buffer of 10mM Tris/HCl chelex pH 7.4
(100 mM NaCl) was used. ... 84
Figure 4.15. Far UV spectra of 6 µM ProCA-31 in the presence varying protein to terbium ratios.
(A) Low salt conditions. (B) High salt conditions. A buffer of 10mM Tris/HCl chelex pH 7.4
(100 mM NaCl) was used. ... 85
Figure 4.16. Far UV spectra of 6 µM ProCA-32 in the presence varying protein to terbium ratios.
(A) Low salt conditions. (B) High salt conditions. A buffer of 10mM Tris/HCl chelex pH 7.4
(100 mM NaCl) was used. ... 86
Figure 4.17. Far UV spectra of 6 µM ProCA-33 in the presence varying protein to terbium ratios.
(A) Low salt conditions. (B) High salt conditions. A buffer of 10mM Tris/HCl chelex pH 7.4
(100 mM NaCl) was used. ... 87
Figure 4.18. CD Spectrum of 6 µM ProCA-31 in the Presence of 5mM Metals. (A) In the
presence of 5mM EGTA. (B) No EGTA treatment. ... 88
Figure 4.19. CD Spectrum of 6 µM ProCA-32 in the Presence of 5mM Metals. (A) In the
presence of 5mM EGTA. (B) No EGTA treatment. ... 88
Figure 4.20. CD Spectrum of 6 µM ProCA-33 in the Presence of 5mM Metals in the absence of
EGTA. ... 89
Figure 4.21. Class ProCA-3 metal binding ability. ... 92
5.1. Optimizing Relaxivity Sample Prep Conditions. (A) Volumetric observations. (B)
Incubation time assay. (C) Metal equilibration schemes. ... 95
Figure 5.2. ProCA-30 T1 and T2 Signal Intensity Plots per traditional relaxivity methodology.
xvii Figure 5.3. ProCA-30 R1 and R2 linear plots of 1/T1,2 vs. protein concentration. (A) Linear plots
under low salt conditions. (B) Linear plots under high salt conditions. ... 101
Figure 5.4. ProCA-31 T1 and T2 Signal Intensity Plots per traditional relaxivity methodology. (A) Signal intensity under low salt conditions. (B) Signal intensity under high salt conditions.103 Figure 5.5. ProCA-31 R1 and R2 linear plots of 1/T1,2 vs. protein concentration. (A) Linear plots under low salt conditions. (B) Linear plots under high salt conditions. ... 105
Figure 5.6. ProCA-32 T1 and T2 Signal Intensity Plots per traditional relaxivity methodology. (A) Signal intensity under low salt conditions. (B) Signal intensity under high salt conditions.107 Figure 5.7. ProCA-32 R1 and R2 linear plots of 1/T1,2 vs. protein concentration. (A) Linear plots under low salt conditions. (B) Linear plots under high salt conditions. ... 109
Figure 5.8. ProCA-33 T1 and T2 Signal Intensity Plots per traditional relaxivity methodology. (A) Signal intensity under low salt conditions. (B) Signal intensity under high salt conditions.112 Figure 5.9. ProCA-33 R1 and R2 linear plots of 1/T1,2 vs. protein concentration. (A) Linear plots under low salt conditions. (B) Linear plots under high salt conditions. ... 114
Figure 5.10. ProCA-30 T1 and T2 Signal Intensity Plots per fixed 10, 50, and 100µM Gd3+ concentration. ... 117
Figure 5.11. Relaxivity curves of ProCA-33 at different fixed concentrations of Gd3+. (A) ProCA-30 at fixed 10µM [Gd3+]. (B) ProCA-30 at fixed 50µM [Gd3+]. (C) ProCA-30 at fixed 100µM [Gd3+]. ... 119
Figure 5.12. ProCA-31 T1 and T2 signal intensity plots at a fixed [Gd3+] of 100µM. ... 121
Figure 5.13. Relaxivity curves of ProCA-31 at a fixed 100µM concentration of Gd3+... 122
Figure 5.14. ProCA-32 T1 and T2 signal intensity plots at a fixed [Gd3+] of 100µM. ... 124
xviii Figure 5.16. ProCA-33 T1 and T2 signal intensity plots at a fixed [Gd3+] of 100µM. ... 126
Figure 5.17. Relaxivity curves of ProCA-33 at a fixed 100µM concentration of Gd3+... 126
Figure 5.18. ProCA-33 reverse titration for binding mode determination. ... 127
Figure 5.19. Determination of excess EDTA in contrast agent samples. (A) Fluorescence
intensity spectrum of ProCA-31. (B) Fluorescence intensity spectrum of ProCA-32. (C)
Fluorescence intensity spectrum of ProCA-33. Sample conditions: 1µM rhodamine-5N, 50µM
protein in 10mM Tris 100mM NaCl chelex pH 7.44... 128
1
1. INTRODUCTION
1.1.Modern Methods for Medical Imaging
1.1.1. Background
Medical imaging is a clinical discipline referring to the techniques and processes used to
create in vivo images of the human body for clinical applications or medicinal science [1]. In its
broadest sense, the incorporation of radiology, medical photography, nuclear medicine,
investigative radiological sciences, endoscopy, thermography and microscopy allows this
division of the medical field to improve diagnoses and medical care for patients [1-2]. When
applied effectively, medical imaging enables less-invasive prognosis and diagnosis, detects
disease at its earliest and most curable stage, and allows for decreased post-treatment disability,
leading to greater patient comfort and improved treatment selection. Thus, this standard of
modern medical care not only “continues to empower doctors and medical professionals to view
the human body and its organ systems with ever increasing clarity and accuracy” but as a result,
has the potential to drastically reduce the cost of healthcare by shortening hospital stays due to
faster recovery times. This is evidenced by fewer pre- and post-operative complications [2].
Therefore, the clinical and medicinal scientific communities are actively developing a number of
different imaging techniques, striving to improve their role in disease prognosis, diagnosis, and
2 Figure 1.1. Summary of current clinically applied imaging techniques for disease diagnosis.
The availability of a wide variety of imaging techniques allows the physician and
relevant medical staff to optimize patient treatment outcomes. In most cases, one or more of the
techniques are combined with another to effectively diagnose and treat a patient [2].
Although medical imaging technologies provide a wide range of clinical and patient
benefits, many of the techniques use X-ray radiation (X-rays and CT scans), posing
dose-dependent risks to patients. The “approach taken by the FDA is that the slight risk from radiation
3 there are alternative imaging techniques that function without the use of radiation and allow for
excellent resolution between diseased and normal tissue. For example, like Computed
Tomography (CT), MRI also has the ability to create a two- and three-dimensional image of a
thin slice of the body. However, unlike CT, MRI does not involve the use of ionizing radiation
and is therefore not associated with the same health hazards such as the possibility of inducing
cancer due to absorbed X-rays. Additionally, in contrast to X-ray and CT methodologies, there
are no limitations to the number of MRI scans a patient can receive [1]. Although MRI can
provide high-resolution images via optimized instrumental parameters and pulse sequences, it
has a low sensitivity and achieves better images with supplementation of a contrast agent that
increases the signal to noise ratio detected by changes in water relaxivity. Thus, the development
of MRI contrast enhancing agents proves as an excellent technique to further improve medical
imaging and thus medical diagnoses and treatment [3].
1.1.2. Principles of MRI and the Use of Contrast Agents
MRI is a non-invasive nuclear magnetic resonance (NMR) imaging technique that exploits
the magnetic properties of hydrogen and its interaction with both a large external magnetic field
and radiowaves to produce high resolution three-dimensional images of the body for disease
diagnosis [4]. Although biological tissues are predominantly 12C, 16O, 1H, and 14N, hydrogen is
the most abundant [5]. The majority of hydrogen protons observed in clinical imaging are of
water molecules because they “have a significant magnetic moment and are nearly 70%
abundant in the human body” [4-5]. As will be later explained, the varying molecular structures
and the amount of hydrogen in various tissues affect how the protons behave in an external
4 The principles detailing the mechanism behind MRI signals are complex. From a simplified
“classical” view, the nucleus of an atom is composed of subatomic particles protons and neutrons
that spin about their axis [4]. More relevant to MRI signals, each nuclei of the hydrogen atoms in
solution contain a single proton spinning about its axis, producing an angular momentum (J) and
a magnetic moment (µ) (Figure 1.2) [4].
Figure 1.2. Simplified schematic illustration of the intrinsic properties of the hydrogen proton in its original state. (A) Hydrogen proton spinning about its axis. (B) Generated angular momentum from the proton spin.
The following equations are descriptive of the angular momentum and the magnetic moment:
J = mω = mvr (Equation 1.1)
where m is the mass of the proton, v is the velocity of the proton, and r is the radius or distance
of the proton from the fulcrum [5], and
µ = τmax / B (Equation 1.2)
where τmax is the maximum torque generated and B is the magnetic field generated by the
movement of the proton [5].
The angular momentum and magnetic property of the nuclei mentioned above stems from the
5 neutrons possess a net angular momentum of zero while those with an odd mass or odd atomic
number (protons) possess a certain angular momentum and have net spins of one of two possible
orientations characterized by magnetic quantum number of ± 1/2. For the purposes of MRI and
NMR, atoms with paired spins tend to cancel so atoms containing an odd number of protons (like
hydrogen) or neutrons are ideal for observing changes in the local magnetic field [5]. These net
spins generate small magnetic fields due to their vibrational and rotational motions, giving rise to
the magnetic moment. The ratio between the angular momentum and magnetic moment of the
nuclei gives rise the gyromagnetic ratio (γ), a constant specific to each magnetically active nuclei
(Equation 1.3) [5]. The gyromagnetic ratio of hydrogen is 42.6 MHz/Tesla [6].
µ = γJ (Equation 1.3)
In the absence of an external magnetic field, these charged nuclei are in a lower energy
level and have randomly oriented spins of equal energy. When an external magnetic field (B0) is
applied, the axis of rotation of the nuclei will precess around that of the applied magnetic field.
The frequency of precession is termed Larmor frequency, a parameter that must be optimized for
efficient relaxation of a contrast agent [7]. Subsequently, in this excited state, the spins of the
nuclei will align parallel or antiparallel (with or opposed) to the magnetic field. Combined with
the magnetic and electromagnetic fields, MRI uses non-ionizing radiation radiowaves in the
form of a radiofrequency pulse (RF) to manipulate the magnetization of protons and perturb their
alignment to the external magnetic field. As the radiofrequency pulse is removed, the spins of the
nuclei decay from the higher energy state to their lower energy state through a process termed
relaxation. It’s important to note that there are radiofrequency pulse sequences designed to
highlight T1 and T2 changes, two distinct relaxation processes [8]. The change in “distribution
6 relaxation constitutes the MRI signal [8]. The basic principles of MRI are summarized in Figure
1.3.
Figure 1.3. Simplification of the basic principles underlying MRI.
There are two dominant relaxation processes: spin-lattice (longitudinal) relaxation and
spin-spin (transverse) relaxation [9]. The nuclei spins aligned parallel or perpendicular to the
external magnetic field are generally dominated by spin-lattice relaxation time T1. The lattice is
descriptive of the sample in which the nuclei are held. The lattice field results from the magnetic
field caused by the vibrational and rotational frequencies of the nuclei [9]. Components of the
lattice field can interact with high energy state nuclei and cause them to lose energy, relaxing
them back to their lower energy state. The average time -it takes for the higher energy state
nuclei to relax to a lower energy state with respect to the lattice field is termed longitudinal
relaxation time T1 and is dependent on the gyromagnetic ratio of the nucleus and the mobility of
the lattice [9]. Not only are the spins of nuclei in the presence of an external magnetic field
7 precessional frequencies but differing magnetic quantum states. Though there is no net change in
Boltzmann distribution of the nuclei, a nucleus in the lower energy level will be excited while an
excited nucleus relaxes to the lower energy state. The average time it takes for the higher energy
state nuclei to relax to a lower energy state with respect to neighboring nuclei is termed
transverse relaxation time T2 [9].
Because the detection sensitivity of MRI is low, it often requires a contrast agent to
enhance the signal intensity related to the relaxation rate of water protons [8]. The term
relaxivity describes how effective a contrast agent is at enhancing the signal intensity by
shortening proton relaxation times. Contrast agents influencing the relaxation times of water
protons must be paramagnetic, those found amongst the transition metals and lanthanides,
meaning they possess a number of unpaired electrons. Here, proton relaxivity is directly
proportional to the efficiency of the paramagnetic ion to enhance the relaxation rate of water
protons [8]. Gadolinium, bearing seven unpaired electrons, has been found to exhibit the
strongest effect of all elements on T1. This is due to the dipole-dipole interactions between
proton nuclear spins and the fluctuating local magnetic field caused by the unpaired electron
spins of gadolinium [8]. Because free ions of heavy metals are toxic, lanthanides are typically
complexed with a suitable metal chelator/ligand. When the metal is bound to the chelator, it
gives rise to a contrast agent capable of influencing water relaxation.
1.1.3. Factors Contributing to MRI Relaxivity
There are a number of molecular parameters of contrast agents that govern relaxivity:
rotational diffusion, inner- and outer/second-sphere hydration (q), water exchange rates (kex),
ion-proton distances, and the electronic properties (Tie) of the paramagnetic ion [8]. The strength
8 Proton exchange rate, rotational correlation time, electronic relaxation times, Gd-proton
distance, and hydration number directly influence the inner sphere proton relaxivity [8]. If the
proton exchange is very slow relative to the relaxation rate of the coordinated protons to
gadolinium, then it will become a limiting factor, hampering optimal relaxation. If the proton
exchange is fast relative to the coordinated protons, proton relaxivity will be largely determined
by the relaxation rate of the coordinate protons [8].
Maximum relaxivity is attained when the correlation time (τci) equals the inverse proton
Larmour frequency (ωi) [8]. The correlation times characteristic of the relaxation processes are
as follows:
1/τci = 1/τR + 1/Tie + 1/τm = ωi, where i = 1, 2 [8]. (Equation 1.4)
More importantly, the rotational correlation time (τR), proton exchange (kex = 1/τm), and
electronic relaxation rates (T1,2e)must be optimized simultaneously to achieve maximum
relaxivities. Equation 1.5 addresses the effects of inner sphere relaxivity and how manipulation
of its terms can increase the overall relaxivity of a contrast agent.
r1IS = (q/[H2O])/ (T1m + τM) [8, 10] (Equation 1.5)
where r1IS is the relaxivity due to the inner sphere of water surrounding a paramagnetic metal
ion, q is the hydration number, [H2O] is the water concentration in mM, T1m is the T1 of the
water hydrogen in the inner sphere, and τM is the water residency time (τM = 1/kexchange of water
in the inner sphere). This equation reveals that an increase in hydration (q) or decrease in T1m or
τM can increase the overall relaxivity of a contrast agent [10]. However, the FDA approved
gadolinium-based contrast agents have not effectively optimized these parameters.
9 Currently, it has been estimated that 40-50% of all MR images are supplemented with a
contrast agent [11]. Gadolinium-based contrast agents are implicated to achieve a number of
these images. The six FDA approved commercial gadolinium-based MRI contrast agents are
T1-weighted agents, meaning they yield brightened images when introduced into a system (Figure
1.4).
Figure 1.4. FDA Approved Commercial Contrast Agents [12].
The basic chelate design ranges from linear to acyclic structures. Because of their enhanced
thermodynamic stability and kinetic inertness, Gd3+-based MRI contrast agents derived from
DOTA-like macrocyclic ligands have advantages over their linear counterparts (DTPA) [13].
Overall, these small molecular Gd-chelates maintain relaxivities of 4-6 mM-1 s-1 [14]. However,
these agents have theoretically attainable relaxivity values of over 100 mM-1 s-1 (Figure 1.5A). It
has been proposed that they fail to reach their maximum relaxivity due to their fast rotation time
10 Figure 1.5. The need for improved MRI gadolinium-based contrast agents. (A) Low relaxivity of commercial contrast agents compared to theoretical values. (B) Explanations for low observed relaxivity for commercial agents [7-8, 15].
Furthermore, the aforementioned contrast agents are only effective at high concentrations
(>0.1 mM) [10]. Currently, the average clinical injection dosage of commercial contrast agents is
approximately 500 mM/kg at an injection rate of 2-3 mL/s to achieve high sensitivity to the
changes in water relaxation [14]. Even higher doses are required for imaging of blood vessels in
Magnetic Resonance Angiograpy (MRA) [14]. Because of their small size, the systemic
retention time of these agents is relatively short, maintaining a half-life of 1.5-2 hours in healthy
adults and thus requiring a large dose to achieve an enhanced image [14]. However, in patients
with kidney disease, the renal clearance is significantly decreased. Studies have shown that
kidney-impaired patient exposure to gadolinium-based contrast agents has been linked to local
necrosis at the injection site and nephrogenic systemic fibrosis (NSF) or nephrogenic systemic
dermopathy (NSD) due to their weak binding affinity to gadolinium leading to the release of free
gadolinium in the body and the accumulation of the contrast agent in the kidney (lack of proper
11 Figure 1.6. Visible symptoms or signs of NSF/NSD [16-17].
NSF/NSD is a life-threatening disorder that may develop over a short period of days to several
weeks (full development) [18]. As shown in Figure 1.6, it is characterized by swelling and
tightening of the skin, usually limited to the extremities, and severely affected patients may be
unable to walk, or fully extend the joints of their arms, hands, legs, and feet [18]. More
specifically, the release of free gadolinium correlated with NSF has been known to cause many
toxic systemic effects such as inhibiting calcium-flux-dependent physiological processes,
blocking many voltage-gated calcium channels at nano- to micro-molar concentrations, and
depressing the reticuloendothelial system [14, 19]. For this reason, in May 2007, the FDA issued
a black box label warning to be placed on five of the six approved gadolinium-based contrast
agents (with the exception of Dotarem®) in the United States, warning health professionals and
patients of the association between the use of gadolinium-based contrast agents and NSF [20].
Because of their low dose efficiency due to low relaxivity and to low retention time and health
hazards, there has been considerable effort to effectively improve contrast agent design and
12 optimal retention times can be detected at lower doses, providing greater signal contrast images
at equivalent doses to commercial compounds with lower relaxivity [10].
The demand for the development of improved MRI contrast agents has become increasingly
widespread. The two primary approaches taken by the scientific community to increase
molecular relaxivity are optimization of the aforementioned molecular parameters that govern
relaxivity and linking multiple gadolinium tetraazacyclododecanetetraacetic acid (DOTA) or
[image:33.612.81.532.269.620.2]diethylenetriaminopentaacetic acid (DTPA) complexes together (Figure 1.7) [10].
Figure 1.7. Current MRI contrast agent development.
These newly developed classes of contrast agents predominantly address the rapid rotational
13 biomolecules such as dendrimers, carbon nanotubes, nanoemulsions, liposomes, micelles, or
proteins [21]. However, while these agents address the overall rotational time associated with
molecular tumbling in solution, they do not achieve significantly higher relaxivities than the
commercial analogues due to their intrinsic internal mobility and restricted water exchange rate
[3]. Furthermore, their large particle size (10-100 nm) prevents them from being properly
excreted from the body, raising greater toxicity concerns of gadolinium-based agents. As a
result, a novel class of protein-based MRI contrast agents has been designed with high dose
efficiency due to higher relaxivity, strong metal stability, and optimized pharmokinetics.
1.3.Criteria for Contrast Agent Design
Because contrast agents have the potential to be invaluable clinical probes for enhancing
magnetic resonance images, it is of crucial importance to design an agent with a high relaxivity,
strong binding affinity to gadolinium versus other physiological metal ions, and high
metallo-structural stability. The achieved higher relaxivity agent will not only improve the sensitivity of
MR imaging, but also greatly reduce the amount of agent necessary to achieve significant
contrast. Thus, the dose efficiency of the contrast agent is increased, providing higher contrast
capability due to the incorporation of multiple designed gadolinium-binding sites into a scaffold
structure and to obtaining an optimal τR in the nanosecond range. The strong binding affinity of
the designed contrast agent to gadolinium will confer high metal selectivity to avoid potential
adverse competition from other systemic metals and alleviate many of the toxic concerns
associated with the release of free gadolinium into the system. Furthermore, heightened
structural tolerance of mutations, high blood serum stability, and high solubility will reduce the
potential instability of the scaffold contrast agent design. To add to the previously mentioned
14 interactions with other biomolecules, possess an optimal systemic retention time to successfully
acquire an MR image, and be properly excreted via the kidneys or liver metabolism.
1.4.Theory Preceding the Development of Protein-Based Contrast Agents
Dr. Jenny Yang’s lab of Georgia State University has developed a novel approach to
designing improved contrast agents via protein engineering. Protein-based MRI contrast agents
offer a number of advantages compared to the aforementioned commercial analogs. To improve
relaxivity, proteins can be modified to achieve an optimal metal-site rotational time of 10ns,
optimal hydration of inner and second-sphere hydration, and optimal water exchange rates of
1-30ns [3, 8]. The obtained higher relaxivity will improve the dose efficiency associated with
gadolinium-based MRI contrast agents. Therefore, a lower concentration and volume of agent
will be required to significantly improve the contrast to noise ratio of MR images, reducing the
potential for the toxic effects associated with NSF/NSD. Their modifiable, compact molecular
size (12 kDa) is suitable for sufficient intravascular distribution and easy renal excretion.
Additionally, choosing a stable host protein tolerant of various mutations, affords the opportunity
to design gadolinium-binding sites into its structure and confer metal selectivity via tuned metal
binding affinity [3]. Improved solubility and reduced immunogenicity can be achieved by
covalently attaching polyethylene glycol (PEG) chains to lysine or cysteine residues of the
protein [22]. Using this approach to develop improved agents, Dr. Yang’s lab previously
designed and conducted significant studies on Class ProCAi-CD2 agents (i = 1, 2, 3….9). These
agents were developed through the introduction of single high-coordination gadolinium binding
sites into stable CD2 protein using amino acid residues and water molecules as metal
coordinating ligands [3]. The designed proteins showed strong selectivity for gadolinium over
15 T1 and T2 relaxation rate values over the conventional small-molecule contrast agents, e.g.,
DTPA, and possessed stronger contrast enhancement and longer blood retention time than
Gd-DTPA in mice models [3]. With a new generation of contrast agents on the horizon, we hope to
address the following question: Can we design multiple gadolinium-binding site agents to further
increase contrast agent dose efficiency, increase stability, and reduce toxicity?
1.5.Designed Multi-Binding Site Contrast Agents by Protein Engineering
Dr. Jenny J. Yang’s lab specializes in two approaches to studies of calcium-binding proteins,
the design and grafting approaches. The design approach involves site-directed mutagenesis to
tune metal-binding affinities of calcium-binding proteins, conserving the number of amino acids
in their primary sequence and maintaining their structural integrity. This approach was created in
order to “develop a general methodology to design metal binding sites with high coordination
numbers such as calcium and lanthanides, understand the mechanism of calcium-regulated
biological process such as ligand-induced conformational changes in cell adhesion, and monitor
calcium signaling in vivo” [23]. The grafting approach engineers an EF-hand calcium-binding
loop into a protein to understand “site-specific metal binding affinity and selectivity of
individual calcium binding motifs and to estimate the contribution of conformational change and
cooperativity between paired EF-hand motifs” [23].
Using the design approach, two gadolinium-binding sites were engineered into a stable host
protein, which in its native state, has little to no reported interactions with other biomolecules. It
is with great hopes that the increased number of binding sites will enhance the measured
relaxivity compared to commercial agents, and thus improve the dose efficiency. Provided the
binding affinity of gadolinium to the protein is significantly strong, the toxic effects associated
16 1.6.Parvalbumin as an Excellent Scaffold for Engineering Multiple Gadolinium Binding Sites
Parvalbumin is a small, 12 kDa acidic protein ubiquitously distributed throughout the
vertebrate phylum [24-25]. The mammalian form is found in fast twitch muscle fibers, neuronal
cells, and several endocrine glands [25]. Furthermore, parvalbumin has two isoforms: α and β.
Though both forms have a conserved helix-turn-helix motif, the α-form maintains 109 amino
acids and is believed to serve mainly as a cytosolic calcium-buffering protein with no known
interacting partners [26-27]. This six α-helical protein, helices termed A through F, contains
three EF-hand motifs, only two of which functionally bind calcium (CD and EF sites) (Figure
1.8). The β-form, or better termed oncomodulin, maintains 108 amino acids, functioning more so
as a calmodulin-like enzyme ―― often active during cellular proliferation [24, 27]. This form
of parvalbumin possesses two different metal binding domains, one calcium specific and one
calcium/magnesium mixed site [27]. For the purposes of this project, we will mainly focus on
[image:37.612.205.417.445.664.2]studies of the rat derived α-form.
17 The CD site EF-hand motif of parvalbumin is modified through single mutations within a
calcium-binding site. Maintaining pentagonal bipyramidal geometry (Figure 1.9), its residues 1,
3, 5, 7, 9, and 12 are the conserved residues subject to mutagenesis [28]. Because calcium and
gadolinium have comparable ionic radii and gadolinium, it is with great hopes that the increased
charge of gadolinium will allow mutants to bind this metal with a much larger affinity than
calcium. To enhance gadolinium-binding affinity and allow for experimental analysis, various
[image:38.612.91.527.275.573.2]mutations were introduced into the binding domains of parvalbumin (Figure 1.9).
Figure 1.9. Summarizing the CD and EF binding domains of α-parvalbumin and their pentagonal bipyramidal geometries.
Residue 103, located outside the EF binding domain, was mutated from phenylalanine (F) to
tryptophan (W) in order to complete terbium fluorescence experiments. Residue 56, located in
18 increase the proteins gadolinium-binding affinity. Residue 60, also located in the CD binding site
but in position nine, was mutated from glutamic acid (E) to aspartic acid (D) to increase
gadolinium-binding affinity and allow for the incorporation of a water molecule into the binding
site. This incorporation should theoretically enhance the water exchange rate associated with the
gadolinium-binding site and increase the relaxivity. The same can also be said for residue 99,
located in the EF binding site, mutation from glycine (G) to aspartic acid (D). It is proposed that
these mutations will not perturb the conformational fold and can effectively bind gadolinium
with little negative competition from calcium or other biological metal ions at their respective
physiological concentration. However, this must be further investigated in future experiments.
Single and double mutations were introduced into the metal binding sites to observe the intrinsic
metal selectivity properties of mutant forms of parvalbumin.
In this thesis, only single mutant forms of parvalbumin were studied. The significance of
each mutation was previously discussed. Here, ProCA-30 represents wildtype parvalbumin.
ProCA-31 is often referred as pseudo-wildtype parvalbumin because it bears a F103W mutation.
ProCA-32 bears a S56D and F103W mutation. ProCA-33 encompasses an E60D and a F103W
mutation. Collectively, these mutant proteins, or rather contrast agents, comprise four of many
members of Class ProCA-3 agents (Table 1.1).
1.7.Overview of Objectives
In order to understand the key determinants for calcium-binding affinity and metal
selectivity, the initial objective is to characterize the folding and metal-binding properties of
parvalbumin. Based on the differentiation between 54 amino acid sequences, the human and rat
α-forms maintain conserved residues within their EF-hand binding sites. Thus, characteristic in
19 properties of the human form. The short-term goals of this project are to 1) isolate pure,
functional rat parvalbumin (rPV) and its mutagenic components, 2) perform structural studies of
rPV and its mutants by circular dichroism, and 3) complete calcium titration and metal binding
competition experiments using fluorescence. The long-term goal is to control protein function by
tuning metal binding affinities and eventually develop rPV and/or its mutants as site specific
diagnostic and therapeutic MRI contrast agents.
As part of this new class of MRI contrast agents, the engineered mutagenic form of
parvalbumin will have improved relaxivity through the binding of gadolinium and exhibit strong
stability against pH changes. Moreover, it should be structurally tolerant of mutations, have a
selective binding affinity for gadolinium, and maintain a molecular size suitable for intravascular
distribution and easy renal excretion [3]. Coupled with low toxicity and high solubility, the
ability to mass produce pure quantities of this protein at reduced costs will prove advantageous.
This thesis will focus primarily on the expression and purification, metal-dependent structural
changes, and relaxivity of four members of Class ProCA-3.
In chapter 2, the methods implemented for studies of Class ProCA-3 agents will be
discussed. In chapter 3, the E. Coli expression and optimized purification of the designed
contrast agents will be heavily expounded upon. In chapter 4, structural analysis of the purified
agents in the presence of magnesium, calcium, gadolinium, and terbium and the effect that salt
ions play on the structure will also be discussed. Chapter 5 will detail the measured in vitro
relaxivities of Class ProCA-3 agents and their binding mode with gadolinium. Chapter 6
discusses the significance of this thesis and the future application of Class ProCA-3 agents. The
20 Table 1.1. Summary of the discussed members of Class ProCA-3 agents.
Designed Contrast Agent
Mutation Location Molecular
Weight
Pro CA-30 N/A N/A ~ 11.925 kDa
ProCA-31 F103W Just outside EF
site
~ 11.964 kDa
ProCA-32 S56D, F103W CD site (pos. 5) ~ 11.992 kDa
21
2. MATERIALS AND METHODS
2.1.Cloning and Transformation
The DNA sequences for expression of the aforementioned contrast agents were cloned into
pET-22b(+) by senior PhD student David Xue. The experimental details outlined in this thesis
began at the level of transformation. Transformation is a commonly used technique to introduce
genetic alterations into a host cell through the uptake of foreign DNA [29]. More specifically,
the gene encoding for parvalbumin and its mutants were inserted into the pET-22b(+) vector
between the Nde I and Xho I restriction enzyme sites and collectively transfected into E.Coli
BL-21 pLys cells. (Figure 2.1).
22 This particular bacterial system is ideal for overexpression of the designed proteins because
it has the ability to produce large amounts of RNA, amplifying the translation of wildtype or
genetically engineered mutant genes [29]. A volume of 0.5 μL of desired mutant DNA was
mixed with 50 μL of thawed E. Coli BL-21 pLys competent cells with a pipette using an “up and
down” pipetting technique and placed on ice for thirty minutes. The samples, including the
negative controls containing only competent cells, were placed in a 42 ºC water bath for 90
seconds and placed on ice for an additional 2 minutes. A volume of 50 μL of LB was added to
the samples and placed in the incubator at 37 ºC for 30 minutes. The samples were then streaked
out with sterile L-shaped spreaders onto LB ampiscillin plates and left in the 37 ºC incubator
overnight. The following morning yielded evidence of a large number of isolated colonies
containing the transfected parvalbumin plasmid. One colony of each variant would be later used
for innoculation.
2.2.Protein Overexpression
2.2.1. Pilot Expression
A recurrent problem with the purification of soluble, tagless proteins, such as those of Class
ProCA-3 agents, is the inability to eliminate DNA/RNA contamination. It is well known that
insoluble proteins are effectively isolated from coexisting nucleic acids via inclusion body
formation. Therefore, to improve the purification process and increase the yield of isolated
protein, pilot expression procedures were implemented with hopes of extracting ProCA-30 and
its mutants from the inclusion bodies, since DNA normally lies in the supernatant following
centrifugation of cell lysate. It has been proposed that certain bacterial strains have a preference
to form more inclusion bodies than others at a specific temperature. Therefore, choosing one of
23 to isolate the protein from nucleic acids following cell lysis, the pilot expression protocol
modified from Invitrogen’s pRSET A, B, C protocol manual was used to transform and express
ProCA-30 in three different strains using two different concentrations of isopropyl β
-D-1-thiogalactopyranoside (IPTG) (0.5 and 1 mM). The cell pellet following expression was
fractionated by incremental exposure to dry ice and analyzed by SDS-PAGE analysis to
determine whether PV was present in the inclusion body for the reasons previously stated.
2.2.2. Innoculation
A predetermined volume of Luria Bertani (LB) medium was prepared and autoclaved at 15
psi for 1 hour at 121 °C. Traditionally, two 1L flasks and one 250 mL flask were subjected to
this sterilization process and allowed to cool for the overexpression of each ProCA-3 agent. In
order to effectively overexpress each variant, an initial overnight growth of its cellular
expression system must be achieved. One freshly transfected colony was immersed in a 250 mL
culture of sterilized Luria Bertani (LB) medium containing 100 µg/mL of ampiscillin. Great care
was taken to minimize contamination by use of a sterilized inoculating loop and by performing
the transfer of clone to LB flask near an open flame. The flask was then placed in an
environmental shaker to incubate overnight at 37 °C at a speed of 220 to 230 rpm. The following
morning yielded a cloudy solution marked by cell growth. These cells were later to be
transferred to a freshly sterilized LB-ampiscillin medium for optimal cell growth and eventual
overexpression of the desired mutant.
2.2.3. Overexpression
A 50 mL volume of overnight culture was added to each of two 1L flasks of fresh media
containing 100 µg/mL of ampiscillin. The two 1L flasks were incubated in a 37 ºC shaker at a
24 system with IPTG to overexpress the desired protein, the cells were allowed to grow for
approximately three to four hours before reducing the incubation temperature to 25 °C at the
same speed for overnight expression. The following morning, the cultured media was subjected
to centrifugation and the cell pellet was isolated and frozen until purification methods were
implemented.
Using Shimadzu UV-Visible Spectrophotometer (UVP), the optical density of the rapidly
growing cloned cells immediately before induction (0.6000 to 0.8000 more) with inducer IPTG
and at various time points after induction was observed and recorded at 600 nm. The absorbance
readings were recorded and plotted in the Kaleidagraph 3.5 program to chart cellular growth.
Then the samples used for the UVP were saved and spun down in microcentrifuge tubes. The
supernatant was poured off and the cell pellet containing the targeted mutant was resuspended in
a sample buffer containing dithiothreitol (DTT) and beta-mercaptoethanol, which reduce the
disulfide bridges stabilizing the protein’s tertiary structure, and sodium dodecyl sulfate (SDS),
and anionic detergent that binds strongly to and denatures the protein [25]. The samples were
boiled for ten minutes and an SDS-PAGE gel analysis was conducted. The protein is fully
denatured by this gel electrophoresis experiment and opens up in a rod-shaped form with a
number of negatively charged SDS molecules along the polypeptide chain, one SDS molecule
for every two amino acid residues of the mutant [25]. The gel was run using a marker of known
molecular weight (68, 29, 14.3, and 6.5 kDa) to chart where the target contrast agent (~12 kDa)
was located in the resolving portion of the gel following its migration through the stacking
portion, which “concentrates the protein sample into a sharp band before it enters the main
separating gel…allowing relatively large sample volumes of the mutant (10 μL) to be applied to
25 bottom of the resolving portion of the gel, the entire gel was stained with a Coomassie blue
reagent and destained with a buffer containing methanol, acetic acid, and deionized water. The
protein bands are visible after destaining the gel. It is generally accepted that a “very faint
protein band is equivalent to about 0.1 μg of protein” [31]. Figure 2.2 summarizes the expression
procedures implemented.
1 colony 250 mL fresh LB 100 mg ampicillin
Shake overnight at 37 C
50 mL LB 1 L fresh LB
100 mg ampicillin Shake at 37 C to the desired O.D. of 0.6 to 0.8 at 600nm
Transfer
1mM per 1L LB IPTG
Overexpress protein overnight at 25ºC
Centrifugation at 7K, 4°C, 30
minutes
Collect cell pellet and store at -20°C
Expression Procedure:
Add
Transformation
Induction pET 22b‐CA3 into
E. Coli
BL‐21 (De3) pLys competent cells
Figure 2.2. Summary of the Expression Procedures for ProCA3 Agents.
The most significant advantage of the overexpression of a recombinant protein is the ability
to facilitate purification of high quantities of product. Following a collection of the cell pellet
26 sonication/French Press, nucleic acid precipitation, and ion exchange chromatography (IEC)
were implemented to effectively extract the variant from the cells with a high degree of purity.
2.3.Tagless Purification
2.3.1. Sonication and French Press
In order to extract the contrast agent from the cultured E. Coli cells, their phospholipid
bilayer must be fractionated. There are two commonly used techniques to achieve this effect:
sonication and French press. Sonication is the act of applying high energy sound waves to
disrupt cell membranes and release cellular contents (sonoporation) [32]. Due to its simplistic
ease of operation, the sonicator is much easier to use when you have many samples.
Additionally, it gives a sample in a water bath an even and consistent vibration, allowing one to
achieve the same amount of cell breakage in each sample [32]. French pressure cell press, or
French press, is an apparatus used in biological experimentation to disrupt the plasma membrane
of cells by passing them through a narrow valve under high pressure [33]. Once past the valve,
the pressure drops to atmospheric pressure and generates shear stress that disrupts the cells.
French Press is more efficient and doesn’t generate heat when breaking cells, but it has a
minimum volume requirement (500 µL) [33]. Depending on the volume of protein expressed,
researchers may prefer one over the other. There has been no notable difference in efficiency
between the two methods for the purposes of these experiments so both were used
interchangeably to lyse the cells.
The cell pellet from the expression of a target protein was thawed in a cool water bath and
resuspended in 30 mL of 10 mM Tris/HCl pH 7.4 buffer. The mixture was then vortexed with
100 mM phenylmethanesulphonylfluoride (PMSF), a serine protease inhibitor, and separated
27 has increased susceptibility to cleavage by a variety of proteases in solution. They help preserve
the yield and quality of purified protein. There are four groups of proteases: serine, cysteine,
aspartic and metallo-proteases. Based on protein sequence and published data, one can determine
which type of protease inhibitor is best for the purification of his or her protein. The best
protease inhibitor to be used for parvalbumin purification methods was one of serine derivation.
Following its addition, each sample of protein was sonicated six times for 30 seconds, with one
minute cooling increments. The mixture was then centrifuged at 17K for 30 minutes. The
supernatant containing the soluble variant protein was collected and the cell pellet was
discarded. Samples of both the supernatant and cell pellet were taken for SDS Page gel analysis
by the previously described method within the expression protocol.
2.3.2. Nucleic Acid Precipitation
In efforts to isolate the soluble variant via tagless purification methods, DNA and RNA
contamination must be removed from the supernatant. A concentration of 1.3µM of
benzonuclease- MgCl2, an endonuclease and its cofactor that degrades all forms of DNA and
RNA while having no proteolytic activity, was added to the supernatant overnight at 4 ºC.
Endonucleases compose a class of restriction enzymes produced by bacteria that typically
recognize specific 4- to 8-base pair palindromic sequences, called restriction sites, and then
cleave both DNA strands at this site. Thus, the choice for endonuclease type was made based on
the sequence of the pET-22b(+) vector.
Previous experiments conducted prior to the Summer 2009 semester were done to determine
which concentration of streptomycin sulfate (1%, 3%, 5%, or 10%) was optimal for the removal
of nucleic acids and other proteins not thermally stable at high temperatures. It was found that
28 supernatant following overnight cleavage of nucleic acids with benzonuclease. Thus, the process
of precipitation began with adding 5% streptomycin sulfate, a nucleic acid precipitant, to the
solution overnight at 4 ºC. The supernatant was centrifuged and the cell pellet was frozen while
subsequent steps of the procedure were applied to the resulting supernatant containing the
soluble contrast agent. Incubation in an 85 ºC water bath for 10 minutes and immersion in an ice
bath allowed for a visible precipitation of fragmented nucleic acids and proteins lacking
thermostability at such a high temperature. For thermostable proteins, the addition of nucleic
acid precipitant aids in a higher yield from purification. The extent of protein precipitation is
dependent upon the pH of solution and the ratio of precipitant to protein. Streptomycin sulfate is
generally favorable over other commercially available precipitants such as, protamine sulfate and
manganese chloride. One can also use varying concentrations of ammonium sulfate
(concentration depends on properties of protein) to precipitate desired protein from a solution.
The mixture was spun down again at 17K for 30 minutes, allowing one to collect the
supernatant and freeze the cell pellet. To lower the salt concentration introduced into the protein
supernatant system by streptomycin sulfate, the protein was dialysed in 10mM Tris/HCl pH 7.4
overnight at 4ºC and for two 2 hour sessions under the same conditions the following day in
freshly prepared buffer. Next, the supernatant was brought to a concentration of 5 mM EDTA to
remove magnesium or calcium from the variant system over a period of one hour. Because the
overall negative charge of the protein is reduced in the holo-form, the removal of metals from its
binding site hopefully increases the protein’s affinity for the chromatographic methods of
separation to be discussed. It was then filtered via a syringe through a 0.2 µM membrane and
29 pellet following cell lysis, nucleic acid precipitation, and dialysis were taken for SDS Page gel
analysis by the previously described methods.
2.3.3. Ion Exchange Chromatography
The method of chromatographic column separation using FPLC is dependent upon the
physical and chemical properties of a protein. If the protein carries a negative charge at the pH of
buffer used, as in the case with parvalbumin and its variants, the Q sepharose column, an anionic
binding column separating based on charge, is a great method for separation. Using an
Amersham Biosciences FPLC system, a 10mL volume of diluted protein supernatant (ranged
from a 1:10 to a 1:5 dilution of protein to Buffer A) was injected onto the Q column. Using
Buffer A: 10mM Tris/HCl 5mM EDTA pH 8.5 and Buffer B: 10mM Tris/HCl 5mM EDTA 1M
NaCl pH 8.5 combination, a modified FPLC separation program was implemented to elute the
desired protein at 25% concentration of Buffer B.
Initially, the contrast agent binds to the column with the introduction of Buffer A.
Theoretically, any positively charged proteins at pH 8.5 with little affinity for the column will
not bind to the column, maintaining a lower retention time than that of parvalbumin or nucleic
acids. Thus, these proteins along with smaller fragments of nucleic acids will elute from the
column in the first peak monitored by ultraviolet light at 260nm for mutants lacking a tryptophan
and at 280nm for those containing a tryptophan. As the Buffer B concentration increases to 25%,
the contrast agent will elute from the column in the second peak. The final peak eluted at 100%
of Buffer B corresponds to nucleic acids that were initially present in the sample. Previous FPLC
experimental conditions allowed for a second FPLC run during which Buffers A and B contained
3mM Ca instead of EDTA. However, this step was eliminated to reduce the number of steps
30 relaxivity, and fluorescence. It is well known that parvalbumin binds calcium with a high affinity
and calcium. Additionally, with each successive step of the purification process, there are
subsequent consequential losses of protein. Thus, the elimination of this step may also allow for
isolation of a higher quantity of protein.
The appropriate peak observed was collected from each injection. The desired protein
fractions were concentrated down to a final resuspension in a 4 to 6 mL volume of fresh 10mM
Tris/HCl chelexed at pH 7.4. The protein was then dialysed against 10mM Tris/HCl chelex
overnight and then for two 2 hour increments the following day at 4˚C. Figure 2.3 and Figure 2.4
[image:51.612.92.545.358.688.2]summarize the purification procedures.
31 Figure 2.4. Summary of Purification Procedures Continued.
2.3.4. Protein Concentration Calculation
The UV absorbance of the concentrated protein was measured at its characteristic
wavelength (previously mentioned) to calculate the final yield of protein and to verify its purity
by comparing the spectra obtained to that of published data concerning the wildtype protein and
F103W mutant. The concentration was calculated through use of the Beer-Lambert law,
A = є c l, (Equation 2.1)
where A is the measured absorbance at 260nm (phenylalanine characteristic absorbance) for
ProCA-30 and at 280nm (tryptophan characteristic absorbance) for ProCA-31, ProCA-32, and
32 extinction coefficient for ProCA-30 is 1600 cm-1 while that of the remaining members of Class
[image:53.612.93.524.142.378.2]ProCA-3 is 7200 cm-1 [25, 34]. The protein was then stored at -20ºC.
Figure 2.5.Published UV spectrum of Parvalbumin. (A) Wildtype. (B) Parvalbumin-F103W; Dashed line, metal-free form; solid line, Ca2+ loaded form [25, 35].
2.4.Circular Dichroism
Circular Dichroism (CD) is termed as the difference in the absorption of left- and
right-handed circularly polarized light of a molecule containing one or more chiral light-absorbing
groups [36]. CD measured as a function of wavelength is termed CD spectroscopy. Circular
polarized light is converted from linearly polarized light, the sum of two linearly polarized states
(horizontal and vertical) at right angles to each other confined to a single plane, using a
quarter-wave plate [36]. This birefringent plate allows for the distinction between the refractive indices
seen by horizontally and vertically polarized light, slowing one of the linear components of the
beam with respect to the other so that they are one quarter-wave out of phase [36]. This produces
![Figure 1.6. Visible symptoms or signs of NSF/NSD [16-17].](https://thumb-us.123doks.com/thumbv2/123dok_us/9133250.988144/32.612.76.541.71.279/figure-visible-symptoms-signs-nsf-nsd.webp)

![Figure 2.5.Published UV spectrum of Parvalbumin. (A) Wildtype. (B) Parvalbumin-F103W; Dashed line, metal-free form; solid line, Ca2+ loaded form [25, 35]](https://thumb-us.123doks.com/thumbv2/123dok_us/9133250.988144/53.612.93.524.142.378/figure-published-spectrum-parvalbumin-wildtype-parvalbumin-dashed-loaded.webp)
![Figure 2.6. CD spectrum of protein with and without metal-doped (a) pro, (b) pro-Cd, (c) pro-Pb and (d) pro-Cu [37]](https://thumb-us.123doks.com/thumbv2/123dok_us/9133250.988144/56.612.175.456.67.296/figure-spectrum-protein-metal-doped-pro-pro-cu.webp)