https://doi.org/10.5194/hess-21-4283-2017 © Author(s) 2017. This work is distributed under the Creative Commons Attribution 3.0 License.
Carbon isotopes of dissolved inorganic carbon reflect utilization of
different carbon sources by microbial communities in two limestone
aquifer assemblages
Martin E. Nowak1,a, Valérie F. Schwab2, Cassandre S. Lazar3, Thomas Behrendt1, Bernd Kohlhepp2, Kai Uwe Totsche2, Kirsten Küsel3,4, and Susan E. Trumbore1
1Department for Biogeochemical Processes, Max-Planck Institute for Biogeochemistry, Hans-Knöll Straße 10,
07745 Jena, Germany
2Chair of Hydrogeology, Institute of Geosciences, Friedrich Schiller University Jena, Burgweg 11, 07749 Jena, Germany 3Aquatic Geomicrobiology, Institute of Ecology, Friedrich Schiller University Jena, Dornburger Str. 159,
07743 Jena, Germany
4German Centre for Integrative Biodiversity Research (iDiv), Halle-Jena-Leipzig, Leipzig, Germany acurrently at: Bavarian Environment Agency, Hans-Högn-Straße 12, 95030 Hof, Germany
Correspondence to:Martin E. Nowak ([email protected]) Received: 10 October 2016 – Discussion started: 8 November 2016
Revised: 7 June 2017 – Accepted: 23 June 2017 – Published: 31 August 2017
Abstract. Isotopes of dissolved inorganic carbon (DIC) are used to indicate both transit times and biogeochemical evo-lution of groundwaters. These signals can be complicated in carbonate aquifers, as both abiotic (i.e., carbonate equilib-ria) and biotic factors influence the δ13C and 14C of DIC. We applied a novel graphical method for tracking changes in the δ13C and14C of DIC in two distinct aquifer complexes identified in the Hainich Critical Zone Exploratory (CZE), a platform to study how water transport links surface and shallow groundwaters in limestone and marlstone rocks in central Germany. For more quantitative estimates of contri-butions of different biotic and abiotic carbon sources to the DIC pool, we used the NETPATH geochemical modeling program, which accounts for changes in dissolved ions in ad-dition to C isotopes.
Although water residence times in the Hainich CZE aquifers based on hydrogeology are relatively short (years or less), DIC isotopes in the shallow, mostly anoxic, aquifer as-semblage (HTU) were depleted in14C compared to a deeper, oxic, aquifer complex (HTL). Carbon isotopes and chemi-cal changes in the deeper HTL wells could be explained by interaction of recharge waters equilibrated with post-bomb
14C sources with carbonates. However, oxygen depletion and
δ13C and14C values of DIC below those expected from the
processes of carbonate equilibrium alone indicate consider-ably different biogeochemical evolution of waters in the up-per aquifer assemblage (HTU wells). Changes in14C and13C in the upper aquifer complexes result from a number of biotic and abiotic processes, including oxidation of14C-depleted OM derived from recycled microbial carbon and sedimentary organic matter as well as water–rock interactions. The micro-bial pathways inferred from DIC isotope shifts and changes in water chemistry in the HTU wells were supported by com-parison with in situ microbial community structure based on 16S rRNA analyses.
1 Introduction
Groundwater is the most important freshwater reserve on earth and a crucial part of the global hydrological cycle. Al-though the proportion of groundwater in global freshwater reserves is only 0.06 %, it represents as much as 98 % of read-ily available water for humans, livestock, and agriculture.
According to the Intergovernmental Panel on Climate Change (IPCC), groundwater demand by humans is likely to increase in future, due to a general increase in global wa-ter use and a decline in surface wawa-ter availability caused by higher precipitation variability (Parry et al., 2007). In con-trast to expected higher groundwater withdrawal, groundwa-ter recharge rates are likely to decrease on a regional scale because of climate change (Aeschbach-Hertig and Gleeson, 2012).
The critical zone (CZ) is defined as the space ranging from the outer extent of vegetation through soils, down to the sat-urated and unsatsat-urated bedrock (NRC, 2001). It is the crucial connection between groundwater and surface conditions and the space where fundamental physical, chemical, and biolog-ical processes act that are of high importance for sustaining soil and groundwater quality for agricultural and ter use (Akob and Küsel, 2011). Assessments of groundwa-ter vulnerability and sustainable groundwagroundwa-ter management require a sound knowledge of water movement and carbon transport through the CZ (Küsel et al., 2016).
In this study, we measured radiocarbon and stable carbon isotopes of dissolved inorganic carbon (DIC), dissolved or-ganic carbon (DOC), and particulate oror-ganic carbon (POC) in a transect of wells located in the Hainich Critical Zone Ex-ploratory (Hainich CZE), Thuringia, central Germany. Our aim was to use the isotopic composition of all carbon species in the groundwater as a proxy to study both carbon turnover and water dynamics in two superimposed limestone aquifer assemblages with different flow dynamics and physicochem-ical properties (Fig. 1).
Radiocarbon (14C) and stable carbon isotopes (13C/12C) of dissolved constituents provide a useful tool to trace water and carbon (C) movement through the critical zone, as well as to identify different sources contributing to the aquifers’ carbon pools (Bethke and Johnson, 2008). The most com-mon approach in applying radiocarbon in groundwater stud-ies is to measure the14C activity of dissolved inorganic car-bon (DIC), which includes dissolved CO2 and bicarbonate
and carbonate ions. These C species are derived from equi-libration of percolating waters with soil atmosphere CO2, as
well as equilibration of the dissolved CO2with carbonates in
the soil matrix or aquifer rocks.
In order to determine initial 14C concentrations in DIC, numerous correction models have been applied to account for the different processes that affect DIC and bias14C ages (Han and Plummer, 2016). Corrections have to be considered for dissolution of carbonates by dissolved CO2(Tamers et al.,
1975) according to
CO2+H2O+CaCO3→Ca2++2HCO−3, (1)
isotopic exchange between DIC and soil CO2(Fontes, 1992;
Han and Plummer, 2013),
C∗O2(g)+HCO−3 ↔CO2(g)+HC∗O−3, (2) as well as isotopic exchange between DIC and carbonates in the aquifer (Eichinger, 1983; Fontes and Garnier, 1979; Han and Plummer, 2013):
HC∗O−3 +CaCO3(s)↔HCO−3 +CaC
∗
O3(s), (3) where∗in Eqs. (2) and (3) refers to carbon atoms that were exchanged between gaseous liquid and solid phases. Other factors influencing13C and14C of DIC are heterotrophic res-piration of organic matter (OM) (Aravena et al., 1995) and mineral precipitation and weathering (Wigley, 1976).
Han et al. (2012) developed a novel graphical method, the Han–Plummer plot, which allows easy recognition of sys-tematic relationships between13CDICand14CDIC, and is
in-dicative of the processes described above. For example, inter-actions between carbonates and DIC should follow a mixing line, as13C and14C are affected in constant proportions set by the carbonate end-member. On the other hand, addition of organic matter C can vary in both the13C signature (e.g., fer-mentation versus oxidation by O2) and radiocarbon signature
of added C, depending on the organic matter source. In limestone landscapes like the Hainich CZE, groundwa-ter recharge rates can be fast due to karstification or slower due to thick soils developed on Quaternary loess deposits (Kohlhepp et al., 2016). In such regions, recharge waters con-taining biogenic soil CO2that is mostly of recent origin near
the surface react with the carbonates in aquifer rock accord-ing to the stoichiometry of Eq. (1). The DIC in such waters falls within a very specific region on the Han–Plummer plot, the so-called Tamer’s point (Han et al., 2012), i.e., with 50 % of the DIC derived from the soil CO2 and 50 % from the
carbonate rock according to Eq. (1). Values that fall off this pure calcite equilibration point reflect the influence of iso-topic exchange in the aquifer or soil according to Eqs. (2) and (3), i.e., water–carbonate rock interactions, or microbial oxidation of organic matter, respectively. The relative impor-tance of these processes can be distinguished according to the specific position of DIC carbon isotopic values in the Han– Plummer plot (Han et al., 2012).
Carbon isotopes of DIC can give therefore information about both movement of water through the soil (i.e., informa-tion about the signature of the CO2in the unsaturated zone;
Gillon et al., 2012) as well as sources and sinks of different carbon pools within the aquifer (Aravena et al., 1995).
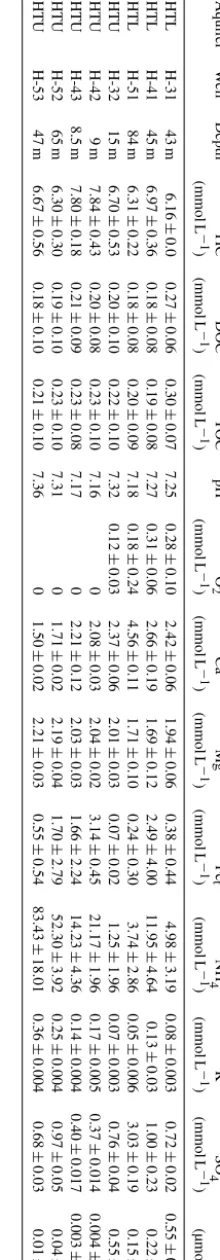
Figure 1.Cross section of the studied Hainich transect. Stratigraphic units moTK, moM, as well as moW represent Middle Triassic units of the Upper Muschelkalk Formation. ku describes Upper Triassic sediments of the Keuper Formation. Sampled wells for this study comprised locations H3, H4, and H5. The lower aquifer assemblage HTL is recharged in the forested area in the upper part of the Hainich mountain range. Aquifer assemblage HTU is recharged in forest, grassland, and agricultural areas.
will not only affect DIC, but also the concentrations of dis-solved Ca+2and Mg+2, and microbial processes like sulfate
reduction will alter SO24−concentrations. In order to assess quantitatively the contribution of biotic and abiotic processes to groundwater carbon biogeochemistry and their impact on DIC isotopes, we used the NETPATH geochemical inverse modeling program (Plummer et al., 1994) that takes alter-ations in water chemistry into account.
The aim of our study was to use carbon isotopes of all accessible organic and inorganic carbon species in our stud-ied limestone aquifers and to use them to elucidate wa-ter flow as well as carbon turnover by applying the lat-est graphical and computational methods including water chemistry and microbiology. The carbon turnover part, es-pecially transformation and formation of organic matter by microorganisms and their interaction with the aquifer rock and water chemistry, was a main target of our study. A special focus of our study was to evaluate the contribu-tion of autotrophic microorganisms to carbon cycling within the aquifer. Chemolithoautotrophic microorganisms, i.e., mi-crobes that metabolize CO2instead of organic carbon, have
been shown to be key players and important primary pro-ducers in groundwater microbial communities (Alfreider et al., 2012; Hutchins et al., 2016; Kellermann et al., 2012). A high potential for microbial CO2 fixation has already been
demonstrated in our studied aquifers by molecular analy-ses (Herrmann et al., 2015; Lazar et al., 2016a; Schwab et al., 2017b). We hypothesized that turnover of OM de-rived from chemoautotrophic microorganisms should be re-flected in DIC isotopes, since OM derived from CO2
fixa-tion should be isotopically distinct from other sources like surface-derived OM or sedimentary organic matter. There-fore, we conducted 16S rRNA gene assays, in order to deter-mine the microbial community structure within the two lime-stone aquifer assemblages and relate it to measured carbon isotopes of DIC, DOC, and POC as well as water chemistry.
2 Methods
2.1 Study site
The Hainich CZE is located in Thuringia, central Germany. It spreads from the Hainich low mountain range (in the SW), representing the groundwater recharge area of this study, towards the valley of the Unstrut River (in the NE). The southwestern part of the study site shares the largest deciduous beech forest in Germany, the Hainich National Park. Within the forest area, the NW–SE oriented Hainich ridge is the topographical and subsurface water divide with surface/subsurface discharge towards the east (Unstrut sub-catchment) and west (Werra subsub-catchment). The geologi-cal succession of Mesozoic sedimentary rocks is moder-ately inclined towards the NE and comprises the Muschel-kalk (m) group outcropping in the upper and midslope area and the Keuper (k) group at the footslope. As the strata dip steeper than the slope angle, lower stratigraphic units out-crop in higher topographic positions. The Upper Muschel-kalk (mo) subgroup, which hosts the aquifer assemblages of this study, is further subdivided into the Trochitenkalk for-mation (moTK) with predominantly limestones and the alter-nated bedded limestone–marlstone succession of the Meiss-ner formation (moM). Mesozoic rocks are partly to totally covered by Pleistocene Loess loam in the midslope/footslope area. Footslope valleys are filled with unconsolidated allu-vium (Küsel et al., 2016; Kohlhepp et al., 2016). Agricul-tural areas with different management intensities surround the largely unmanaged forest area at the eastern hillslope of the Hainich low mountain range.
H5) longitudinal to the assumed groundwater flow direc-tion (Fig. 1). The wells provide access to two main aquifer assemblages, referred to as HTL and HTU (Hainich tran-sect lower/upper aquifer assemblage, respectively (Küsel et al., 2016)), which consist, respectively, of one (HTL) and nine (HTU) individual aquifer storeys (Küsel et al., 2016; Kohlhepp et al., 2016). The HTU aquifers are sampled at depths ranging between 0.6 m (mid-slope; H3) and 54 m (downslope; H5), while the HTL aquifers are sampled at 2 m (upslope; H1) and 89 m (H5) (Fig. 1). HTL comprises a com-plex of aquifer layers in the Trochitenkalk formation (moTK) and comprises thickly bedded porous limestone packages that act as karst-fracture aquifers. HTU comprises mainly an layered aquifer complex within the overlying Meissner formation (moM), comprising fracture aquifers with fine fis-sures and less pronounced karstification due to the finely al-ternating succession of limestones and low-permeable marl-stone beds (Fig. 1; Küsel et al., 2016; Kohlhepp et al., 2016). Vertical exchange is strongly inhibited by frequent and low-permeable marlstone interbeds resulting in confined flow conditions and a layer-cake architecture (Kohlhepp et al., 2016). HTL is characterized by more intense karstification and fast flow through large conduits (Küsel et al., 2016). Both aquifer assemblages and the included aquifer storeys are sep-arated by intercalated marlstone interbeds.
Groundwater recharge in HTL takes place mainly within the forested upper to middle hillslope of the transect. By con-trast, HTU outcrops cover all land-use types and recharge also takes place in the lower hill slope area, with mixed land use with forests, pastures, and cropland areas (Küsel et al., 2016) (Fig. 1).
Soils in the forested upper to midslope area are predom-inantly shallow Rendzic Leptosols and Cambisols that de-veloped mainly on marlstones and limestones. Luvisols and Planosols/Stagnosols (WRB nomenclature; IUSS Working Group WRB, 2006) developed on siliciclastic sediments like Pleistocene Loess loam or unconsolidated Holocene deposits at the footslope position (Küsel et al., 2016).
Groundwater samples analyzed in this study were obtained from eight groundwater wells at well sites H3, H4, and H5 (Fig. 1). The depths of each site and the nomenclature used for each sampling point are provided in Table 1.
2.2 Sampling
Regular sampling was conducted monthly from May 2014 until April 2015. Water samples for δ13C and14C analyses were obtained with a submersible groundwater pump (MP1, Grundfos, Erkrath, Germany). Samples were taken after sta-tionary hydraulic and geochemical conditions were reached, which usually required exchanging at least three well vol-umes. Water samples were taken following recommenda-tions of the International Atomic Agency (IAEA, 2009, http://www-naweb.iaea.org/). One liter Schott bottles with gastight screw caps were filled on a bypass with low
[image:4.612.368.478.73.703.2]ter flow from bottom to top in order to avoid degassing of CO2 during sampling. The bottle was rinsed two times and
subsequently filled to the brim, closed quickly with a gas-tight screw cap, cooled at 4◦C in the dark, and transported to the lab for further analyses. To collect material for POC and DNA, a high-filtration campaign was conducted in May 2015; 1000 L of water were pumped from wells H 5.1, H 5.2, and H 4.3 through pre-combusted (500◦C) glass fiber filters with 0.2 µm pore size placed on a custom filtration unit (Schwab et al., 2017b). After pumping 1000 L, filters were removed, packed into aluminum foliation and cooled on dry ice for POC and DNA analyses. To distinguish be-tween DOC and TOC, water samples for DOC analyses were filtered through a 0.45 µm filter during sampling.
2.3 Hydrochemistry
Specific electrical conductivity, pH, water temperature, dis-solved oxygen concentration, and saturation were measured directly electrometrically in the field (WTW, Weilheim, Ger-many), using a flowthrough cell. Dissolved inorganic carbon (DIC), total organic carbon (TOC), and dissolved organic carbon (DOC) were determined by high temperature cat-alytic oxidation, and a non-dispersive infrared sensor (multi 18 N/C 2100S, AnalytikJena, Germany). Nitrite, nitrate, or-thophosphate, sulfate, and chloride were determined by ion chromatography using an IC 20 system (Dionex, Sunny-vale, CA) equipped with an IonPac AS11-HC column. Major cations were measured by ICP-OES (725 ES, Varian/Agilent, USA) (Kohlhepp et al., 2016).
2.4 13C analyses of DIC
Stable carbon isotope ratios of DIC (δ13CDIC) were measured
according the method described by Assayag et al. (2006). δ13CDICanalyses were performed on an isotope ratio mass
spectrometer (IRMS) coupled to a Gasbench II (Finnigan MAT DeltaPlusXL, Bremen, Germany) and a CTC PAL-80 autosampler. All isotope analyses were conducted within 1 week after sampling. In brief, 1.5 mL of water was trans-ferred from sampled 1 L bottles with a gas-tight syringe to 12 mL screw capped Labco vials with butyl rubber septa, which were pre-flushed with N2; 0.5 mL of 85 % H3PO4was
added to acidify the sample to a pH below 2 and dissolved CO2 was liberated by shaking and equilibrating water and
headspace for 24 h. Three replicates were prepared from each water bottle forδ13C analyses. Standards were prepared for linearity and drift corrections as well as normalizing mea-sured values to the international V-PDB scale (Coplen et al., 2006).
Stable carbon isotope ratios are reported in the delta nota-tion that expresses13C/12C ratios asδ13C values in per mil (‰) relative to the international reference material Vienna
Pee Dee Belemnite (V-PDB):
δ13C=
13C 12C
sample 13C 12C
reference
×1000. (4)
The precision ofδ13CDICbased on three repeated
measure-ments from one sampled bottle was better than 0.3 ‰ (±1σ ). 2.5 14C analyses of DIC
Radiocarbon concentrations of DIC were measured by ac-celerator mass spectrometry (AMS) at the Jena14C facilities (Steinhof et al., 2004). Groundwater DIC was extracted by a headspace-extraction method adapted from Gao et al. (2014). In brief, 25 mL of groundwater samples, corresponding to about 1 mg C, were transferred into 60 mL I-Chem septum sealed screw cap vials within a glove bag containing an N2
atmosphere. Vials were closed with Teflon/silicone septa and additionally underlain Black Viton septa (Sigma Aldrich, St. Louis, MO, USA), in order to avoid contamination of14 C-depleted carbon from the septa rubber (Gao et al., 2014). Af-ter closing the vials, 0.5 mL of 85 % H3PO4was added with
a syringe to acidify the sample and convert all DIC into CO2
(CO2(aq)). The sample was shaken gently and left to equi-librate at room temperature for at least 24 h. Three sets of standards were prepared for every batch of samples to correct for contamination either from atmosphere intrusion or from
14C free septa material. For standards containing either no or
modern14C concentrations, 17.5 mg of IAEA-C1 (0 pMC) and in-house coral standard powder (CSTD coral, obtained from Ellen Druffel, UC Irvine, 94.45±0.18 pMC) were dis-solved in 25 mL acidified water, respectively. Additionally, a blank was prepared to check for the background of the acidi-fied water. Acidiacidi-fied water was prepared by adding degassed 85 % H3PO4 to ultra-pure Milli-Q water (Millipore Corp.,
Billerica, MA, USA) until a pH of lower than 2 was reached and by stripping the water with a N2stream for 1 h.
After preparation, sample as well as standard CO2 was
directly extracted cryogenically from the vial headspace into a customized high vacuum extraction line using a 1:1 ethanol–dry ice mix as a water trap and liquid nitrogen for freezing out the CO2. Extraction efficiency was checked by
measuring the pressure within the vials after CO2release and
equilibration with the headspace on the extraction line. All radiocarbon values are reported in percent modern car-bon pMC, which is defined as the fractionation corrected ra-tio between the14C activity of the sample compared to the new oxalic acid standard (NOX; NBS SRM 4990C) accord-ing to (Steinhof et al., 2004)
pmC=R· 1
0.7459·
1+δ13C NOX
1+δ13C θ
. (5)
Errors reported for14CDICanalyses are the external
2.6 δ13C analyses of DOC and POC
DOC δ13C values of samples from November 2014, March 2015, and May 2015 were determined on a high-performance liquid chromatography (HPLC) system coupled to an IRMS (HPLC/IRMS) system (Scheibe et al., 2012). HPLC/IRMS allows direct determination of δ13C values of DOC in the liquid phase by coupling a LC-IsoLink system (Thermo Electron, Bremen, Germany) to a Delta+XP IRMS (Thermo Fisher Scientific, Germany). A detailed descrip-tion of the apparatus and measurement procedure is given in Scheibe et al. (2012). Errors reported for DOC analyses represent the external analytical precision based on repeated measurements of one control sample. External precision was better than 0.15 ‰. Low DOC content coupled with high salt content of DOC prevented radiocarbon measurements on the collected samples.
δ13C and14C values of POC were obtained by combustion of material trapped on the precombusted glass fiber filters. Pieces of filters were cut out and weighted into tin capsules. The 13C/12C isotope ratio was determined on an isotope ratio mass spectrometer (DELTA+XL, Finnigan MAT, Bre-men, Germany) coupled to an elemental analyzer (NA 1110, CE Instruments, Milan, Italy) via a modified ConFloII™ in-terface (EA-IRMS). Stable carbon isotope ratios are reported in the delta notation that expresses 13C/12C ratios asδ13C values in per mil (‰) relative to international reference ma-terial NBS 22 (Eq. 4). Only one sample of filter could be run for each well. Errors reported for POC values represent the precision of the analysis sequence, based on repeated analy-sis of a control sample.
2.7 DNA extraction and sequencing
DNA was extracted from the filtered groundwater using the RNA PowerSoil® Total Isolation kit followed by the RNA PowerSoil®DNA elution accessory kit (MO BIO, Carlsbad, CA, USA) following the manufacturer’s protocol, and then stored at−20◦C.
Groundwater DNA aliquots were shipped to LGC Ge-nomics GmbH (Berlin, Germany) for Illumina MiSeq se-quencing and the 341F-785R primer pair was used. Because the DNA concentrations from the filter pieces were low, PCR products were used for sequencing, and not genomic DNA. This first round of PCR was carried out on DNA sam-ples using the B8F-U1492R primer pair, and conditions for PCR were 30 cycles with 1 min at 94◦C, 1 min at 55◦C,
and 2 min at 72◦C. The Illumina sequence datasets were
analyzed using Mothur v.1.36.1 following the Schloss SOP (http://www.mothur.org/). Sequences obtained in this study were deposited in the European Nucleotide Archive under accession numbers ERS1392525–ERS1392530.
2.8 14C DIC age models and hydrochemical modeling 2.8.1 Han–Plummer plot
In order to use DIC isotopes as a proxy for water flow and carbon turnover in the subsurface compartments of the CZ, we applied the graphical method developed by Han et al. (2012). The method is based on plotting14CDICagainst
13C
DICas well as the reciprocal of the DIC concentration.
Processes affecting DIC and its isotopic composition in-clude calcite–dolomite dissolution (Tamers et al., 1975), iso-topic exchange under open or closed conditions (Fontes and Garnier, 1979; Eichinger, 1983; Han and Plummer, 2013), heterotrophic respiration of organic matter (Aravena et al., 1995), as well as precipitation and recrystallization of cal-cite (Wigley, 1976). Adjustment models exist for most of the mentioned processes, which can be applied in order to determine the initial14C concentration (Han and Plummer, 2016). The Han–Plummer plot can help to identify processes that affect the DIC isotopic signature. Key features of the Han–Plummer plot are described here briefly with the aid of Fig. 6a and b.
In Fig. 6a, point A represents the isotope value of CO2in
the recharge zone. The isotopic composition of soil CO2in
the Hainich area was obtained from Hahn (2004), who mea-sured soil CO2 values averaging −23.00 ‰ in soils close
to the recharge area. Considering a fractionation factor of
−1.32 ‰ between gaseous and dissolved CO2(Mook et al.,
1974), a δ13C value of −24.32 ‰ can be derived for dis-solved soil CO2 (point A’). We initially chose 100 pmC
(i.e., preindustrial atmospheric CO2) as the initial
radiocar-bon concentration of soil CO2. We do not correct for
mass-dependent fractionation of radiocarbon as this is accounted for in the correction of reported radiocarbon data (Trumbore et al., 2016).
Water that is equilibrated with soil CO2 reacts with
car-bonates either under open system conditions in the soil or un-der closed conditions within the aquifer. Equilibration with carbonates according to Eq. (1) shifts DIC values in the Han– Plummer plot to the so-called Tamer’s point, which repre-sents theδ13C or 14C value of DIC diluted by CaCO3
ac-cording to
13/14C
0=
Ca Ct
×13/14Cg+0.5 Cb
Ct
13/14C
g+13/14Cs
, (6) where14C0represents the13C or14C values of DIC reacted
with CaCO3.Ca,Cb, andCtrefer to CO2(aq)and HCO−3 and
total DIC concentrations, respectively.13/14Cg and13/14Cs
refer toδ13C or radiocarbon concentrations of soil gas and solid carbonate, respectively.
be-tween DIC and solid carbonates, can also be identified with the graphical method. Isotopic exchange in the soil zone, which is usually accompanied by slow water infiltration (Han and Plummer, 2016), would shiftδ13C and14C from Tamer’s point towards values close to A0, whereas the endpoint of DIC fully equilibrated with respect to soil CO2can be
de-rived according to Han and Plummer (2016):
δ13C0=
C
a
Ct
×δ13Cg+εa/g
+ C b CT
×δ13Cg−εg/b
(7) and 14C 0= C a CT
×14Cg+0.2εa/g + C b CT × 14C
g−0.2εg/b
≈14Cg, (8)
where14C0andδ13C0represent the13C or14C values of DIC
equilibrated with soil CO2.Ca,Cb, andCt refer to CO2(aq) and HCO−3 and total DIC concentrations, respectively.δ13Cg
and14Cgrefer to stable isotope composition and radiocarbon
concentrations of soil CO2, respectively. εa/g and εg/b are
the respective carbon isotope fractionation factor of gaseous CO2and dissolved CO2and gaseous CO2and HCO−3.
Isotopic exchange under closed conditions would include isotope exchange reactions between DIC and CaCO3 and
shift δ13C and 14C values in direction to the calcite end-member C. Fully equilibrated DIC isotopic signatures can be derived according to Han and Plummer (2016):
δ13C0=
C
a
Ct
×δ13Cs−εs/a
+ C b CT
×δ13Cs−εs/b
(9) and
14C0=
Ca Ct × 14C
s−0.2εs/a
+ Cb CT × 14C
s−0.2εs/b
, (10)
whereεs/aandεs/brefer to carbon isotope fractionation
fac-tors of CaCO3and CO2(aq)and CaCO3and HCO−3,
respec-tively.
End-members for isotopic exchange under closed condi-tions are represented by point D and by point E in Fig. 6a. DIC that is affected by isotopic exchange to various extents, either under closed or open conditions, would shift DIC iso-tope values along the dashed lines between Tamer’s point and points E and D in Fig. 6a.
Other processes that might affect the isotopic composition of DIC include heterotrophic respiration of organic matter, which can be linked to a variety of microbial metabolisms (Han et al., 2012). The influence of heterotrophic respiration on DIC can be obscured if oxidized OM in the aquifer has similarδ13C or14C values to soil CO2. However, by plotting
δ13C or14C against the reciprocal of the DIC concentration, heterotrophic respiration can be identified, because DIC usu-ally increases in this case (Han et al., 2012) (Fig. 6b and c). Corresponding shifts in DIC isotopes are dependent on the isotopic composition of the oxidized organic matter.
2.8.2 NETPATH modeling
The mass fluxes suggested by the Han–Plummer plot were quantified with the NETPATH inverse geochemical model-ing program (Plummer et al., 1994). NETPATH calculates the chemical evolution of waters along a real or hypothet-ical flow path between an initial and final well (El-Kadi et al., 2011). Models include inverse geochemical calculations, equations for chemical and isotopic mass balance, as well as Rayleigh equations for evolutionary paths of isotopes in aquifers. The models are adjusted to measured mineralogy, as well as chemical and isotopic composition of the ground-water (El-Kadi et al., 2011). A unique feature of NETPATH is its ability to perform radiocarbon age estimates for ground-water by applying traditional14C adjustment models and ac-counting additionally for water–rock interactions, mixing, re-dox reactions, and isotope exchange processes.
To determine carbon evolution within the flow path, NET-PATH uses the concept of total dissolved carbon (TDC) (Plummer et al., 1994):
mTDC=mDIC+mCH4+mDOC. (11)
NETPATH accounts also for organic matter oxidation, in-cluding its isotopic composition, which is not done by tra-ditional14C adjustment models. Calculated14C activity of waterAndin the final well is adjusted for chemical reactions but not for radioactive decay. The radiocarbon age is subse-quently calculated according to
t (years)= 5730
ln 2
·ln(And
A ), (12)
where 5730 represents the half-life of radiocarbon in years, Ais the observed14C activity of TDC in the final well, andt is the travel time between initial and final wells.
Fractionation factors for Rayleigh isotope effects were ob-tained from Mook et al. (1974). Constraints and phases for the calculations were chosen according to changes that were observed in the hydrochemical data. Input data for the model are provided in the Supplement.
Figure 2.Stable isotope monitoring ofδ13CDIC. Upper part:δ13CDICvalues show minor temporal but strong spatial variations. According
to results fromδ13CDICand14CDICand DIC concentrations, wells can be divided into three groups (boxplots in the lower part). Group 1
comprises all oxic wells of HTL and well H-32 of HTU, which is also oxic. Groups 2 and 3 are the anoxic wells of HTU in locations H-4 and H-5, respectively.
Figure 3.Results of radiocarbon monitoring of DIC in the investigated wells. Similar toδ13C values,14CDICvalues show little temporal but
strong spatial variations.14CDICconcentrations decrease according to Group 1 > Group 2 > Group 3. Wells of Group 1 show more variation
during the monitoring period than Group 2 and 3 wells.
3 Results
3.1 Hydrochemistry
Within the time period of monitoring there was no sig-nificant change from previous reported hydrochemical pat-terns (Table 1) (Herrmann et al., 2015; Küsel et al., 2016). Water chemistry reflects the limestone environment of the catchment. Ca2+, Mg2+, HCO−3, CO23−, and SO24− are the main ions in the system (Table 1). The waters are charac-terized as earth alkaline bicarbonatic to bicarbonatic–sulfatic waters (Küsel et al., 2016). The footslope wells of HTU (H-42/43/52/53) are depleted in oxygen, whereas the
[image:8.612.128.469.321.504.2]to < 10 mg L−1in HTL. Sulfate concentrations in the major-ity of wells are close to 100 mg L−1but decrease in HTU at
location H-42 and increase sharply in HTL in well H-51. DIC concentrations in both aquifers are close to 70 mg L−1 but are higher in HTU in wells H-42 and H-43 and lower at location H-51 in HTL.
DOC concentrations are below 1 mg L−1in HTU as well as HTL, with temporal variations in both aquifers.
3.2 δ13C and14C of DIC
The majority of wells have nearly constantδ13C values, with a mean annual value of −11.7±0.2 ‰ (Fig. 2). However, δ13CDIC in wells H-52 and H-53 of HTU are significantly
more enriched compared to all other wells, with values of
−8.9±0.3 and−9.5±0.3 ‰, respectively.
Radiocarbon DIC results show a similar pattern. All wells show little temporal variation during the monitoring period. In HTL,14C concentrations decrease from well 31 to H-41, but increase again in well H-51. Radiocarbon values of HTU decrease continuously from 62.2±7.0 pMC in H-32 to 13.4±0.5 pMC in H-53 (Fig. 3).
According to results from δ13CDICand14CDIC
measure-ments, the observed wells can be divided into three groups (boxplots in the lower part of Figs. 2 and 3). Group 1 com-prises all oxic wells of HTL and well H-32 of HTU, which is also oxic. Groups 2 and 3 describe the anoxic wells of HTU in locations H-4 and H-5, respectively.
3.3 δ13C DOC
Unlike DIC values,δ13C of DOC shows no distinct spatial patterns, with all wells in both aquifer assemblages averag-ing−23.5±1.6 ‰ without clear trends over the observation period (Table 2). We were not able to measure radiocarbon in bulk DOC.
3.4 δ13C and114C of POC
In May 2015, δ13C values for POC are most depleted in well H-43 (−33.8±0.2 ‰) compared to wells 51 and H-52 (−28.7±0.2 and−28.4±0.2 ‰, respectively; Table 2). These are in turn lighter than the δ13C signatures of 45 cm deep soil organic matter (SOM) in the recharge zones of HTL and HTU (−25.8±0.18 and−26.1±0.2, respectively).
Radiocarbon values of POC are 74.4±0.3 pmC in well H-51 (HTL) and 41.2±2.0 pmC in H-43 and 35.2±0.2 pMC in H-52 (both HTU). These are lower than those of SOM (45 cm depth) in the recharge zone of HTL and HTU (88.5±1.4 and 87.5±0.3).
[image:9.612.308.550.64.353.2]Carbonates of both aquifer assemblages are free of ra-diocarbon (i.e., 0 pMC) and have an average δ13C value of 0.3±0.3 ‰.
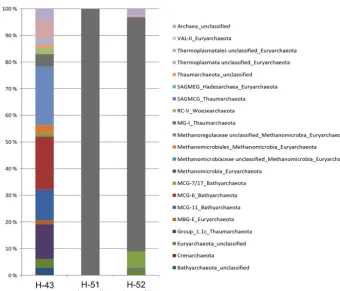
Figure 4. Phylogenetic affiliations of DNA-based bacterial 16S rRNA gene reads in percent of total reads in groundwater samples of wells H-43, H-51 and H-52 for time point May 2015.
3.5 Bacterial and archaeal 16S rRNA gene diversity The bacterial community diversity in the three well samples displays different patterns (Fig. 4). The sample from well H-43 (Group 2) is dominated by Proteobacteria (30.9 % of the total reads) and Candidate Division OD1 (12 %), and is also composed of Firmicutes, Candidate Division OP3, Nitrospi-rae, Bacteroidetes, and Chloroflexi. On the genus level, the most dominant groups are the sulfate-reducing Desulfospori-nus(5.2 %) of the Firmicutes, unclassified genera of the Gal-lionellaceae family (2.1 %, Betaproteobacteria), and unclas-sified groups belonging to the Deltaproteobacteria (8.8 %).
The sample from well H-51 (Group 1) is dominated by Proteobacteria (32.4 %), and is also composed of Nitrospi-rae and Actinobacteria. On the genus level, the most domi-nant groups areAlbidiferax(8.4 %, Betaproteobacteria), Ni-trospira (5.9 %), unclassified genera of the Caulobacter-aceae family (4.1 %, Alphaproteobacteria),Aquicella(1.3 %) andAcidiferrobacter (1.2 %) of the Gammaproteobacteria, and unclassified groups belonging to the Deltaproteobacte-ria (5.2 %).
dom-Table 2.Measured isotopic data of DIC, DOC, and POC.
Aquifer Well δ13CDIC(‰ V-PDB) 14CDIC(pMC) δ13CDOC(‰ V-PDB) δ13CPOC(‰ V-PDB) 14CPOC(pMC)
HTL H-31 −12.0±0.2 58.1±0.4 −23.5±1.2 – – HTL H-41 −11.6±0.2 50.5±3.3 −22.3±2.0 – – HTL H-51 −11.6±0.3 62.2±7.0 −22.4±1.7 −28.7±0.2 74.4±0.3 HTU H-32 −11.6±0.4 65.3±4.0 – – – HTU H-42 −11.8±0.3 45.5±3.6 −22.9±1.6 – – HTU H-43 −11.4±0.2 45.6±1.2 −25.4±0.7 −33.8±0.2 41.2±2.0 HTU H-52 −8.9±0.4 25.1±0.7 -22.5±0.8 −28.4±0.2 35.2±0.2 HTU H-53 −9.5±0.3 13.4±0.5 −23.2±1.5 – –
inant groups are Syntrophus (5.1 %), Desulfovibrio (2 %), andDesulfocapsa(1 %) of the Deltaproteobacteria, Sulfuri-talea (2.6 %, Betaproteobacteria), and Sulfuricurvum (1 %, Epsilonproteobacteria).
The archaeal community structure also shows distinct pat-terns for all three groups (Fig. 5). The samples from wells H-51 (Group 1) and H-52 (Group 3) were almost solely composed of the ammonia-oxidizing Marine Group I (MG-I) Thaumarchaeota. The sample from H-52 (Group 3 well) also contained sequences affiliated with subgroup 7/17 of the Bathyarchaeota (6.3 % of the total reads).
Sample H-43 (Group 2 well) exhibits the most diverse ar-chaeal community. The most dominant groups were unclas-sified genera of the hydrogenoclastic (using H2 and CO2)
methanogenic familyMethanoregulaceae(22 %); subgroups
−6 and−11 of the Bathyarchaeota (19.9 and 11.5 %); and subgroup 1.1c of the Thaumarchaeota(12.9 %). The MG-I Thaumarchaeota which dominated the samples from wells H-51 and H-52 represented only 1.6 % of the archaeal com-munity in well H-43.
3.6 Graphical evaluation of radiocarbon data
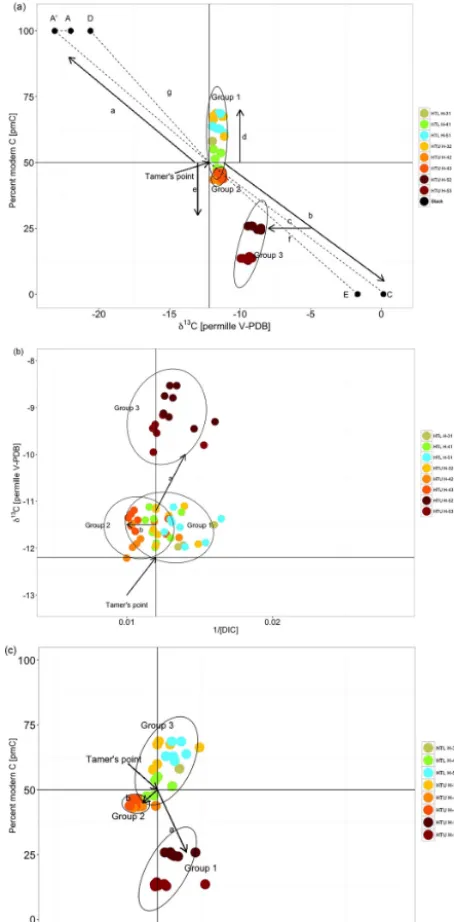
Concordant to results of theδ13CDICand14CDICmonitoring,
three clusters of points can be distinguished when DIC data are plotted in the Han–Plummer plots (Fig. 6a–c). The first group falls on Tamer’s point forδ13C but is enriched in14C (arrow d in Fig. 6a). This group (Group 1) comprises all wells of HTL and well H-32 of HTU.
Group 2 also falls close to Tamer’s line forδ13CDIC, but is
depleted in14C and has elevated DIC concentrations (arrow e in Fig. 6a and arrow b in 6b and c). This pattern is indica-tive of oxidation of organic matter that is depleted in 14C but close to SOMδ13C, accompanied by calcite dissolution. Group 2 comprises wells HTU H-42 and H-43.
Wells HTU H-52 and H-53 constitute the third group (Group 3). Group 3 wells fall off Tamer’s point for δ13C and14C towards more enrichedδ13C and depleted14C val-ues. Enrichedδ13C and depleted14C values can be indica-tive of enhanced calcite dissolution (Han et al., 2012). How-ever, both wells fall off the calcite dissolution line (arrow b in Fig. 6a) and they are shifted towards more depletedδ13C
values (arrow c in Fig. 6a), indicating the influence of more depleted organic C sources or dissolution–precipitation pro-cesses (line e in Fig. 6a).
3.7 NETPATH modeling
For flow paths H-31 to H-41 (Group 1 wells), hydrochemical composition and isotope values for DIC can be reconstructed assuming mainly reactions between water and carbonate rock. Computed stable isotopes of DIC are off the 1σ un-certainty forδ13CDIC(1=0.72 ‰,p> 0.01), but reproduce
measured radiocarbon values (1=0.11 pmC,p=0.79) (Ta-ble 4). To calculate initial14C concentrations, Tamer’s model provides the best match, which is in accordance with the graphical method. Dissolution of 1.01 mmol L−1of calcite is required to explain the evolution of water chemistry between the two wells (Table 3).
For flow paths H-41 to H-51 (Group 1 wells)δ13CDIC
val-ues can be computed assuming 0.31 mmol L−1 calcite
dis-solution. Computed values are within the 1σ uncertainty of measured values (1=0.11 ‰,p=0.38) (Table 4). However, there is less good agreement for radiocarbon (1=5.83 pmC, p=0.07) and DIC in the final well has higher14C concen-trations than in the initial well. NETPATH computes modern radiocarbon ages for both flow paths in HTL; i.e., water was recharged recently and travel time between initial and final wells cannot be resolved by radiocarbon dating.
Two separate flow paths were assumed for modeling the evolution of water chemistry in the upper aquifer as-semblage (HTU). The best match for flow path HTU-1 (H-32 to H-43) was found by oxidizing 0.8 mmol L−1 of organic matter coupled to iron reduction (dissolution of 0.18 mmol L−1 goethite) and sulfate reduction (precipita-tion of 0.18 mmol L−1 of pyrite) (Table 3). The best match
for calculating isotope values was obtained using the val-ues measured in POC as the source of oxidized C (Ta-ble 4). Calculated isotope values using the model match well forδ13CDIC (1=0.01 ‰, p=0.91) but less well for
14C
DIC(1=2.92 pmC, p=0.07) (Table 4). Water travel
[image:10.612.57.535.85.198.2]Figure 5.Phylogenetic affiliations of DNA-based archaeal 16S rRNA gene reads in percent of total reads, for groundwater samples of all wells for time point May 2015.
Table 3.Mass fluxes derived from the NETPATH model. The unit of all displayed mass transfers is mmol L−1. Negative leading signs indicate that the respective phase is removed from the water phase. “Exchange” refers to cation exchange and numbers in brackets in the “calcite” column refer to isotopic exchange between DIC and calcite minerals. CH2O refers to organic matter.
Reaction (mmol L−1)
Flow path Calcite [iso-ex] Dolomite CH2O CH4 CO2 Gyspum Pyrite Goethite NH3Gas Exchange
H-31–H-41 1.01 – – – – – – – −1.46 –
H-41–H-51 0.31 – – – – – – – −1.78 –
H-32–H-43 1.53 – 0.77 – – – −0.18 0.18 – 1.70
H-32–H-52 a 1.57 [2.00] 0.18 – 1.33 −3.78 −3.53 1.87 – – 4.62
H-32–H-52 b 1.26 [2.00] 1.18 1.82 – −3.96 – 0.10 – −3.22 4.10
determination. The revised Fontes–Garnier model for closed system isotope exchange was used instead. Reactions nec-essary for the inverse model include calcite dissolution and isotopic exchange (2 mmol L−1), dolomite dissolution, sul-fate reduction and methanogenesis, as well as removal of ammonia (Table 1). In order to keep the system in balance, 3.78 mmol L−1 of CO2 have to be removed from the
sys-tem. Calculated radiocarbon values match measured values (1=0.96 pmC,p=0.002) as well asδ13CDIC(1=0.57 ‰,
p=0.007) (Table 4). Water travel time between H-32 and H-52 is computed as 295 years.
Because this model suggests the formation of high amounts of methane, which was not observed in the aquifer (T. Behrendt, unpublished data), we ran a second model
in-cluding more depleted values for POC. These values were based on PLFA data from Schwab et al. (2017b), who mea-sured14C activity andδ13C of the main bacterial biomarker C16:0. Measured vales were −39.83±0.72 ‰ for δ13C and 7±1 pMC for radiocarbon. Assuming this C source, model-estimated14C and δ13C values agree less well with observations (1=3.69 pmC, p=< 0.01 and 1=0.67 ‰, p=< 0.01 for 14CDIC and δ13CDIC, respectively), but no
[image:11.612.56.538.440.527.2]Table 4.Measured and NETPATH-computed isotopic data.
Isotope Measured Computed Measured Computed Used model Input TOC Input TOC Age
values δ13CDIC δ13CDIC 14CDIC(pMC) 14CDIC(pMC) forA0 δ13C (‰ V-PDB) 14C (years) (‰ V-PDB) (‰ V-PDB) (±1σ)
(±1σ)
H-41 −11.6±0.2 −10.91 50.5±3.3 50.9 Tamers −28.7±0.2 74.4±0.3 modern
H-51 −11.6±0.3 −11.74 62.2±7.0 56.4 Tamers −28.7±0.2 74.4±0.3 modern
H-42 −11.8±0.3 −11.75 45.5±3.6 48.4 Tamers −33.8±0.2 41.2±2.0 403
H-52a −8.9±0.4 −9.51 25.1±0.7 27.4 Rev. F–G −28.4±0.2 35.2±0.2 296
H-52b −8.9±0.4 −9.61 25.1±0.7 28.3 Rev. F–G −39.8±0.7 7.9±2.0 587
4 Discussion
4.1 Groundwater flow
DIC isotopes for the three different groundwater groups re-flect both differences in recharge characteristics as well as the evolution of waters as they flow through the aquifers.
The carbon isotopic composition of DIC of Group 1 wa-ters suggests rapid recharge and minor exchange reactions due to rapid flow. δ13C values are close to Tamer’s point, typical for fast water infiltration without isotopic exchange between DIC and CO2 or carbonates in the soil (Han and
Plummer, 2013). However,14C values of Group 1 wells are enriched compared to the preindustrial atmosphere assumed for Tamer’s point soil-CO2 end-member (i.e., the 14C
sig-nature of 100 pmC for soil CO2). Enrichment of14C can be
caused by isotope exchange between soil CO2and DIC in the
unsaturated zone (Fontes and Garnier, 1979; Han and Plum-mer, 2013). However, measured DIC values do not fall on line g in Fig. 6a, which would be indicative of isotope ex-change under open conditions in the soil. Enrichment of14C along arrow d in Fig. 6a indicates rather the presence of ex-cess 14C derived from nuclear bomb testing (Gillon et al., 2012). The presence of bomb carbon infers that soil CO2
in the recharge zone is mainly derived from root respira-tion and mineralized organic matter in the topsoil (Richter et al., 1999). This is a reasonable assumption, because the soil groups in the recharge area of HTL are mainly rather shal-low, belonging to Rendzic Leptosol or Cambisol soils, with presumably fast infiltration (Kohlhepp et al., 2016).
Radiocarbon dating of modern groundwater is difficult due to high model input uncertainty (Gillon et al., 2012). Re-calculating initial 14C activities of Group 1 wells assuming a Tamer-like dilution by 14C dead carbonates yields values of 110, 99, 120, and 136 pmC for wells 31, 41, H-51, and H-32, respectively. Initial14C values indicating pre-dominance of bomb-derived radiocarbon as high as 136 pmC could be interpreted as suggesting the time from the ground-water recharge area to the groundground-water well in the range of years to decades. However, intense fracturing and karstifi-cation in the HTL aquifer with broad fractures, secondary porosity, and even karst breccia within and up to 4 km away
from the capture area (Kohlhepp et al., 2016) suggest that groundwater flow is much more rapid. The radiocarbon sig-natures thus most likely indicate variations of14C in soil CO2
in the recharge area. For well H-51, there is also an indica-tion that14C values are influenced by mixing of waters of different radiocarbon concentration (Cartwright et al., 2012; Bethke and Johnson, 2008). This is supported by the increase in SO24−and Ca2+concentrations in well H-51, caused most probably by mixing with sulfate-rich waters from the aquifer system below HTL. Mixing of waters and associated mixing corrosion can also explain the calcite dissolution suggested by NETPATH.
Group 2 waters representing wells H-42 and H-43 in the HTU aquifer complex also fall on the Tamer line for δ13C but not for 14C. 14C values are more depleted than would be expected for a Tamer-like dilution. Tamer’s model is also proposed by NETPATH to estimate initial 14C in the recharge area, which – because it is lower (averag-ing 45.51±3.62 pmC, equivalent to 40314C years) than the current atmospheric 14CO2 values in the year of sampling
(∼103 pmC) – indicates the influence of CO2derived from
decomposition of older organic matter. As for Group 1 wells, the hydrology in this hillslope indicates rapid movement of water (Kohlhepp et al., 2016), so depleted 13C values in Group 2 wells probably do not represent lower flow dynam-ics and radioactive decay, but turnover of14C-depleted car-bon in Group 2 wells.
Isotope values of Group 3 cluster in a very different region than Groups 1 and 2. Enrichment in13C and depletion in14C is indicative of calcite dissolution. The best match between calculated and measured values was obtained using the re-vised Fontes–Garnier model for isotope exchange between DIC and carbonates to correct for initial14C in the starting well H-32 (Han and Plummer, 2013). This indicates different recharge patterns or an alternative recharge area as well as enhanced water–rock interactions in this portion of the HTU aquifer complex.
forma-Figure 6. (a)Han–Plummer plot with data from groundwater sam-pling wells. The Methods section describes in detail the theory behind these plots and identifies the various elements shown in the figure. By plotting14C vs.δ13C three different groups can be distinguished. The oxic wells of HTL including well H-32 form Group 1, wells H-42 and H-43 (Group 2), as well as H-52 and H-53 (Group 3). The Han–Plummer plot indicates14C enrichment due to bomb carbon for Group 1 wells (arrow d), oxidation of14 C-depleted OM accompanied with calcite dissolution in Group 2 wells (arrow e), and complex water–rock interactions and OM turnover in Group 3 wells (arrow c). Further explanations are given in the text. (b) Plotting13C vs. 1/DIC (mmol L−1) also allows distinguish-ing of the three groups. Group 2 is not distinct in14C compared to Group 1, but differs in DIC concentration. Group 2 is distinct from Group 1 inδ13C, but does not differ in DIC concentration.(c) Plot-tingδ13C concentrations against 1/[DIC].
tion and Warburg formation), although this is rather unlikely (Kohlhepp et al., 2016).
Group 2 and Group 3 wells have inferred radiocarbon ages of 403 and 296 or 587 years, respectively, and are there-fore not regarded as modern by NETPATH. Nevertheless, computed ages cannot be distinguished from modern waters within the model uncertainty.
4.2 Biogeochemical processes affecting DIC in Group 2 wells
As indicated by the graphical method, DIC in Group 2 wells is influenced by oxidation of organic matter. However, that OM oxidation has to be performed under anoxic conditions present in these waters. According to the NETPATH model, OM oxidation can be linked to iron and sulfate reduction. Both processes can also result in dissolution of carbonates and add OM-derived DIC according to
C6H12O6+24Fe3++12H2O→6HCO−3 +24Fe 2+
+30H+ (13) and
CH2O+SO24−→H2S+2HCO−3, (14)
H2S+CaCO3→HCO−3 +Ca
2++
HS−. (15)
A good correlation between sulfate concentrations and δ13C of DIC supports an influence of sulfate reduction on DIC (Fig. 7). Moreover, a high fraction of Desulfospori-nus species, endospore-forming strictly anaerobic sulfate-reducing bacteria (Stackebrandt et al., 1997), was detected in H-43 (Group 2 well).
With the NETPATH model, the addition of oxidized OM with isotopic signatures identical to measured POC matched observed DIC isotopic values reasonably well (Table 4). This suggests that the carbon source is depleted inδ13C, with14C close to DIC values, i.e., older organic matter.
Autotrophic organisms can provide carbon that is char-acterized by the above-mentioned features. Chemolithoau-totrophic microorganisms have been recognized to be impor-tant components of aquifer foodwebs, if sufficient electron donors are available (Hutchins et al., 2016; Alfreider et al., 2012; Kellermann et al., 2012). Chemolithoautotrophs can use six different metabolic pathways to fix DIC, of which the Calvin–Benson cycle and the acetyl-CoA pathway are the two most important ones (Fuchs, 2011). Herrmann et al. (2015) found that up to 17 % of the microbial community in well H-43 has the potential for chemolithoautotrophic CO2
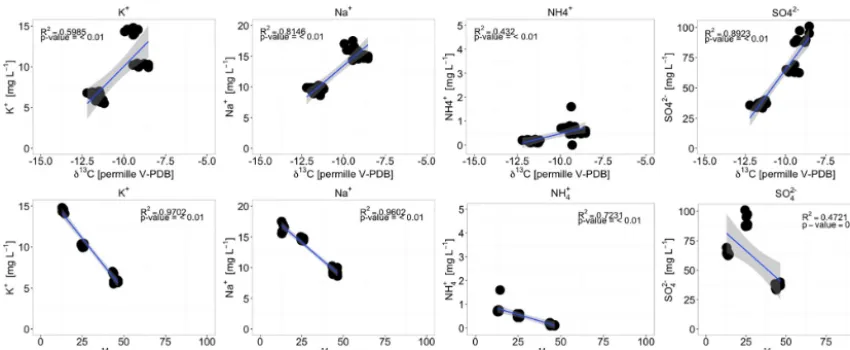
[image:13.612.56.283.69.530.2]Figure 7.Correlations between elemental concentration in Group 2 and 3 wells and measuredδ13CDICand14CDICvalues.
identified in Group 2 wells, as well as autotrophic hydrogen-oclastic methanogens.
According to mass fluxes calculated with NETPATH (0.77 mmol L−1), C derived from oxidation of13C- and14 C-depleted organic carbon would constitute 11 % of the DIC pool.
4.3 Biogeochemical processes affecting Group 3 wells
The Han–Plummer plot suggests that DIC in Group 3 wells is influenced by water–rock interactions, including calcite and dolomite dissolution as well as isotopic exchange between DIC and calcite (Wigley, 1976; Han and Plummer, 2016).
Quantification of these fluxes by NETPATH estimates 1.57 mmol L−1 of calcite and 0.18 mmol L−1 of dolomite dissolution, with exchange of 2 mmol L−1of carbon between DIC and carbonate rock.
Calcite dissolution/precipitation can be triggered by cation exchange of Ca2+with Na+and K+or NH+4 on clay miner-als or organic matter (Coetsiers and Walraevens, 2009; van Breukelen et al., 2004). Decreasing Ca2+concentrations can cause changes in CaCO3saturation indices and result in
en-hanced calcite dissolution. The impact of cation exchange on DIC isotopic values in Group 3 wells is supported by good correlations with K+, Na+, and NH+4 concentrations in HTU (Fig. 7). Ammonia and K input into Group 3 wells could also be an indicator of surface-derived nutrients from agricultural fields and highlight the potential impact of land-use change on apparent groundwater ages. These also support the idea that there is vertical transport from the agricultural zone into this part of the HTU aquifer assemblage.
In addition to abiotic exchanges with carbonate rocks, bi-otic processes also influence isotopic signatures of DIC in Group 3 wells. This is suggested by the Han–Plummer plot, asδ13C values are more depleted than would be expected for solely isotopic exchange (Fig. 6a). NETPATH modeling
sug-gests either involvement of methane or oxidation of organic matter that is depleted in bothδ13C and14C compared to wa-ter equilibrated with surface soil CO2(Table 3).
Depending on isotopic input parameters, NETPATH indicates that either 1.33 mmol L−1 of methane or 1.82 mmol L−1 of 14C-depleted OM have to be oxi-dized to explain DIC isotopic signatures. However, methane concentrations in Group 2 and 3 wells are low compared to what has been observed in other methanogenic aquifers, with values of ∼0.1 µmol L−1 (T. Behrendt, unpublished
data). Hence, either there is a very rapid microbial turnover of methane, which would result in low in situ concentrations, or oxidation of13C- and14C-depleted organic carbon seems a more plausible explanation, one that is further supported by the molecular data. Indeed, bacteria of the family Ignavibacteriaceae, a major group in Group 3 wells, are chemoorganotrophs growing on carbohydrate fermentation (Iino et al., 2010).
A major carbon source that might provide14C-depleted OM can be sedimentary organic matter (Aravena and Wasse-naar, 1993; Coetsiers and Walraevens, 2009). Sedimentary organic matter can be released by carbonate dissolution or be derived from marlstones that are interbedded with the fractured carbonate rocks (Kohlhepp et al., 2016). Bath-yarchaeota, which are the second abundant archaeal group in Group 3 wells, are especially metabolically versatile and able to use different carbon sources (Lazar et al., 2016b).
13C- and 14C-depleted C for heterotrophic growth can
Thau-marcheota (Berg et al., 2014), which constitute 90 % of total archaeal reads.
An additional source of 14C-depleted carbon could also be input of old C from the soil. The NETPATH models pre-dict distinct recharge areas for Group 3 wells compared to Groups 2 and 1, and soils in areas recharging Group 3 wells may also have slower water infiltration (Küsel et al., 2016). During slow percolation of water through the soil, extensive recycling (either through sorption–desorption or fixation and oxidation in microbial C) might lead to input of DOC from subsoil horizons that is much more depleted in 14C than in the shallow soils of the recharge areas of Group 1 and 2 wells (Schiff et al., 1997). Also, anthropogenic influences like land-use change can lead to mobilization of old, 14 C-depleted carbon from soils (Kalbitz et al., 2000).
Overall, while there are a range of possible sources for
13C- and 14C-depleted carbon that might contribute to the
observed 13CDICshift, it is clear that old organic matter is
being oxidized to support a significant fraction of the micro-bial food web in Group 3 waters.
Variable carbon utilization by microorganisms has been shown already for deep surface communities (Simkus et al., 2016). Our data similarly indicate a variable substrate utiliza-tion in shallow aquifers.
The timescales, on which biotic and abiotic processes act that influence DIC isotopic composition, remain uncertain. Radiocarbon ages calculated by the models have high uncer-tainties and14C signatures inferred by models could repre-sent variations in the signatures of14C in recharge zones, i.e., through differences in the degree of interaction with older C found in deeper soil layers, rather than the time it takes for water to transport C. Thus it is not possible to distguish Group 3 water from modern waters. Water–rock in-teractions like calcite precipitation or dissolution have been shown to act very rapidly (Miller et al., 2016; Matter et al., 2016), which is also supported by our data. Without inde-pendent information (e.g., from hydrogeologic modeling) on water fluxes through the aquifers, we cannot estimate rates of transformation associated with changes in water chemistry between wells.
According to the NETPATH model, 1.82 mmol L−1of OM were oxidized in Group 3 wells, which would account for more than 28 % of the total DIC pool.
5 Conclusions
The evaluation of DIC carbon isotopes by graphical and nu-merical methods revealed strikingly different abiotic and bi-otic processes influencing the DIC isotopic composition of groundwater in our detailed study. The combination of the Han–Plummer plot and geochemical modeling yielded con-sistent results and allowed us to identify and quantify the dif-ferent processes contributing to these large variations in DIC within a single sub-catchment.
As the residence time of groundwater in the aquifer as-semblages is expected to be rather short, we attribute the observed differences in DIC to variations in recharge areas and subsequent biogeochemical processes. In HTL wells, the recharge water (largely recharging in upslope forest) was equilibrated with CO2dominated by post-bomb C fixed from
the atmosphere in the last years to decades. Subsequent evo-lution was largely dominated by abiotic processes, including carbonate dissolution and mixing with other waters.
In HTU wells, DIC isotopes reflected oxidation of organic matter from different sources in addition to abiotic water– rock interactions. Microbial communities in HTU wells are capable of using a range of C sources with very old 14C concentrations (i.e., < 50 pmC), including inorganic carbon fixed through chemolithoautotrophy and/or heterotrophic ox-idation of sedimentary organic matter. This metabolic versa-tility is also supported by bacterial and archaeal DNA data. As both aquifers studied are shallow and situated within a dynamic fractured setting, both biotic and abiotic processes appear to act on short timescales.
Data availability. Sequences obtained in this study were deposited in the European Nucleotide Archive under accession numbers ERS1392525–ERS1392530. All hydrochemical and isotopic data as well as modeling codes can be obtained from the author.
The Supplement related to this article is available online at https://doi.org/10.5194/hess-21-4283-2017-supplement.
Competing interests. The authors declare that they have no conflict of interest.
Acknowledgements. We thank Heiko Minkmar and Robert Lehmann for help with water sampling and on-site logistics. We kindly acknowledge Petra Linke, Axel Steinhof, and Heike Machts for measuringδ13C and14C samples. Further, we would like to thank Christian Seifert and Sandy Laschke for assistance in sample preparation for isotope analyses. We also kindly ac-knowledge Xiaomei Xu from the University of California Irvine for introduction in radiocarbon measurements of DIC. The study has been conducted in the B03 project of Collaborative Research Center 1076 AquaDiva. The work has been funded by the German Research Foundation (Deutsche Forschungsgemeinschaft, DFG), CRC 1076 “AquaDiva”. Martin E. Nowak was supported by DFG-funded research training group GRK1257 “Alteration and Element Mobility at the Microbe-Mineral Interface” and the International Max Planck Research School for Global Biogeochemical Cycles (IMPRS gBGC).
Edited by: Bill Hu
Reviewed by: two anonymous referees
References
Aeschbach-Hertig, W. and Gleeson, T.: Regional strategies for the accelerating global problem of groundwater depletion, Nat. Geosci., 5, 853–861, 2012.
Akob, D. M. and Küsel, K.: Where microorganisms meet rocks in the Earth’s Critical Zone, Biogeosciences, 8, 3531–3543, https://doi.org/10.5194/bg-8-3531-2011, 2011.
Alfreider, A., Schirmer, M., and Vogt, C.: Diversity and expression of different forms of RubisCO genes in polluted groundwater un-der different redox conditions, FEMS Microbiol. Ecol., 79, 649– 660, https://doi.org/10.1111/j.1574-6941.2011.01246.x, 2012. Aravena, R. and Wassenaar, L. I.: Dissolved Organic-Carbon
and Methane in a Regional Confined Aquifer, Southern Ontario, Canada – Carbon-Isotope Evidence for Associ-ated Subsurface Sources, Appl. Geochem., 8, 483–493, https://doi.org/10.1016/0883-2927(93)90077-T, 1993.
Aravena, R., Wassenaar, L. I., and Plummer, L. N.: Estimating C-14 Groundwater Ages in a Methanogenic Aquifer, Water Resour. Res., 31, 2307–2317, https://doi.org/10.1029/95wr01271, 1995. Assayag, N., Rivé, K., Ader, M., Jézéquel, D., and Agrinier, P.:
Im-proved method for isotopic and quantitative analysis of dissolved inorganic carbon in natural water samples, Rapid Commun. Mass Sp., 20, 2243–2251, 2006.
Berg, C., Listmann, L., Vandieken, V., Vogts, A., and Jürgens, K.: Chemoautotrophic growth of ammonia-oxidizing Thaumarchaeota enriched from a pelagic re-dox gradient in the Baltic Sea, Front. Microbiol., 5, 786, https://doi.org/10.3389/fmicb.2014.00786, 2014.
Berg, I. A.: Ecological Aspects of the Distribution of Different Au-totrophic CO2Fixation Pathways, Appl. Environ. Microbiol., 77, 1925–1936, https://doi.org/10.1128/Aem.02473-10, 2011. Bethke, C. M. and Johnson, T. M.: Groundwater age and
ground-water age dating, Annu. Rev. Earth Pl. Sc., 36, 121–152, https://doi.org/10.1146/annurev.earth.36.031207.124210, 2008. Cartwright, I., Weaver, T. R., Cendon, D. I., Fifield, L. K.,
Tweed, S. O., Petrides, B., and Swane, I.: Constraining groundwater flow, residence times, inter-aquifer mixing, and aquifer properties using environmental isotopes in the south-east Murray Basin, Australia, Appl. Geochem., 27, 1698–1709, https://doi.org/10.1016/j.apgeochem.2012.02.006, 2012. Coetsiers, M. and Walraevens, K.: A new correction model for14C
ages in aquifers with complex geochemistry – Application to the Neogene Aquifer, Belgium, Appl. Geochem., 24, 768–776, https://doi.org/10.1016/j.apgeochem.2009.01.003, 2009. Coplen, T. B., Brand, W. A., Gehre, M., Gröning, M., Meijer, H. A.
J., Toman, B., and Verkouteren, R. M.: New guidelines forδ13C measurements, Anal. Chem., 78, 2439–2441, 2006.
Eichinger, L.: A Contribution to the Interpretation of C-14 Ground-water Ages Considering the Example of a Partially Confined Sandstone Aquifer, Radiocarbon, 25, 347–356, 1983.
El-Kadi, A. I., Plummer, L. N., and Aggarwal, P.: NETPATH-WIN: An Interactive User Version of the Mass-Balance Model, NETPATH, Ground Water, 49, 593–599, https://doi.org/10.1111/j.1745-6584.2010.00779.x, 2011.
Emerson, D., Fleming, E. J., and McBeth, J. M.: Iron-Oxidizing Bacteria: An Environmental and Genomic Perspective, Annu. Rev. Microbiol., 64, 561–583, https://doi.org/10.1146/Annurev.Micro.112408.134208, 2010. Fontes, J. C.: Chemical and Isotopic Constraints on C-14 Dating of
Groundwater, Radiocarbon after Four Decades, 242–261, 1992. Fontes, J. C. and Garnier, J. M.: Determination of the Initial C-14
Activity of the Total Dissolved Carbon – Review of the Existing Models and a New Approach, Water Resour. Res., 15, 399–413, https://doi.org/10.1029/Wr015i002p00399, 1979.
Fuchs, G.: Alternative Pathways of Carbon Dioxide Fixation: In-sights into the Early Evolution of Life?, in: Annual Review of Microbiology, edited by: Gottesman, S. and Harwood, C. S., Annu. Rev. Microbiol., 65, 631–658, 2011.
Gao, P., Xu, X., Zhou, L., Pack, M. A., Griffin, S., Santos, G. M., Southon, J. R., and Liu, K.: Rapid sample prepara-tion of dissolved inorganic carbon in natural waters using a headspace-extraction approach for radiocarbon analysis by ac-celerator mass spectrometry, Limnol. Oceanogr.-Meth., 12, 174– 190, https://doi.org/10.4319/lom.2014.12.174, 2014.
Gillon, M., Barbecot, F., Gibert, E., Plain, C., Corcho-Alvarado, J. A., and Massault, M.: Controls on C-13 and C-14 variability in soil CO2, Geoderma, 189, 431–441,
https://doi.org/10.1016/j.geoderma.2012.06.004, 2012.
Hahn, V.: Soil carbon sequestration and CO2 flux partitioning,
PhD thesis, Chemisch-Geowissenschaftliche Fakultät, Friedrich-Schiller-Universität, Jena, 2004.
Han, L. F. and Plummer, L. N.: Revision of Fontes & Garnier’s model for the initial C-14 content of dissolved inorganic car-bon used in groundwater dating, Chem. Geol., 351, 105–114, https://doi.org/10.1016/j.chemgeo.2013.05.011, 2013.
Han, L. F. and Plummer, L. N.: A review of single-sample-based models and other approaches for radiocarbon dating of dissolved inorganic carbon in groundwater, Earth-Sci. Rev., 152, 119–142, https://doi.org/10.1016/j.earscirev.2015.11.004, 2016.
Han, L.-F., Plummer, L. N., and Aggarwal, P.: A graphical method to evaluate predominant geochemical processes occurring in groundwater systems for radiocarbon dating, Chem. Geol., 318– 319, 88–112, https://doi.org/10.1016/j.chemgeo.2012.05.004, 2012.
Herrmann, M., Rusznyak, A., Akob, D. M., Schulze, I., Opitz, S., Totsche, K. U., and Kusel, K.: Large Fractions of CO2
-Fixing Microorganisms in Pristine Limestone Aquifers Appear To Be Involved in the Oxidation of Reduced Sulfur and Ni-trogen Compounds, Appl. Environ. Microbiol., 81, 2384–2394, https://doi.org/10.1128/AEM.03269-14, 2015.
Hutchins, B. T., Engel, A. S., Nowlin, W. H., and Schwartz, B. F.: Chemolithoautotrophy supports macroinvertebrate food webs and affects diversity and stability in groundwater communi-ties, Ecology, 97, 1530–1542, https://doi.org/10.1890/15-1129.1, 2016.
IUSS Working Group WRB: World reference base for soil resources (WRB), World soil resources reports, FAO, Rom, 103, 2006. Kalbitz, K., Geyer, S., and Gehre, M.: Land use impacts on
the isotopic signature (C-13, C-14, N-15) of water-soluble ful-vic acids in a German fen area, Soil Sci., 165, 728–736, https://doi.org/10.1097/00010694-200009000-00006, 2000. Kellermann, C., Selesi, D., Lee, N., Hügler, M., Esperschütz, J.,
Hartmann, A., and Griebler, C.: Microbial CO2fixation potential
in a tar-oil-contaminated porous aquifer, FEMS Microbiol. Ecol., 81, 172–187, https://doi.org/10.1111/j.1574-6941.2012.01359.x, 2012.
Kodama, Y., and Watanabe, K.: Sulfuricurvum kujiense gen. nov., sp nov., a facultatively anaerobic, chemolithoautotrophic, sulfur-oxidizing bacterium isolated from an underground crude-oil storage cavity, Int. J. Syst. Evol. Micr., 54, 2297–2300, https://doi.org/10.1099/ijs.0.63243-0, 2004.
Kohlhepp, B., Lehmann, R., Seeber, P., Küsel, K., Trumbore, S. E., and Totsche, K. U.: Pedological and hydrogeological setting and subsurface flow structure of the carbonate-rock CZE Hainich in western Thuringia, Germany, Hydrol. Earth Syst. Sci. Discuss., https://doi.org/10.5194/hess-2016-374, in review, 2016. Kojima, H. and Fukui, M.: Sulfuritalea hydrogenivorans gen.
nov., sp nov., a facultative autotroph isolated from a freshwater lake, Int. J. Syst. Evol. Micr., 61, 1651–1655, https://doi.org/10.1099/ijs.0.024968-0, 2011.
Küsel, K., Totsche, K. U., Trumbore, S. E., Lehmann, R., Steinhäuser, C., and Herrmann, M.: How deep can sur-face signals be traced in the critical zone? Merging biodiversity with biogeochemistry research in a central German Muschelkalk landscape, Front. Earth Sci., 4, 32, https://doi.org/10.3389/feart.2016.00032, 2016.
Lazar, C. S., Baker, B. J., Seitz, K., Hyde, A. S., Dick, G. J., Hinrichs, K. U., and Teske, A. P.: Genomic evidence for distinct carbon substrate preferences and ecological niches of Bathyarchaeota in estuarine sediments, Environ. Microbiol., 18, 1200–1211, https://doi.org/10.1111/1462-2920.13142, 2016a. Lazar, C., Wenke, S., Lehmann, R., Herrmann, M., Schwab, V.,
Totsche, K. U., Akob, D. M., and Küsel, K.: Ecophysiology of uncultured Archaea in groundwater and carbonate rocks, submit-ted, 2016b.
Matter, J. M., Stute, M., Snæbjörnsdottir, S. Ó., Oelkers, E. H., Gis-lason, S. R., Aradottir, E. S., Sigfusson, B., Gunnarsson, I., Sig-urdardottir, H., Gunnlaugsson, E., Axelsson, G., Alfredsson, H. A., Wolff-Boenisch, D., Mesfin, K., Taya, D. F. d. l. R., Hall, J., Dideriksen, K., and Broecker, W. S.: Rapid carbon mineral-ization for permanent disposal of anthropogenic carbon dioxide emissions, Science, 352, 1312–1314, 2016.
Miller, H. M., Matter, J. M., Kelemen, P., Ellison, E. T., Con-rad, M. E., Fierer, N., Ruchala, T., Tominaga, M., and Tem-pleton, A. S.: Modern water/rock reactions in Oman hy-peralkaline peridotite aquifers and implications for micro-bial habitability, Geochim. Cosmochim. Ac., 179, 217–241, https://doi.org/10.1016/j.gca.2016.01.033, 2016.
Mook, W. G., Bommerson, J. C., and Staverman, W. H.: Car-bon Isotope Fractionation between Dissolved BicarCar-bonate and Gaseous Carbon-Dioxide, Earth Planet. Sc. Lett., 22, 169–176, https://doi.org/10.1016/0012-821x(74)90078-8, 1974.
NRC: Basic research opportunities in earth science, edited by: Press, N. A., National Academy Press, Washington DC, https://doi.org/10.17226/9981, 2001.
Plummer, L. N., Prestemon, E. C., and Parkhurst, D. L.: An inter-active code (NETPATH) for modeling net geochemical reactions along a flow path, version 2.0. US Geol. Surv., Water Resour. Invest. Rep. 94-4169:130, 1994.
Richter, D. D., Markewitz, D., Trumbore, S. E., and Wells, C. G.: Rapid accumulation and turnover of soil car-bon in a re-establishing forest, Nature, 400, 56–58, https://doi.org/10.1038/21867, 1999.
Sampling Procedures for Isotope Hydrology, available at: http://www-naweb.iaea.org/, last access: 5 October 2016, 2009. Scheibe, A., Krantz, L., and Gleixner, G.: Simultaneous
determi-nation of the quantity and isotopic signature of dissolved organic matter from soil water using high-performance liquid chromatog-raphy/isotope ratio mass spectrometry, Rapid Commun. Mass Sp., 26, 173–180, https://doi.org/10.1002/Rcm.5311, 2012. Schiff, S. L., Aravena, R., Trumbore, S. E., Hinton, M. J.,
El-good, R., and Dillon, P. J.: Export of DOC from forested catchments on the Precambrian Shield of Central Ontario: Clues from C-13 and C-14, Biogeochemistry, 36, 43–65, https://doi.org/10.1023/a:1005744131385, 1997.
Schwab, V., Roth, V.-N., Gleixner, G., Lehmann, R., Pohnert, G., Trumbore, E. S., Küsel, K., and Totsche, K. U.: Functional di-versity of microbial communities in pristine aquifers inferred by PLFA- and sequencing-based approaches, Biogeosciences, 14, 2697–2714, https://doi.org/10.5194/bg-14-2697-2017, 2017a. Schwab, V., Nowak, M., Gleixner, G., Lehmann, R., Pohnert, G.,
Trumbore, E. S., Küsel, K., and Totsche, K. U.: Microbial car-bon cycling in different pristine limestone aquifers inferred from δ13C andδ14C values of in situ phospholipid fatty acids and car-bon sources, in preparation, 2017b.
Simkus, D. N., Slater, G. F., Lollar, B. S., Wilkie, K., Kieft, T. L., Magnabosco, C., Lau, M. C. Y., Pullin, M. J., Hendrickson, S. B., Wommack, K. E., Sakowski, E. G., van Heerden, E., Ku-loyo, O., Linage, B., Borgonie, G., and Onstott, T. C.: Varia-tions in microbial carbon sources and cycling in the deep con-tinental subsurface, Geochim. Cosmochim. Ac., 173, 264–283, https://doi.org/10.1016/j.gca.2015.10.003, 2016.
Stackebrandt, E., Sproer, C., Rainey, F. A., Burghardt, J., Pauker, O., and Hippe, H.: Phylogenetic analysis of the genus Desulfo-tomaculum: Evidence for the misclassification of Desulfotomac-ulum guttoideum and description of DesulfotomacDesulfotomac-ulum orientis as Desulfosporosinus orientis gen. nov., comb. nov., Int. J. Syst. Bacteriol., 47, 1134–1139, 1997.
Steinhof, A., Adamiec, G., Gleixner, G., van Klinken, G. J., and Wagner, T.: The new C-14 analysis laboratory in Jena, Germany, Radiocarbon, 46, 51–58, 2004.
Tamers, M. A., Stipp, J. J., and Weiner, R.: Radiocarbon Ages of Ground-Water as a Basis for Determination of Safe Limits of Aquifer Exploitation, Environ. Res., 9, 250–264, https://doi.org/10.1016/0013-9351(75)90005-5, 1975.
Druf-fel, E., and Trumbore, E. S., Springer International Publishing, Cham, 45–82, 2016.
van Breukelen, B. M., Griffioen, J., Röling, W. F. M., and van Verseveld, H. W.: Reactive transport modelling of biogeo-chemical processes and carbon isotope geochemistry inside a landfill leachate plume, J. Contam. Hydrol., 70, 249–269, https://doi.org/10.1016/j.jconhyd.2003.09.003, 2004.