https://doi.org/10.5194/hess-21-5415-2017 © Author(s) 2017. This work is distributed under the Creative Commons Attribution 3.0 License.
Impact of ENSO regimes on developing- and decaying-phase
precipitation during rainy season in China
Qing Cao1, Zhenchun Hao1,2, Feifei Yuan1, Zhenkuan Su1, Ronny Berndtsson3, Jie Hao4, and Tsring Nyima5
1State Key Laboratory of Hydrology Water Resources and Hydraulic Engineering, Hohai University, Nanjing, 210098, China 2National Cooperative Innovation Center for Water Safety & Hydro-Science, Hohai University, Nanjing, 210098, China 3Department of Water Resources Engineering and Center for Middle Eastern Studies, Lund University, P.O. Box 118, Lund, 22100, Sweden
4Nanjing Hydraulic Research Institute, Nanjing, 210098, China
5Investigation Bureau of Hydrology and Water Resources, Ali, Tibet Autonomous Region, 859000, China
Correspondence to:Zhenchun Hao ([email protected]) and Feifei Yuan ([email protected]) Received: 6 March 2017 – Discussion started: 4 April 2017
Revised: 20 September 2017 – Accepted: 25 September 2017 – Published: 6 November 2017
Abstract. This study investigated the influence of five El Niño–Southern Oscillation (ENSO) types on rainy-season precipitation in China: central Pacific warming (CPW), east-ern Pacific cooling (EPC), easteast-ern Pacific warming (EPW), conventional ENSO and ENSO Modoki. The multi-scale moving t test was applied to determine the onset and with-drawal of rainy season. Results showed that the precipita-tion anomaly can reach up to 30 % above average precip-itation during decaying CPW and EPW phases. Develop-ing EPW could cause decreasDevelop-ing precipitation over large ar-eas in China with 10–30 % lower than average precipita-tion in most areas. Convenprecipita-tional El Niño in the developing phase had the largest influence on ENSO-related precipita-tion among developing ENSO and ENSO Modoki regimes. Decaying ENSO also showed a larger effect on precipita-tion anomalies, compared to decaying ENSO Modoki. The difference between rainy-season precipitation under various ENSO regimes may be attributed to the combined influence of anti-cyclone in the western North Pacific and the Indian monsoon. Stronger monsoon and anti-cyclone are associated with enhanced rainy-season precipitation. The results sug-gest a certain predictability of rainy-season precipitation re-lated to ENSO regimes.
1 Introduction
pcipitation. However, such studies mainly concentrated on re-gional scales and single ENSO mode, rather than on conti-nental scale and various ENSO regimes, which is important for overall understanding of relationship between ENSO and Chinese rainy-season precipitation. In order to decipher this, it is necessary to explore the spatial pattern of precipitation during the rainy season under various ENSO regimes at the continental scale in China.
Different types of ENSO regimes have been demonstrated based on the Pacific spatial pattern SSTA (Kao and Yu, 2009; Larkin and Harrison, 2005; Ashok et al., 2007; Trenberth, 1997; Tedeschi et al., 2013; Kim et al., 2009). Conventional ENSO episodes, including El Niño (EN) and La Niña (LN), are defined based on SST anomalies in the Niño 3.4 re-gion, and El Niño is mainly characterized by eastern Pa-cific warming in the cold tongue of the eastern PaPa-cific Ocean (Kim et al., 2009). Several researchers have identified differ-ent episodes of SST in the Pacific, such as the cdiffer-entral Pa-cific warming and eastern PaPa-cific cooling (Larkin and Har-rison, 2005; Weng et al., 2007; Kao and Yu, 2009). Kim et al. (2009) divided ENSO into three types, i.e., central Pacific warming (CPW), eastern Pacific cooling (EPC) and eastern Pacific warming (EPW). The division of ENSO is also based on SSTA in Niño 3, Niño 3.4 and Niño 4 regions. Ashok et al. (2007) introduced a new type of ENSO event, ENSO Modoki, which is different from conventional ENSO. ENSO Modoki is characterized by positive SSTA in the central Pa-cific, bounded by negative SSTA in the western and eastern Pacific.
ENSO and ENSO Modoki have different influences on precipitation (Ashok et al., 2007, 2009; Weng et al., 2007; Taschetto and England, 2009). Q. Zhang et al. (2016) pointed out that CPW, EPC and EPW regimes showed various perfor-mance on seasonal precipitation over the Huaihe River basin. Precipitation below average usually occurs in southern China in ENSO Modoki years, whereas the conventional ENSO tends to imply precipitation above average (W. Zhang et al., 2014). In contrast, enhanced precipitation over the Huaihe River basin often occurs during decaying El Niño Modoki events in summer, whilst reduced precipitation signals are found in the corresponding season in the decaying year of El Niño (Feng et al., 2011). It can be seen that the influence of ENSO regimes on precipitation varies among locations in China. The National Climate Center (NCC) succeeded in predicting the severe flood over the Yangtze River basin in the typical El Niño year of 1997–1998. Nonetheless, NCC failed to predict the enhanced precipitation in the Huaihe River basin in 2002–2003, since it was an El Niño Modoki year rather than a conventional El Niño. This highlights the significance of correct distinguishing between ENSO and ENSO Modoki.
Different performance of precipitation under various ENSO regimes is associated with atmospheric circulation and monsoon (Tedeschi et al., 2013; Feng et al., 2010; Cai et al., 2010; Black et al., 2003; Chang et al., 2001; R. Zhang
et al., 2014; Onyutha and Willems, 2015). Wu et al. (2003) explained the physical mechanism of links between precipi-tation and SSTs through features of atmospheric circulation. Wang et al. (2004) pointed out that the local onset of rainy season in the South China Sea is related to mean summer monsoon onset. Cai et al. (2010) argued that a rainfall reduc-tion in South East Queensland in Australia is related to an eastward shift in the Walker circulation. Feng et al. (2011) pointed out that China rainfall anomalies were mainly due to anomalous anti-cyclonic flow in the western North Pacific associated with El Niño Modoki and El Niño events. Gerlitz et al. (2016) argued that ENSO-induced precipitation vari-ability in tropical regions is directly associated with the at-mospheric circulation. The atat-mospheric circulation and mon-soon have different influences on two types of ENSO (Feng and Li, 2013; Zhang et al., 2011; Zhou and Chan, 2007). As a consequence, the investigation of atmospheric circula-tion and monsoon is used to explain different performance of rainy-season precipitation anomalies under various ENSO regimes in this study.
850 mbar wind variability is associated with SSTA in the equatorial Pacific and precipitation anomalies in China (Zhang et al., 1999; Zhou and Chan, 2007; Wang et al., 2004; W. Zhang et al., 2016). Fan et al. (2013) pointed out that 850 mbar vector winds are related to the mois-ture transportation from western tropical Pacific to the sub-tropical region, which determines the precipitation over the Yangtze–Huai river valley region. Huang et al. (2004) and R. Zhang et al. (2014) presented the atmospheric circula-tion and monsoon variability by the composite distribucircula-tion of wind anomalies at 850 mbar in different phases of El Niño and La Niña to explain precipitation variation in China. Feng et al. (2011) compared the difference of 850 mbar wind anomalies in decaying ENSO and ENSO Modoki phases to explain the physical mechanism of seasonal precipitation variation in China. Hence, 850 mbar vector winds reflecting atmospheric circulation and monsoon variability are used to explore the underlying causes of precipitation anomalies in this study.
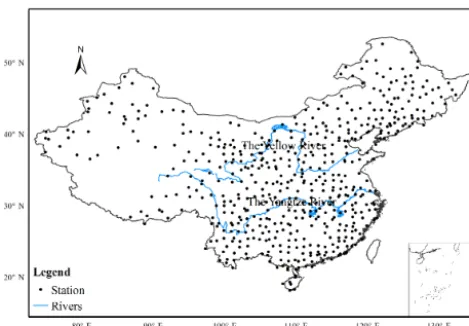
Figure 1.The spatial distribution of precipitation stations used in this study.
2 Study area and data
China, located in middle latitude in eastern Asia (18–54◦N, 73–135◦E), is the most populous country in the world (Fig. 1), with a population of over 1.381 billion and an area of approximately 9.6 million km2. China is mainly dominated by monsoon climate and mountain plateau climate, which lead to pronounced rainfall differences among different sea-sons and regions.
Daily precipitation data from 1960 to 2015 at 536 observa-tion staobserva-tions in China were selected for this study (Ren et al., 2012). The data were obtained from China Meteorological Data Sharing Service System, and the data quality has been regularly checked. The locations of the observation stations are shown in Fig. 1. The stations are distributed unevenly, with fewer stations in the northwestern part of China. Hence, we applied Kriging interpolation to induce a resolution of 0.2◦×0.2◦.
The dataset of National Oceanic and Atmospheric Ad-ministration (NOAA) extended reconstructed SST was used to identify different types of conventional ENSO (Huang et al., 2015). ENSO Modoki index (EMI) was obtained from the Japan Agency for Marine Science and Technol-ogy. In addition, the National Centers for Environmental Pre-diction (NCEP)/National Centers for Atmospheric Research (NCAR) reanalysis data were used to investigate underlying causes of the spatial pattern of precipitation under different ENSO regimes (Kalnay et al., 1996).
3 Methodology
3.1 Determination of rainy season
The onset and withdrawal of rainy season was determined by the multi-scale moving t test method. This method is char-acterized by the detection of mutation points between two
subsamples with equal sizen, where nis the length of the subsample (n=30, 31, . . . , 182/183; 182/183 corresponds to half the value of length of 1 year 365/366). Theoretically, the length of subsamples in this study ranged between 1 and 182/183. However, as the onset or withdrawal of the rainy season, it will not be considered if the length of the subsam-ple is one day or just several days when the abruption point is prominent. As a result, the length of the subsample is limited between 30 and 182/183. The determination of the mutation point can be described as (Fraedrich et al., 1997)
t (n, i)=(x¯i2− ¯xi1)n1/2(si22+s 2
i1)
−1/2, (1)
wherex¯i1andx¯i2defined as
¯ xi1=
i−1 X
j=i−n xj
n;s 2
i1=
i−1 X
j=i−n
(xj− ¯xi1)2/(n−1), (2)
¯ xi2=
i+n−1 X
j=i xj
n;s 2
i2=
i+n−1 X
j=i
(xj− ¯xi2)2/(n−1), (3)
andxi is daily precipitation for Julian dayi within 1 year
and for one station.x¯i1 andx¯i2 are the mean values of the subsamples before and after the Julian dayi, respectively.
Thet value calculated above was normalized by the 0.01 test value shown in Eq. (4), which is equal to the result of Mann–Kendall test at 0.05 significance level.
tr(n, i)=t (ni)/t0.01(n), (4)
wheretr(n, i) can be taken as the threshold to detect mu-tations. tr(n, i) >1.0 represents an increasing trend while tr(n, i) <1.0 is a decreasing trend. The onset of rainy season in this study was defined as the mutation point correspond-ing to a maximumtr(n, i)value. For this case, precipitation changes from a smaller to a higher value. Likewise, the with-drawal is defined as the changing point corresponding to a minimumtr(n, i)value.
3.2 Classification of ENSO and ENSO Modoki regimes Three types of ENSO were classified based on the definition proposed by Kim et al. (2009). The years dominated by CPW, EPC and EPW are listed in Table 1.
Table 1.Years dominated by CPW, EPC and EPW regimes during 1960–2015.
EPW EPC CPW
1965, 1972, 1976, 1982, 1987, 1997, 2015 1964, 1970, 1973, 1975, 1988, 1998, 1999, 2007, 2010, 2011
1963, 1969, 1991, 1994, 2002, 2004, 2009
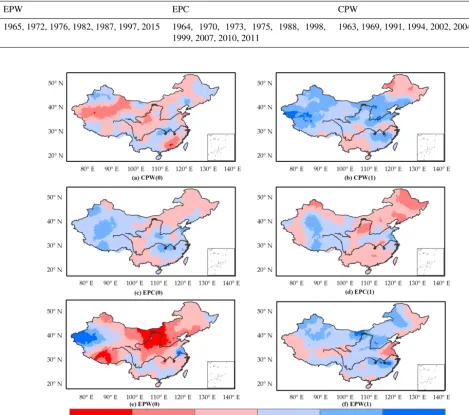
Figure 2.Spatial pattern for rainy-season precipitation anomaly (PARS) during the CPW (first row), EPC (second row) and EPW (third row) episodes in the phase of ENSO developing year (0) and decaying year (1). The sign “0” in the parentheses denotes ENSO developing year and “1” denotes decaying year.
This definition gives an opportunity to judge the ENSO type of the rainy season rather than the whole year, which is greater than definition proposed by Trenberth (1997). 3.3 Precipitation anomaly index during rainy season
(PARS)
Precipitation anomaly can present the difference of precip-itation between ENSO years and normal years and demon-strate the influence of ENSO regimes on precipitation more directly. Q. Zhang et al. (2013) used precipitation anomaly index to explore the effect of ENSO on precipitation in the East River basin, southern China. Q. Zhang et al. (2016)
in-vestigated the influence of ENSO and ENSO Modoki on sea-sonal precipitation over the Huaihe River basin by using pre-cipitation anomaly index. Prepre-cipitation anomaly index is de-fined as
PARSij=
¯ PRSij
¯ PRSNij
−1 !
×100 %, (5)
where PARSij denotes precipitation anomaly during rainy
season atith station injth year;PRS¯ ij denotes mean daily
precipitation during rainy season atith station injth year, andPRSN¯ ij denotes mean daily precipitation during rainy
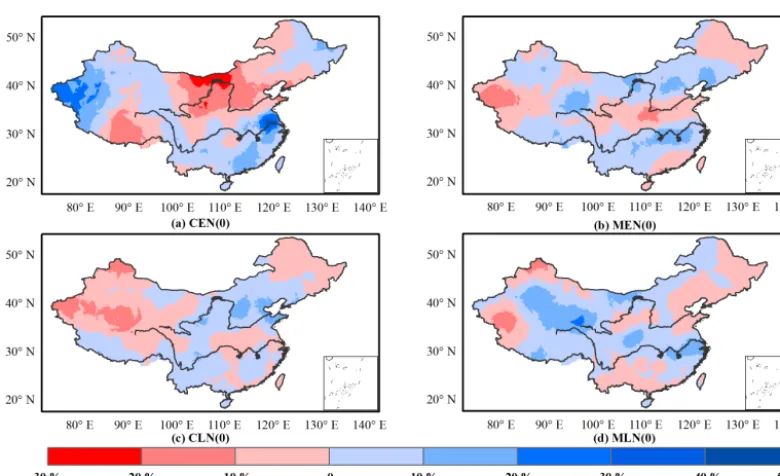
Figure 3. Spatial pattern of precipitation anomalies during rainy season (PARS) during developing (0) conventional ENSO and ENSO Modoki events.
4 Results and discussion
4.1 Precipitation anomaly during rainy season (PARS) influenced by CPW, EPC and EPW regimes
The spatial variability of PARS under CPW, EPC and EPW regimes in the phase of developing and decaying years is pre-sented in Fig. 2. The distribution of precipitation anomaly is irregular over the whole area in the developing phase of CPW. The coastal regions in southeastern China that had the largest amount of rainy-season precipitation presented the largest decreasing trend, with the precipitation anomaly reaching 30 % below average precipitation. The upper and middle reaches of the Yangtze River and the Yellow River showed decreasing precipitation, whereas the lower reaches had the opposite trend. The decaying CPW regime had a rel-atively regular spatial pattern. More specifically, most parts of China presented increasing precipitation during rainy sea-son, with the largest PARS being 20 % above average pre-cipitation. The distribution of PARS influenced by the de-caying CPW is similar to that by the developing EPC, with shrinking extent of enhanced precipitation in central China for developing EPC. The distribution of PARS is similar as well in the two phases of EPC (Fig. 2, second row), with pre-cipitation above average in northwestern China and precip-itation below average in northeastern China. The difference between the two phases lies in the increasing (decreasing) precipitation in southeastern China in the developing (de-caying) phase. Nonetheless, developing and decaying EPW (Fig. 2, third row) showed opposite spatial precipitation
pat-tern. Most parts of China presented dry signals in the phase of developing EPW, which became stronger northwards, and more than 30 % below average precipitation can be identified in northern China. However, there is above average precipi-tation in most regions of China in the case of decaying EPW, with PARS values ranging between 0 and 30 %. In summary, the CPW decaying phase (EPC developing phase) deserves more attention than the developing (decaying) phase, since it shows more prominent wet signals. Both phases are sig-nificant for the EPW regimes, due to the obvious dry (wet) signals shown in the developing (decaying) phase.
4.2 Precipitation anomaly during rainy season (PARS) impacted by ENSO and ENSO Modoki regime
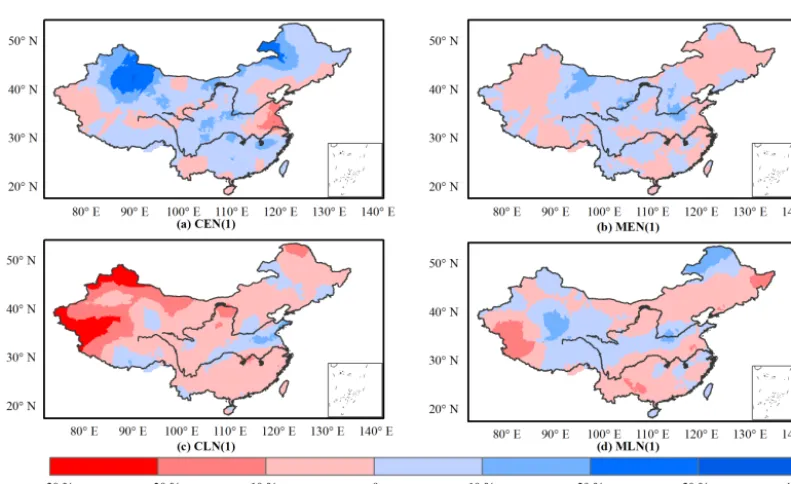
Figure 4.Spatial pattern of precipitation anomalies during rainy season (PARS) for decaying (1) conventional ENSO and ENSO Modoki events.
an opposite PARS pattern for developing El Niño Modoki, in comparison to developing CEN (Fig. 3b). Nonetheless, the two phases showed similar precipitation distribution, with re-duced precipitation in central China (approximately−10 %) and enhanced precipitation in southern China. Typically, de-veloping CEN demonstrated more obvious wet or dry sig-nals compared to MEN. Moreover, the wet and dry condi-tion for developing CEN is the most serious among all ENSO and ENSO Modoki regimes in both developing and decaying phases, with the largest precipitation anomaly reaching 50 % above average precipitation amount and lowest 30 % below. This means that developing CEN should be paid urgent at-tention to for flooding and drought monitoring. The spatial pattern of PARS for developing CLN presented similar sig-nals with developing MEN, with a shorter wet precipitation band in northern China for developing CLN (Fig. 3c). The in-creased precipitation was shifted westwards for the develop-ing MLN, compared to cold episodes of conventional ENSO (Fig. 3d). ENSO and ENSO Modoki regimes in the devel-oping phase presented various distribution of precipitation anomalies. Wet or dry signals are more easily shown for the warm episodes of conventional ENSO, in comparison to the other three regimes. Similar patterns of PARS for developing CLN and MEN should be further studied.
Decaying ENSO and ENSO Modoki years showed differ-ent features of PARS (Fig. 4). Most parts of China presdiffer-ented increasing precipitation for decaying CEN, with more than 30 % above average precipitation identified in northern China (Fig. 4a). The decaying phase of MEN (Fig. 4b) presented shrinking extent of enhanced precipitation, which was
con-densed in the central parts of China, ranging between 0 and 10 %. The result is consistent with conclusions from Feng et al. (2011), who found obvious rainfall anomalies in southern China for decaying El Niño and no prominent rainfall varia-tions in the corresponding phase of El Niño Modoki. In terms of the cold episodes of ENSO (Fig. 4c), approximately 95 % of China showed dry signals, and the condition was more serious eastwards, being 30 % below average precipitation amount. We can see that the spatial pattern of PARS for the decaying CLN is opposite to that of CEN. Decaying MLN (Fig. 4d) showed a larger extent of enhanced precipitation in a band stretching from western China to parts of the Yellow River basin, in comparison to CLN. In conclusion, the decay-ing phases of conventional ENSO showed more obvious wet or dry signals compared to ENSO Modoki, with most parts of China displaying increasing (decreasing) precipitation for the CEN (CLN).
Figure 5.Composites of 850 mbar vector wind for mainland China during CPW, EPC and EPW developing (0) and decaying (1) phases. Arrows show the direction of wind (m s−1); grey shaded areas denote wind speed above 3 m s−1.
be determined not only by ENSO but also by the combination of various drivers, which ought to be studied further.
4.3 Composites of circulation
Figure 5 presents the composites of 850 mbar vector wind for three types of ENSO. There is a strengthening of west-erly and southwestwest-erly wind in the decaying year of CPW (Fig. 5b), which brings more moisture to China, compared to developing CPW (Fig. 5a). This may explain the enhanced precipitation in decaying CPW (Fig. 2b). The difference be-tween developing and decaying EPC (Fig. 5c–d) lies in the shift of anti-cyclonic flow in the western part of North Pacific (WNP). The eastward anti-cyclone for the decaying EPC weakened the transportation of moisture in eastern China and caused reduced precipitation (Fig. 2d). The decaying EPW (Fig. 5f) experienced stronger western and southwest-ern wind but weakened anti-cyclone compared to the devel-oping phase (Fig. 5e). The WNP anti-cyclone could bring plentiful moisture to China, so weakened anti-cyclonic flow will cause reduced precipitation (Feng et al., 2011). How-ever, most parts of China presented wetter signals in the
phase of decaying EPW in comparison to developing EPW. Therefore, it can be pointed out that the India monsoon plays a more significant role in the formation of rainy-season pre-cipitation during EPW phases compared to the atmospheric circulation.
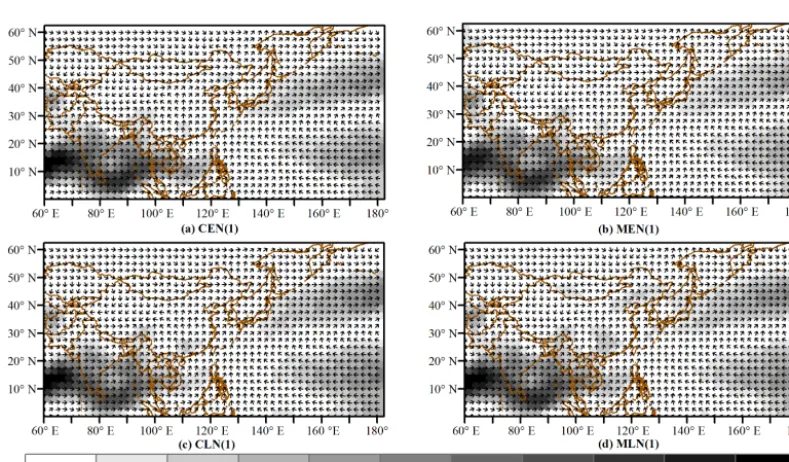
Figure 6 shows the underlying causes of different per-formance of conventional ENSO and ENSO Modoki in the developing phase by analysis of the 850 hp wind. Com-pared to developing CEN, developing MEN experienced re-duced precipitation in western China and generally enhanced precipitation in eastern parts under the combined influence of stronger monsoon and weakened anti-cyclone (Fig. 6a– b). Stronger anti-cyclonic flow in the phase of developing La Niña Modoki (Fig. 6d) may cause the enhanced precip-itation in western parts of China compared to conventional La Niña regime in developing years (Fig. 6c).
Figure 6.Composites of 850 mbar vector wind for mainland China during ENSO and ENSO Modoki developing (0) phases. Arrows show the direction of wind (m s−1); grey shaded areas denote wind speed above 3 m s−1.
Figure 7.Composites of 850 mbar vector wind for mainland China during ENSO and ENSO Modoki decaying (1) phases. Arrows show the direction of wind (m s−1); grey shaded areas denote wind speed above 3 m s−1
wind composites between decaying CLN and MLN indicates similar configuration, with stronger westerly wind and anti-cyclone causing enhanced precipitation for decaying MLN.
In summary, westerly winds seem to play more signifi-cant role in the phase of CPW and EPW, while developing La Niña and La Niña Modoki are dominated by the anti-cyclone. The spatial pattern of PARS is the reflection of
com-bined influence of westerly winds and anti-cyclonic flow for the EPC and decaying ENSO and ENSO Modoki regimes.
[image:8.612.100.495.344.575.2]south-western winds are related to increasing precipitation. It is in agreement with the research of Zhang et al. (1996) and Wang et al. (2000), who pointed out that southeastern and southwestern winds could substantially enhance the mois-ture transportation to China. Wu et al. (2003) also found that East Asian monsoon is positively related to precipita-tion variaprecipita-tions, which is consistent with our result. Like-wise, the westward and stronger anti-cyclone is related to en-hanced PARS. Wu et al. (2003) reported that the anomalous low-level anti-cyclone is determined by large-scale equato-rial heating anomalies and local air–sea interactions. West-erlies and anti-cyclone are of dominant importance for the ENSO-induced precipitation during the rainy season. How-ever, cyclonic flow may have larger influence on Chinese precipitation under certain circumstances. For example, the autumn drought in southwest China in 2009 was determined by a strong cyclone in WNP for ENSO Modoki (W. Zhang et al., 2013b). Feng et al. (2011) also revealed that the WNP circulation is cyclonic in winter and then becomes weak in the following spring and anti-cyclonic flow in summer for El Niño Modoki. As a consequence, WNP anti-cyclone has a larger effect on East Asian precipitation on the inter-annual or inter-decadal scale, but anti-cyclone and cyclone are both crucial for the determination of precipitation on the annual or smaller scale.
5 Conclusion
This study investigated the distribution of PARS under var-ious ENSO types in developing and decaying phases and their underlying causes. It was found that northwestern, cen-tral and southeastern China experience increasing precipita-tion for decaying CPW and EPW, and positive precipitaprecipita-tion anomaly ranges from 0 to 30 % due to the stronger west-erly and southwestwest-erly winds. The developing phase of EPW presents overall negative rainy-season precipitation anoma-lies in China with more than 30 % below average precip-itation identified in many parts of the country, which is a result of weak westerly winds. The different spatial distri-bution of rainy-season precipitation under developing and decaying ENSO and ENSO Modoki regimes was also ex-amined. Conventional El Niño in developing years showed larger influence on precipitation during rainy season in China as compared to developing CLN, MEN and MLN. Conven-tional ENSO in the decaying phase is more likely to show wet and dry signals in comparison to the corresponding ENSO Modoki regimes. Different performance of conven-tional ENSO and ENSO Modoki is a reflection of combined influence of the India monsoon and the WNP anti-cyclone. This study improved our understanding on the spatial vari-ability of ENSO-induced precipitation during rainy season in China and the underlying causes. These results suggest that improved predictability can be achieved for rainy-season precipitation related to ENSO regimes. We suggest that
fur-ther work should focus on the influence of interactive ENSO and other drivers on precipitation to evaluate and improve the predictive ability.
Data availability. The daily precipitation, NOAA extended recon-structed SST, ENSO Modoki index (EMI) and the NCEP-NCAR reanalysis datasets used in this study are available for download un-der the following URLs:
– daily precipitation: http://data.cma.cn/data/detail/dataCode/ SURF_CLI_CHN_MUL_DAY_V3.0.html (Ren et al., 2012) – NOAA extended reconstructed SST: https://data.nodc.noaa.
gov/cgi-bin/iso?id=gov.noaa.ncdc:C00884 (Huang et al., 2015)
– EMI: http://www.jamstec.go.jp/frsgc/research/d1/iod/DATA/ emi.monthly.txt (Japan Agency for Marine Science and Technology, 2017)
– NCEP/NCAR reanalysis data: https://www.esrl.noaa.gov/psd/ data/gridded/data.ncep.reanalysis.html (Kalnay et al., 1996)
Author contributions. QC, ZH and FY conceived the study. All au-thors contributed to writing the paper.
Competing interests. The authors declare that they have no conflict of interest.
Acknowledgements. Funding from the National Key Research Projects (grant no. 2016YFC0402704) and the National Natural Science Foundation of China (grant no. 41371047) are gratefully acknowledged. Support from the China Postdoctoral Science Foundation (grant no. 2016M601711) and the Jiangsu Planned Projects for Postdoctoral Research Funds (grant no. 1601027B) are appreciated.
Edited by: Luis Samaniego
Reviewed by: two anonymous referees
References
Ashok, K., Behera, S. K., Rao, S. A., Weng, H., and Yamagata, T.: El Niño Modoki and its possible tele-connection, J. Geophys. Res.-Oceans, 112, C11007, https://doi.org/10.1029/2006JC003798, 2007.
Ashok, K., Tam, C. Y., and Lee, W. J.: ENSO Modoki im-pact on the Southern Hemisphere storm track activity dur-ing extended austral winter, Geophys. Res. Lett., 36, L12705, https://doi.org/10.1029/2009gl038847, 2009.
Brigode, P., Micovic, Z., Bernardara, P., Paquet, E., Garavaglia, F., Gailhard, J., and Ribstein, P.: Linking ENSO and heavy rain-fall events over coastal British Columbia through a weather pattern classification, Hydrol. Earth Syst. Sci., 17, 1455–1473, https://doi.org/10.5194/hess-17-1455-2013, 2013.
Cai, W., Van Rensch, P., Cowan, T., and Sullivan, A.: Asym-metry in ENSO teleconnection with regional rainfall, its mul-tidecadal variability, and impact, J. Climate, 23, 4944–4955, https://doi.org/10.1175/2010JCLI3501.1, 2010.
Cai, X.: Relationship between West Pacific subtropical high and ENSO and its influence on rainfall distribution of rainy season in Fujian, J. Trop. Meteorol., 9, 57–63, http://www.cqvip.com/ qk/85390x/2003001/8073469.html, 2003.
Chan, J. C. L.: PDO, ENSO and the early summer monsoon rainfall over south China, Geophys. Res. Lett., 32, L08810, https://doi.org/10.1029/2004GL022015, 2005.
Chang, C., Zhang, Y., and Li, T.: Interannual and inter-decadal variations of the East Asian summer monsoon and tropical Pacific SSTs. Part I: Roles of the subtropical ridge, J. Climate, 13, 4310–4325, https://doi.org/10.1175/1520-0442(2000)013<4310:IAIVOT>2.0.CO;2, 2000.
Chang, C., Harr, P., and Ju, J.: Possible roles of Atlantic circula-tions on the weakening Indian monsoon rainfall–ENSO relation-ship, J. Climate, 14, 2376–2380, https://doi.org/10.1175/1520-0442(2001)014<2376:PROACO>2.0.CO;2, 2001.
Dai, A. and Wigley, T. M. L.: Global patterns of ENSO-induced precipitation, Geophys. Res. Lett., 27, 1283–1286, https://doi.org/10.1029/1999gl011140, 2000.
Fan, L., Shin, S.-I., Liu, Q., and Liu, Z.: Relative impor-tance of tropical SST anomalies in forcing East Asian sum-mer monsoon circulation, Geophys. Res. Lett., 40, 2471–2477, https://doi.org/10.1002/grl.50494, 2013.
Feng, J. and Li, J.: Influence of El Niño Modoki on spring rainfall over south China, J. Geophys. Res., 116, D13102, https://doi.org/10.1029/2010jd015160, 2011.
Feng, J. and Li, J.: Contrasting impacts of two types of ENSO on the boreal spring Hadley circulation, J. Climate, 26, 4773–4789, https://doi.org/10.1175/jcli-d-12-00298.1, 2013.
Feng, J., Wang, L., Chen, W., Fong, S. K., and Leong, K. C.: Differ-ent impacts of two types of Pacific Ocean warming on Southeast Asian rainfall during boreal winter, J. Geophys. Res.-Atmos., 115, D24122, https://doi.org/10.1029/2010jd014761, 2010. Feng, J., Chen, W., Tam, C. Y., and Zhou, W.: Different
im-pacts of El Niño and El Niño Modoki on China rainfall in the decaying phases, Int. J. Climatol., 31, 2091–2101, https://doi.org/10.1002/joc.2217, 2011.
Fraedrich, K., Jiang, J., Gerstengarbe, F. W., and Werner, P. C.: Multiscale detection of abrupt climate changes: application to River Nile flood levels, Int. J. Clima-tol., 17, 1301–1315, https://doi.org/10.1002/(SICI)1097-0088(199710)17:12<1301::AID-JOC196>3.0.CO;2-W, 1997. Gerlitz, L., Vorogushyn, S., Apel, H., Gafurov, A.,
Unger-Shayesteh, K., and Merz, B.: A statistically based seasonal pre-cipitation forecast model with automatic predictor selection and its application to central and south Asia, Hydrol. Earth Syst. Sci., 20, 4605–4623, https://doi.org/10.5194/hess-20-4605-2016, 2016.
Huang, B., Banzon, V. F., Freeman, E., Lawrimore, J., Liu, W., Peterson, T. C., Smith, T. M., Thorne, P. W., Woodruff, S. D.,
and Zhang, H.-M.: Extended Reconstructed Sea Surface Tem-perature (ERSST), Version 4, available at: https://data.nodc.noaa. gov/cgi-bin/iso?id=gov.noaa.ncdc:C00884 (last access: Septem-ber 2017), 2015.
Huang, R., Chen, W., Yang, B., and Zhang, R.: Recent advances in studies of the interaction between the East Asian winter and summer monsoons and ENSO cycle, Adv. Atmos. Sci., 21, 407– 424, https://doi.org/10.1007/BF02915568, 2004.
Japan Agency for Marine Science and Technology: ENSO Modoki index Dataset: http://www.jamstec.go.jp/frsgc/research/d1/iod/ DATA/emi.monthly.txt, last access: August 2017.
Jiang, P., Gautam, M. R., Zhu, J., and Yu, Z.: How well do the GCMs/RCMs capture the multi-scale temporal variability of pre-cipitation in the Southwestern United States?, J. Hydrol., 479, 75–85, https://doi.org/10.1016/j.jhydrol.2012.11.041, 2013. Jiang, P., Yu, Z., Gautam, M. R., Yuan, F., and Acharya, K.: Changes
of storm properties in the United States: Observations and multi-model ensemble projections, Global Planet. Change, 142, 41–52, https://doi.org/10.1016/j.gloplacha.2016.05.001, 2016.
Kalnay, E., Kanamitsu, M., Kistler, R., Collins, W., Deaven, D., Gandin, L., Iredell, M., Saha, S., White, G., and Woollen, J.: The NCEP/NCAR 40-year reanalysis project, B. Am. Meteorol. Soc., 77, 437–471, https://doi.org/10.1175/1520-0477(1996)077<0437:TNYRP>2.0.CO;2, 1996.
Kao, H.-Y. and Yu, J.-Y.: Contrasting eastern-Pacific and central-Pacific types of ENSO, J. Climate, 22, 615–632, https://doi.org/10.1175/2008JCLI2309.1, 2009.
Kim, H.-M., Webster, P. J., and Curry, J. A.: Impact of shifting patterns of Pacific Ocean warming on North Atlantic tropical cyclones, Science, 325, 77–80, https://doi.org/10.1126/science.1174062, 2009.
Larkin, N. K. and Harrison, D.: On the definition of El Niño and as-sociated seasonal average US weather anomalies, Geophys. Res. Lett., 32, L13705, https://doi.org/10.1029/2005GL022738, 2005. Li, Z., Cai, W., and Lin, X.: Dynamics of changing impacts of tropi-cal Indo-Pacific variability on Indian and Australian rainfall, Sci. Rep., 6, 31767, https://doi.org/10.1038/srep31767, 2016. Liu, X., Yuan, H., and Guan, Z.: Effects of ENSO on the relationship
between IOD and summer rainfall in China, J. Trop. Meteorol., 15, 59–62, 2009.
Lu, R.: Interannual variation of North China rainfall in rainy season and SSTs in the equatorial eastern Pacific, Sci. Bull., 50, 2069– 2073, 2005.
Marteau, R., Sultan, B., Moron, V., Alhassane, A., Baron, C., and Traoré, S. B.: The onset of the rainy season and farmers’ sowing strategy for pearl millet cultivation in Southwest Niger, Agric. Forest Meteorol., 151, 1356–1369, https://doi.org/10.1016/j.agrformet.2011.05.018, 2011.
Niu, N. and Li, J.: Interannual variability of autumn precipita-tion over South China and its relaprecipita-tion to atmospheric circu-lation and SST anomalies, Adv. Atmos. Sci., 25, 117–125, https://doi.org/10.1007/s00376-008-0117-2, 2008.
Onyutha, C. and Willems, P.: Spatial and temporal variability of rainfall in the Nile Basin, Hydrol. Earth Syst. Sci., 19, 2227– 2246, https://doi.org/10.5194/hess-19-2227-2015, 2015. Ouyang, R., Liu, W., Fu, G., Liu, C., Hu, L., and Wang, H.:
Link-ages between ENSO/PDO signals and precipitation, streamflow in China during the last 100 years, Hydrol. Earth Syst. Sci., 18, 3651–3661, https://doi.org/10.5194/hess-18-3651-2014, 2014. Preethi, B., Sabin, T. P., Adedoyin, J. A., and Ashok, K.:
Im-pacts of the ENSO Modoki and other tropical Indo-Pacific climate-drivers on African rainfall, Sci. Rep., 5, 16653, https://doi.org/10.1038/srep16653, 2015.
Ren, Z., Zou, F., Yu, Y., Wang, A., Zhang, Z., Fan, S., Zhang, Z., and Sun, C.: China Land Climate Dataset Version 3.0, available at: http://data.cma.cn/data/detail/dataCode/SURF_ CLI_CHN_MUL_DAY_V3.0.html (last access: August 2017), 2012.
Taschetto, A. S. and England, M. H.: El Niño Modoki im-pacts on Australian rainfall, J. Climate, 22, 3167–3174, https://doi.org/10.1175/2008jcli2589.1, 2009.
Tedeschi, R. G., Cavalcanti, I. F. A., and Grimm, A. M.: Influences of two types of ENSO on South American precipitation, Int. J. Climatol., 33, 1382–1400, https://doi.org/10.1002/joc.3519, 2013.
Trenberth, K. E.: The definition of El Niño, B. Am. Me-teorol. Soc., 78, 2771–2777, https://doi.org/10.1175/1520-0477(1997)078<2771:TDOENO>2.0.CO;2, 1997.
Wang, B., Wu, R., and Fu, X.: Pacific–East Asian telecon-nection: how does ENSO affect East Asian climate?, J. Climate, 13, 1517–1536, https://doi.org/10.1175/1520-0442(2000)013<1517:PEATHD>2.0.CO;2, 2000.
Wang, B., Zhang, Y., and Lu, M.: Definition of South China Sea monsoon onset and commencement of the East Asia summer monsoon, J. Climate, 17, 699–710, https://doi.org/10.1175/2932.1, 2004.
Wang, C. and Wang, X.: Classifying El Niño Modoki I and II by Different Impacts on Rainfall in Southern China and Typhoon Tracks, J. Climate, 26, 1322–1338, https://doi.org/10.1175/jcli-d-12-00107.1, 2013.
Wang, L., Chen, W., and Huang, R.: Interdecadal modu-lation of PDO on the impact of ENSO on the east Asian winter monsoon, Geophys. Res. Lett., 35, L20702, https://doi.org/10.1029/2008GL035287, 2008.
Wang, X., Li, C., and Zhou, W.: Interdecadal variation of the relationship between Indian rainfall and SSTA modes in the Indian Ocean, Int. J. Climatol., 26, 595–606, https://doi.org/10.1002/joc.1283, 2006.
Weng, H., Ashok, K., Behera, S. K., Rao, S. A., and Yamagata, T.: Impacts of recent El Niño Modoki on dry/wet conditions in the Pacific rim during boreal summer, Clim. Dynam., 29, 113–129, https://doi.org/10.1007/s00382-007-0234-0, 2007.
Weng, H., Wu, G., Liu, Y., Behera, S. K., and Yamagata, T.: Anomalous summer climate in China influenced by the tropical Indo-Pacific Oceans, Clim. Dynam., 36, 769–782, https://doi.org/10.1007/s00382-009-0658-9, 2011.
Wu, R., Hu, Z.-Z., and Kirtman, B. P.: Evolution of ENSO-related rainfall anomalies in East Asia, J. Cli-mate, 16, 3742–3758, https://doi.org/10.1175/1520-0442(2003)016<3742:EOERAI>2.0.CO;2, 2003.
Wu, R., Yang, S., Wen, Z., Huang, G., and Hu, K.: Interdecadal change in the relationship of southern China summer rainfall with tropical Indo-Pacific SST, Theor. Appl. Climatol., 108, 119– 133, https://doi.org/10.1007/s00704-011-0519-4, 2012. Xiao, M., Zhang, Q., and Singh, V. P.: Influences of ENSO,
NAO, IOD and PDO on seasonal precipitation regimes in the Yangtze River basin, China, Int. J. Climatol., 35, 3556–3567, https://doi.org/10.1002/joc.4228, 2015.
Xu, K., Zhu, C., and Wang, W.: The cooperative impacts of the El Niño-Southern Oscillation and the Indian Ocean Dipole on the interannual variability of autumn rainfall in China, Int. J. Clima-tol., 36, 1987–1999, https://doi.org/10.1002/joc.4475, 2016. Yuan, F., Berndtsson, R., Uvo, C. B., Zhang, L., and Jiang, P.:
Summer precipitation prediction in the source region of the Yel-low River using climate indices, Hydrol. Res., 47, 847–856, https://doi.org/10.2166/nh.2015.062, 2016a.
Yuan, F., Yasuda, H., Berndtsson, R., Bertacchi Uvo, C., Zhang, L., Hao, Z., and Wang, X.: Regional sea-surface temperatures explain spatial and temporal variation of summer precipitation in the source region of the Yellow River, Hydrol. Sci. J., 61, 1383– 1394, https://doi.org/10.1080/02626667.2015.1035658, 2016b. Zaroug, M. A. H., Giorgi, F., Coppola, E., Abdo, G. M., and Eltahir,
E. A. B.: Simulating the connections of ENSO and the rainfall regime of East Africa and the upper Blue Nile region using a climate model of the Tropics, Hydrol. Earth Syst. Sci., 18, 4311– 4323, https://doi.org/10.5194/hess-18-4311-2014, 2014. Zhang, Q., Li, J., Singh, V. P., Xu, C. Y., and Deng, J.:
In-fluence of ENSO on precipitation in the East River basin, South China, J. Geophys. Res.-Atmos., 118, 2207–2219, https://doi.org/10.1002/jgrd.50279, 2013.
Zhang, Q., Wang, Y., Singh, V. P., Gu, X., Kong, D., and Xiao, M.: Impacts of ENSO and ENSO Modoki+A regimes on sea-sonal precipitation variations and possible underlying causes in the Huai River basin, China, J. Hydrol., 533, 308–319, https://doi.org/10.1016/j.jhydrol.2015.12.003, 2016.
Zhang, R., Sumi, A., and Kimoto, M.: Impact of El Niño on the East Asian monsoon : A Diagnostic Study of the ’86/87 and ’91/92 Events, J. Meteorol. Soc. Jpn., 74, 49–62, https://doi.org/10.2151/jmsj1965.74.1_49, 1996.
Zhang, R., Sumi, A., and Kimoto, M.: A diagnostic study of the impact of El Niño on the precipitation in China, Adv. Atmos. Sci., 16, 229–241, https://doi.org/10.1007/BF02973084, 1999. Zhang, R., Li, T., Wen, M., and Liu, L.: Role of intraseasonal
os-cillation in asymmetric impacts of El Niño and La Niña on the rainfall over southern China in boreal winter, Clim. Dynam., 45, 559–567, https://doi.org/10.1007/s00382-014-2207-4, 2014. Zhang, W., Jin, F.-F., Li, J., and Ren, H.-L.: Contrasting
im-pacts of two-type El Niño over the Western North Pacific during boreal autumn, J. Meteorol. Soc. Jpn., 89, 563–569, https://doi.org/10.2151/jmsj.2011-510, 2011.
Zhang, W., Jin, F.-F., Zhao, J.-X., Qi, L., and Ren, H.-L.: The possi-ble influence of a nonconventional El Niño on the severe autumn drought of 2009 in Southwest China, J. Climate, 26, 8392–8405, https://doi.org/10.1175/jcli-d-12-00851.1, 2013.
Zhang, W., Jin, F. F., Stuecker, M. F., Wittenberg, A. T., Timmer-mann, A., Ren, H. L., Kug, J. S., Cai, W., and Cane, M.: Unrav-eling El Niño’s impact on the East Asian Monsoon and Yangtze River summer flooding, Geophys. Res. Lett., 43, 11375–11382, https://doi.org/10.1002/2016GL071190, 2016.