www.hydrol-earth-syst-sci.net/16/1137/2012/ doi:10.5194/hess-16-1137-2012
© Author(s) 2012. CC Attribution 3.0 License.
Earth System
Sciences
Influences on flood frequency distributions in Irish river catchments
S. Ahilan, J. J. O’Sullivan, and M. Bruen
School of Civil, Structural and Environmental Engineering, University College Dublin, Dublin, Ireland
Correspondence to: J. J. O’Sullivan ([email protected])
Received: 1 March 2011 – Published in Hydrol. Earth Syst. Sci. Discuss.: 1 April 2011 Revised: 13 February 2012 – Accepted: 15 February 2012 – Published: 5 April 2012
Abstract. This study explores influences on flood frequency
distributions in Irish rivers. A Generalised Extreme Value (GEV) type I distribution is recommended in Ireland for es-timating flood quantiles in a single site flood frequency anal-ysis. This paper presents the findings of an investigation that identified the GEV statistical distributions that best fit the an-nual maximum (AM) data series extracted from 172 gauging stations of 126 rivers in Ireland. Analysis of these data was undertaken to explore hydraulic and hydro-geological factors that influence flood frequency distributions. A hierarchical approach of increasing statistical power that used probability plots, moment and L-moment diagrams, the Hosking good-ness of fit algorithm and a modified Anderson-Darling (A-D) statistical test was followed to determine whether a type I, type II or type III distribution was valid. Results of the Hosk-ing et al. method indicated that of the 143 stations with flow records exceeding 25 yr, data for 95 (67 %) was best repre-sented by GEV type I distributions and a further 9 (6 %) and 39 (27 %) stations followed type II and type III distributions respectively. Type I, type II and type III distributions were determined for 83 (58 %), 16 (11 %) and 34 (24 %) stations respectively using the modified A-D method (data from 10 stations was not represented by GEV family distributions). The influence of karst terrain on these flood frequency distri-butions was assessed by incorporating results on an Arc-GIS platform showing karst features and using Monte Carlo sim-ulations to assess the significance of the number and clus-tering of the observed distributions. Floodplain effects were identified by using two-sample t-tests to identify statistical correlations between the distributions and catchment prop-erties that are indicative of strong floodplain activity. The data reveals that type I distributions are spatially well repre-sented throughout the country. While also well reprerepre-sented throughout the country, the majority of type III distributions appear in areas where attenuation influences from floodplains are likely. The majority of type II distributions appear in a single cluster in a region in the west of the country that is
underlain by karst but importantly, is characterised by shal-low of glacial drift with frequent exposures of rock outcrops. The presence of karst in river catchments would be expected to provide additional subsurface storage and in this regard, type III distributions might be expected. The prevalence of type II distributions in this area reflects the finite nature of this storage. For prolonged periods of rainfall, rising ground-water levels will fill karst voids, remove subsurface storage and contribute to recharge related sinkhole flooding. Situa-tions where rainfall intensities exceed karst percolation rates also produce high levels of surface runoff (discharge related flooding) that can promote type II distributions in nearby river catchments. Results therefore indicate that in some in-stances, assuming type I distributions is incorrect and may result in erroneous estimates of flood quantiles at these loca-tions. Where actual data follows a type II distribution, flood quantiles may be underestimated by in excess of 35 % and for type III distributions, overestimates by over 25 % can occur.
1 Introduction
Flood studies often require the estimation of peak discharges for specified return periods. This is commonly based on a frequency analysis of a long record of annual maximum (AM) data at or near the site in question. Ideally, the return period of the estimated flow in a single site analysis should not exceed the length in years of the available flow record by more than a factor of two (at least 50 yr of data should be used to estimate the 100-yr flood) (NERC, 1975). Should record lengths not meet this requirement or where the avail-able hydrometric data is of poor quality, a regional approach to flood frequency analysis is recommended.
The appropriate flood frequency distribution for modelling AM series has received widespread attention throughout the world (Benson, 1968; McMahon and Srikanthan, 1981; Ah-mad et al., 1988, Cunnane, 1989; Bobee et al., 1992; El
Adlouni et al., 2008). However, the method followed in Ire-land for estimating a design flood follows that in the Flood Studies Report FSR (NERC, 1975) in which, similar to the UK, a Generalised Extreme Value (GEV) distribution is rec-ommended. Findings from the recently conducted Flood Studies Update (FSU) programme in Ireland further rein-forced the choice of GEV distributions for modelling Irish AM data (Cunnane et al., 2008). The GEV distribution is a flexible three parameter model that encompasses the type I – Gumbel, type II – Frechet and type III – Weibull ex-treme value distributions. The cumulative distribution func-tion (CDF) of a GEV distribufunc-tion can be written as:
F (x) = expn−[1 −k (x − u)/α]1/ ko k 6= 0 (1) F (x) = exp{−exp [−(x−u)/α]} k = 0 (2) whereuandαare location and scale parameters of the GEV distribution that are estimated using the sample mean and variance respectively. The value of the shape parameter,k, determines the extreme value type I, II and III distribution. Specifically, the three cases k= 0, k <0 and k >0 corre-spond to the Gumbel, Frechet, and Weibull distributions. The inverse relationships of Eqs. (1) and (2) respectively, are: x = u +α
n
1 −(−lnF (x))k
o
/ k k 6= 0 (3)
x = u −αln(−lnF (x)) k = 0 (4)
In Ireland, as in many countries across the world, a GEV type I distribution is commonly used to estimate flood quan-tiles from single site flood frequency analysis. Application of a two parameter GEV type I model in flood frequency analysis is relatively simple (Phien, 1987) and is associated with lower standard errors for parameter and corresponding quantile estimates for shorter records (McKerchar and Pear-son, 1990). However, the recommendation of a Gumbel two-parameter flood frequency distribution at all locations in a drainage network is not sufficiently flexible to account for variations in the shape of the flood frequency distribution that potentially arise from climatic, hydraulic, hydrological and hydro-geological influences in Irish catchments. Climatic variations, influenced by the Atlantic Ocean and the warm-ing effects of the Gulf Stream are reflected in the marked dif-ferences in rainfall across the country. Mountainous regions in the west and south-west of the country can experience an-nual rainfall totals in excess of 2800 mm that contrast sharply with rainfall totals of less than 1000 mm in large areas of the east of the country. Hydrological and hydraulic influences include the effects of attenuation arising from lakes and bogs and from floodplain effects. Hydro-geological influences in-clude the likely effects on flood generation from carbonif-erous limestone and its associated karst features which are prevalent in over half of the country. Application of the GEV type I distribution without due consideration of the impacts of these features may produce errors in estimates of flood
quantiles. Therefore, in some situations it may be appro-priate to use a three-parameter GEV distribution that in ad-dition to scale and location parameters, is also described in terms of a shape parameter (Jenkinson, 1969). Furthermore, and in the context of using groups of similar catchments or “pooling groups” to determine growth factors that can scale index floods to provide flow estimates of required return peri-ods, data from floodplain-affected (FPA) areas has the capac-ity to contaminate growth curve estimates at non FPA sites. Similarly, it is doubtful that without detailed consideration of the physical and baseflow characteristics of the mechanics of flood generation, that data from a regional flood frequency analysis in a karst region, could be used to accurately predict a flood quantile at another site in the same region (Benzeden et al., 1993).
This paper explores hydraulic and hydro-geological influ-ences in flood frequency distributions in Irish river catch-ments. Annual maximum (AM) data sets of 172 gauging stations in Ireland were analysed and the GEV statistical distributions that best fit the hydrological data were identi-fied. The dataset covered a full range of climatic, hydro-logical, hydraulic and hydro-geological characteristics that are important for flood generation in Ireland. The influ-ence of karst terrain on these flood frequency distributions is assessed by incorporating results on an Arc-GIS platform showing karst features and using Monte Carlo simulations to assess the significance of the number and clustering of the observed distributions. Floodplain effects are identified by using two-sample t-tests to identify statistical correlations between the distributions and catchment properties that are indicative of strong floodplain activity. Potential errors in flood estimates are obtained by comparing flood quantiles from GEV distributions to those assuming a GEV type I distribution.
2 Background
2.1 Hydro-geological influences
Over half of Ireland is underlain by Carboniferous lime-stone and lowland karsts occupy approximately 75 % of this limestone area (Coxon, 1987; Williams, 1970). The hydrol-ogy and geomorpholhydrol-ogy of Irish karstic terrain is intimately and genetically linked to perhaps a greater extent than with any other rock type (Drew, 1990). Conditions however, are not uniform throughout the country. Deposits of glacial drift mantle the bedrock over most low lying areas in central Ire-land. The depth of these glacial deposits is generally lower in the west of the country (less than 3 m) than in the east (up to 10 m) and in many areas, rock outcrops are exposed (Drew, 2008; Jones and Gunn, 1982). The low gradient to-pography and high effective rainfall in these western karst regions mean that river flooding and poor land drainage over large areas are acute problems (Drew and Coxon, 1988). Natural karst systems exhibit extremes in heterogeneity and variability of geologic, morphologic, geologic, hydro-logic, hydraulic, ecological and other parameters in space and time (Denic-Jukic and Jukic, 2002; Bonacci, 2004). A wide range of closed surface depressions, a well-developed underground drainage system (supported by an irregular net-work of pores, fissures and fractures of various size and form), and a strong interaction between the circulation of surface water and ground water are typical features of karst catchments (Bonacci et al., 2006).
The flow in karst regions is composed of three compo-nents; surface flow, subsurface flow and groundwater flow. Karst catchments therefore behave differently with seasonal variations in rainfall. Zhou (2007) describes the types of flooding in karst terrains. In low flow conditions, transmis-sion losses to the underlying limestone from well developed surface and underground karst landforms can be significant (Drew, 1976). In contrast, karst areas at wetter times can be characterised by high water tables and extensive groundwa-ter flooding (discharge-related) for prolonged periods (Drew, 1980). For flash floods, hydrograph volume is important. Due to fast infiltration rates, overland flow and the existence of open water courses on karst terrains are low (Bonacci et al., 2006). A significant proportion of the initial rain-fall is therefore used to fill karst voids. However, the vol-ume of these voids is low and for prolonged and persistent rainfall, groundwater levels can rise rapidly with consequent recharge-related sinkhole flooding on the surface.
A complex issue in karst hydrology, hydrogeology and ge-ology is the delineation of catchment boundaries and the ori-gins of springs and stream flows. A spring in one river catch-ment for example may receive water from a sinking stream in another catchment (Coxon and Drew, 2000). The hydrol-ogy of karst terrain is characterised by strong, direct and dy-namic interactions between groundwater and surface water flows (Bonacci and Zivaljevic, 1992). Because flow is mostly
subsurface, direct hydrometric methods are difficult to use for monitoring and analysis (Bonacci, 2001; Bailly-Comte, 2008). Also, the catchment areas of springs cannot be de-fined in conventional hydro-geological terms. The surface catchments of losing and sinking rivers which contribute to spring flow must also be considered.
The limited research available that describes the influence of karst terrain on flood frequency analysis highlights the variable influences of such landscapes on these distributions. For example, Benzeden et al. (1993), in an investigation of various flood frequency distributions in 21 stations in seven karst river basins in Turkey, concluded that flood peaks fol-low no specified distribution. Although literature supports the assertion that underlying karst can significantly attenuate low to mean flows, its effects on flood flows, particularly in the context of high saturation levels, is less well understood. It is likely however, that the prevalence of karst features in catchments, together with karst influences on base flow con-tributions can affect the distribution of flood peaks in rivers (Benzeden et al., 1993).
2.2 Hydrological and hydraulic influences
Irish river catchments are characterised by an extensive net-work of bogs, lakes and topographical depressions which provide storage to flood flows. More importantly, the mild gradient of many river channels promotes additional at-tenuation in natural floodplains. These influences tend to be greater than in UK catchments and may, in part, ex-plain why many growth curves in Ireland are mildly graded (e.g. NERC, 1975).
The shape, the size, extent and spread of natural flood-plains reflect the dynamics of river systems (Bhowmik, 1984). Once overbank, the complexity of river flows is increased by 3-dimensional momentum exchanges be-tween the main and floodplain channel zones (Sellin, 1964; Zheleznyakov, 1965). This is further increased by the pat-terns of relief which produce spatial and temporal variations in flood inundation for given discharge magnitudes. Lewin and Hughes (1980) noted that patterns of relief alter flow patterns of inundating waters through sequences of filling, transmission and drying-out of floodplains. Lewin and Man-ton (1975) highlight the role of vegetation, artificial struc-tures and development in restricting and compartmentalising overbank flow and storage. As a flood moves down a river it is subject to a series of influences that can alter the time of arrival and peak flow of a flood hydrograph. Vegetation and riparian forests can increase the infiltration and storage capacities of the soils and retard significantly the overland flow. Vegetation therefore, contributes to flood peak attenua-tion, the effect being most pronounced for small to moderate floods in smaller catchments (Subramanya, 1984).
Although a range of geometrical and hydraulic resistance properties of a river channel impact on storage and drainage efficiency (Archer, 1980), floodplains can act as a form of
storage reservoir, providing additional storage for overbank flows. This storage and later release of the stored water can produce flood hydrographs that have lower peaks and longer durations compared to those from similar watersheds with no floodplain storage. The effects are likely to be more pro-nounced for low volume, moderate-frequency events (return periods of 4–50 yr) (Diehl, 1990; Woltemade and Potter, 1994) where floodplain depths are low. At higher return pe-riods, conveyance rather than storage is likely to be the dom-inant influence and flood peaks will tend to be transferred downstream with less attenuation. Given that many bankfull recurrence intervals are in the order of 1–3 yr (see for ex-ample Richards, 1982; Petit and Paquet, 1997; Castro and Jackson, 2001) and that mean and median annual flows have return periods of 2.33 (assuming GEV type I distributions) and 2 yr respectively, flows in natural channels can frequently be subjected to a combination of these complex storage and attenuation effects.
These physical processes and attenuating floodplain char-acteristics can significantly influence flood frequency distri-butions. Haider (1992), using a modular hydrological flood routing model based on non-linear Muskingum-Cunge rout-ing, showed that floodplain inundation alters significantly the characteristics of flood waves. Wolff and Burges (1994) determined that the change in flood frequency distribution downstream of a floodplain is influenced by main channel and floodplain resistances, the width to depth ratio of the floodplain and both the floodplain width and longitudinal slope. Without being specific, Wolff and Burges (1994) con-cluded that a GEV type I upstream flood frequency distri-bution (Cv= 0.6) could change to other GEV distributions
when floodplain inundation occurred. Archer (1989), in a study if the River Tees in the UK, observed that floodplains could attenuate flood peaks by as much as 30 % but that this was variable and dependent on floodplain geometry and hy-drograph characteristics. The effect was more pronounced for sharply peaked, low volume floods. In a previous study, Archer (1980) attributed floodplain storage effects in the River Coquet at Rathbury and the River Skerne at Preston, both in the UK, to low flood growth rates and to GEV type III distributions. Furthermore, extensive floodplain inundation was shown to produce shifts from GEV type II distributions towards GEV type III distributions. A similar tendency for floodplain effects to produce GEV type III distributions, in this case from upstream GEV type I distributions, is also re-ported in the literature (Mason et al., 1988; Mason, 1992; McCartney and Naden, 1995). Although a specific flood fre-quency distribution is valid only at a specified site, it is com-mon to assume that distributions for multiple sites within a geographically homogenous area are the same. Given that floodplain inundation can alter the shape parameter of an up-stream flood frequency distribution, this assumption could produce errors in estimates of flood quantiles at locations downstream of floodplains.
3 Methodology
Annual maxima (AM) data series from 172 Irish gauging stations of 126 rivers with record lengths varying from 7 to 69 yr was obtained for the Irish hydrometric network. Record lengths exceeded 25 yr in 143 stations. Catchment areas var-ied from 10 km2 to 2460 km2 and channel gradients varied from 0.2 m km−1to 25 m km−1. The analyses in this study is based on the assumption that Irish AM data series are in-dependent and identically distributed (assumption of station-arity). In the context of recommended flood estimation pro-cedures, national work for the Irish Flood Studies Update (Cunnane et al., 2008) indicates that potential impacts from anthropogenic influences (urbanisation, reservoirs, drainage systems, water abstraction, changing land use or changing river conditions), climate variability or climate change are not widely observed and traditional methods of hydrologi-cal flood frequency analyses, as used in this research, are justified. Furthermore, the urbanised fraction in the catch-ments analysed was low and for almost all catchcatch-ments, was less than 5 %. Hollis (1975) showed that floods with re-turn periods in excess of 1 yr are not considerably affected by 5 % paving of their catchment and in this regard, as-sumed stationarity with regard to urbanisation is considered reasonable.
Analysis of these AM series was undertaken to identify the GEV distribution that best fits the data at each station and explore the hydraulic and hydro-geological factors that influence flood frequency distributions. This was undertaken in three stages that involved:
1. determining the summary statistics for each AM series; 2. identifying GEV distributions for each AM series; 3. assessing the spatial factors that influence distributions.
3.1 Summary statistics
Descriptive statistical parameters that included standard de-viation (s), skewness (G), Hazen skewness (H-skewness), kurtosis (κ), coefficient of variation (Cv), L−Cv, L
-skewness (L−Cs) andL-kurtosis (L−Cκ) were determined from AM series flow data at each station. For the lim-ited record lengths that were available, the theoretical prod-uct moments andL-moments were equated to corresponding sample product moments andL-moments.
3.2 Identification of GEV distributions
1. probability plots;
2. moment andL-moment diagrams; 3. goodness of fit statistical tests.
3.2.1 Probability plots
Probability plots were used in this paper to visually identify whether GEV type I, type II or type III distributions best fit-ted the AM data series at each of the 172 stations analysed. A probability plot is a graphical technique where the magnitude of a random variable is plotted against its cumulative prob-ability. In this study, both GEV type I and GEV probability plots were prepared for the sites investigated.
Location (uˆ) and scale (αˆ) parameters for GEV type I dis-tributions together with shape (kˆ) parameters for GEV distri-butions and estimated flood quantiles were determined from AM flow records at each gauging station using the method of probability-weighted moments. Flood quantiles for a GEV type I distribution were plotted against the Gumbel reduced variate at these stations. At stations where a linear relation-ship between flood quantiles and the Gumbel reduced vari-ates correlated closely with measured data, it is possible that the sample is from a GEV type I distribution.
A strong deviation from this linear relationship may indi-cate that the sample is not from a GEV type I distribution and comes therefore from an alternative GEV distribution (type II or type III). The inclusion of the additional shape parameter in GEV distributions provides the added flexibility for the distribution to better fit the observed AM data in these cases. A major statistical drawback in the method of probabil-ity plots is that no allowance is made for the fact that not all members of an ordered sample are subject to the same amount of sampling variation. The observations at the upper end of a sample, in particular, have large sampling variance (NERC, 1975). Therefore, uncertainty exists when a distri-bution is identified from probability plots, particularly when limited data is available in the high flow range.
3.2.2 Moment andL-moment diagrams
A widely used technique for identifying appropriate fre-quency distributions to observed data is the method of mo-ments andL-moments. Values of skewness and kurtosis to-gether withL-skewness andL-kurtosis depend on the shape parameter of a particular distribution and are thus related. Moment ratio diagrams of kurtosis against skewness andL -moment diagrams of L-kurtosis against L-skewness were used to identify the parent population from which the AM data for the 172 gauging stations analysed is derived. Sample estimates of skewness, kurtosis,L-skewness andL-kurtosis were derived from the AM data for the 172 gauging stations. The distribution that, by visual inspection, matches closely to the area of scatter of measured data in the moment or
L-moment ratio diagram is expected to be a suitable can-didate distribution to model the measured data. However, in practice, where samples are finite, both product moment and L-moment ratios are associated with sampling uncer-tainty. Therefore exact values of these ratios for GEV type I distributions are rarely obtained. However, issues with bias and sample size related bounds are more significant in prod-uct moment ratios than in L-moment ratios for samples from skewed populations and this reduces the discriminat-ing power of the method for identifydiscriminat-ing appropriate distri-butions among potential candidate distridistri-butions for AM data series (Hosking, 1990; Vogel and Fennessey, 1993; Hosking and Wallis, 1997). Therefore, the method ofL-moments is more robust for extreme values and is now extensively used for distribution identification. Moreover, Van Gelder (1999) illustrated that the computation requirements forL-moment techniques are relatively low and yield better results with non-homogeneous data compared with other traditional tech-niques, such as maximum likelihood and least-squares.
As a result of this bias in finite samples, the sole use of product moment diagrams and to a lesser extent,L-moment diagrams, is unlikely to be sufficient for identifying the dis-tribution from which a sample has come. To assist in this re-gard, a Monte Carlo simulation was undertaken to generate 172 synthetic samples of 50-yr from a GEV type I popula-tion. Comparison of measured data from the 172 sites inves-tigated with these synthetic samples allowed distributions to be identified. If data from the analysed station is shown on moment and L-moment diagrams to fall within the cluster of synthetic GEV type I samples, it is then probable that it comes from a GEV type I population. If plotted data is out-side of this cluster, it is likely to be from an alternative GEV distribution (type II or III).
3.2.3 Goodness of fit statistical tests
Two goodness of fit statistical tests were used in this study. The first of these from Hosking et al. (1985) (referred to as the Hosking method) was considered appropriate given that the algorithm is relatively simple to apply and has good dis-criminating power, particularly for small sample sizes. Other statistical tests from Van Montfort (1970), Otten and Van Montfort (1978) and Laio (2004) were also considered. The tests from Van Montfort and Otten and Van Montfort how-ever, are based on product moment estimates (rather than PWMs as in the Hosking method) and have therefore less statistical power to discriminate for different GEV distribu-tions. A modified Anderson-Darling (A-D) method from Laio (2004) is the second test used to identify whether Irish AM data follows the two parameter GEV type I or three pa-rameter GEV distributions. This is based on maximum like-lihood estimates of the distribution parameters and because of the modifications to the method that increases its discrim-inating power for small sample sizes, was also considered to be suitable.
The Hosking method estimates the shape parameters, kˆ, for the AM series at each site. The shape parameter for a limited sample size recommended to have at least 25 yr of AM data is determined from:
ˆ
k = 7.8590c+2.9554c2 (5)
where
c = 2 ˆ
M110 − Mˆ100
3Mˆ120 − Mˆ100
− ln 2
ln 3 (6)
and whereMˆ100, Mˆ110 andMˆ120 are probability weighted
moments.
The record length of the 172 gauging stations used in this study indicates that 143 (83 %) stations satisfy this require-ment. The 29 stations (17 %) that did not have the required record length were excluded from the analyses.
Whetherkˆis positive or negative is important in fully as-signing a distribution to a given AM series. A positive value indicates either a GEV type I or type III distribution and for a negative value, the distribution will be either type I or type II. However, associated errors in parameter estimation need to be incorporated in this decision making process. The Hosk-ing algorithm provides a further statistical test to investigate the GEV type I null hypothesis with another GEV distribu-tion (type II or type III) as the alternative.
The modified A-D test was undertaken in a number of stages for the 143 Irish AM data sets with record lengths of at least 25 yr. Asymptotically efficient location (uˆ) and scale (αˆ) parameters for GEV type I distributions and lo-cation, scale and shape (kˆ) parameters for GEV distribu-tions were initially determined using the maximum likeli-hood method. Following this, the A-D test statistic from the ordered AM samples was determined. The shape param-eter of GEV distributions influences the empirical distribu-tion funcdistribu-tion (EDF) parameter estimadistribu-tion procedures and to account for this, the transformed GEV distribution was ad-justed with the estimated shape parameter. In practical hy-drology, sample size (n) is typically small and this diminishes the importance of having very accurate asymptotic parameter estimations. Therefore, the transformed distribution was ad-justed for sample size. Finally, the estimated test statistic was compared with a critical value corresponding to a 95 % sig-nificance level to determine whether that particular sample was derived from a GEV type I or GEV population.
3.3 Assessing the spatial factors that influence
distributions
The influence of karst terrain on flood frequency distributions was assessed by incorporating results on an Arc-GIS plat-form showing karst features. The significance of the number and clustering of the flood frequency distributions in areas underlain by karst was explored using Monte Carlo simula-tions. Areas in the west of Ireland where karstic terrain is
characterised by low depths of glacial deposits and exposed rock outcrops are most significant in this regard.
The hydraulic effects of floodplains were identified by us-ing two-sample t-tests to identify statistical correlations be-tween the GEV distributions and catchment properties as-sociated with strong floodplain activity. These include the channel slope, the extent of alluvium deposits adjacent to river channels and areas of grassland pasture (that would typically include floodplain areas) in river basins. Data for these properties is available at all locations in the hydro-metric network following work for the Irish Flood Studies Update (FSU) programme (details of which are in Reed and Martin, 2005).
4 Results
4.1 Summary statistics
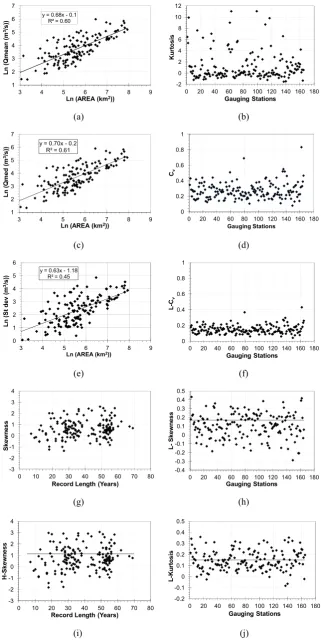
Results of the statistical analysis for the 172 stations analysed are shown in Fig. 1. Figure 1a, c and e indicate that there is a reasonable relationship between catchment area and the mean, median and standard deviation of the annual maxima flow series. The least squares regression equations shown, indicate respectively that the mean, median and standard de-viation of the analysed AM series is proportional toA0.68, A0.69andA0.62,Abeing the catchment area. The scatter in Fig. 1a, c and e indicates that the use of simple regression relationships for discharge estimation can be associated with significant error and highlights the benefits of site specific data for deriving flood estimates.
The coefficient of variation, Cv in Fig. 1d describes the
standard deviation as a proportion of the mean for the an-nual maximum flow record at each site. Estimated values of Cvvary typically from 0.1 to 0.4 for most gauging stations
with a small number being outside of this range. The average value of 0.27 in this analysis is based on data from 172 sta-tions and is marginally lower than the value of 0.3 in the Flood Studies Report (FSR) (NERC, 1975, p. 122) that was determined from significantly shorter records at 63 stations. LowCvvalues at most locations reflect the low permeability
29
y = 0.68x - 0.1 R² = 0.60
1 2 3 4 5 6 7
3 4 5 6 7 8 9
Ln (Q m ea n (m 3/s ))
Ln (AREA (km2))
-2 0 2 4 6 8 10 12
0 20 40 60 80 100 120 140 160 180
K ur to si s Gauging Stations (a) (b)
y = 0.70x - 0.2 R² = 0.61
1 2 3 4 5 6 7
3 4 5 6 7 8 9
Ln (Q m ed (m 3/s ))
Ln (AREA (km2))
0 0.2 0.4 0.6 0.8 1
0 20 40 60 80 100 120 140 160 180
Cv
Gauging Stations
(c) (d)
y = 0.63x - 1.18 R² = 0.45
0 1 2 3 4 5 6
3 4 5 6 7 8 9
Ln (S t d ev (m 3/s ))
Ln (AREA (km2))
0 0.2 0.4 0.6 0.8 1
0 20 40 60 80 100 120 140 160 180
L-Cv Gauging Stations (e) (f) -3 -2 -1 0 1 2 3 4
0 10 20 30 40 50 60 70 80
Sk
ew
ne
ss
Record Length (Years)
-0.4 -0.3 -0.2 -0.1 0 0.1 0.2 0.3 0.4 0.5
0 20 40 60 80 100 120 140 160 180
L-Sk ew ne ss Gauging Stations (g) (h) 30 -3 -2 -1 0 1 2 3 4
0 10 20 30 40 50 60 70 80
H -S ke w ne ss
Record Length (Years)
-0.2 -0.1 0 0.1 0.2 0.3 0.4 0.5
0 20 40 60 80 100 120 140 160 180
[image:7.595.136.458.62.704.2]L-K ur to si s Gauging Stations (i) (j)
Fig. 1. Descriptive statistics of the 172 gauging stations analysed. 1 2 0 150 300 450 600 750
-2 0 2 4 6
AM F lo w (m 3/s )
Gumbel reduced variate 07012
Gumbel GEV 95% Confidence limit
2 5 10 25 50 100
0 10 20 30 40 50 60
-2 0 2 4 6
AM F lo w (m 3/s )
Gumbel reduced variate 25022
Gumbel GEV Confidence limit
2 5 10 25 50 100
(a) (b) 0 75 150 225 300 375 450
-2 0 2 4 6
AM F lo w (m 3/s )
Gumbel reduced variate 20002
Gumbel GEV 95% Confidence limit
2 5 10 25 50 100
0 50 100 150 200 250
-2 0 2 4 6
AM F lo w (m 3/s )
Gumbel reduced variate
24013
Gumbel GEV 95% Confidence limit
2 5 10 25 50 100
(c) (d)
Fig. 2. Probability plots of AM flow (m3/s) against Gumbel reduced variates for (a) Station
3
07012 (b) Station 25022 (c) Station 20002 and (d) Station 24013 in Irish hydrometric 4
network. 5
6 7
Fig. 1. Descriptive statistics of the 172 gauging stations analysed.
0 150 300 450 600 750
-2 0 2 4 6
AM
f
lo
w
(m
3/s
)
Gumbel reduced variate
07012
Gumbel GEV
95% Confidence limit
2 5 10 25 50 100
0 10 20 30 40 50 60
-2 0 2 4 6
AM
f
lo
w
(m
3/s
)
Gumbel reduced variate
25022
Gumbel GEV
95% Confidence limit
2 5 10 25 50 100
(a) (b)
0 75 150 225 300 375 450
-2 0 2 4 6
A
M
fl
o
w
(m
3/s
)
Gumbel reduced variate
20002
Gumbel GEV
95% Confidence limit
2 5 10 25 50 100
0 50 100 150 200 250
-2 0 2 4 6
AM
f
lo
w
(m
3/s
)
Gumbel reduced variate
24013
Gumbel GEV
95% Confidence limit
2 5 10 25 50 100
(c) (d)
Fig. 2. Probability plots of AM flow (m
3s
-1) against Gumbel reduced variates for (a) Station 07012,
(b) Station 25022, (c) Station 20002 and (d) Station 24013 in Irish hydrometric network.
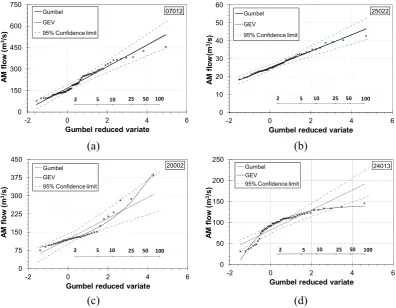
Fig. 2. Probability plots of AM flow (m3s−1) against Gumbel reduced variates for (a) Station 07012, (b) Station 25022, (c) Station 20002 and (d) Station 24013 in Irish hydrometric network.
Irish catchments and again reflects differences in the num-ber of data years in the FSR analyses compared to that pre-sented in this paper. TheH-skewness value provides an in-dication of the distribution that best fits the data at a par-ticular station. A GEV type I distribution is a fixed skew (H-skewness = 1.14) statistical model. Samples from GEV type II and type III distributions therefore exhibit higher and lower skew values respectively. In general, if the parent pop-ulation has a lower or higherH-skewness than an assumed fixed skew model, the upper quantile estimates will be bi-ased upwards or downwards respectively. The kurtosis is a measure of the peakiness of the distribution fitted to the AM series. Figure 1b shows that the estimated kurtosis ranges from−1 to 3. Lower values indicate that the distribution is concentrated about the mean value and is characterised by a short tail; higher values reflect lower, more even distributions that portray longer tails.
Values ofCv, skewness and kurtosis obtained from
indi-vidual hydrological records of the usual length (circa 25 yr) have relatively large standard errors as well as being bi-ased downwards (Cunnane, 1985). Another drawback in using product moment estimators is that they have sample related boundness. Kirby (1974) showed that these bounds depend upon sample size so thatCvis bounded by the
in-terval (0, (n−1)1/2) and sample skewness is bounded by |Gn| ≤(n−2)/(n−1)1/2. To overcome these limitations, Probability Weighted Moment (PWM) andL-moment esti-mates are also used in this paper to describe the summary statistics of observed samples. These moments are not in-fluenced to the same extent by the effects of sampling vari-ability and bias that result from higher order exponents of the product moment equations (Hosking, 1990; Vogel and Fennessey, 1993).
4.2 Identification of GEV distributions
4.2.1 Probability plots
[image:8.595.99.496.63.371.2]Indicative probability plots for four of the 172 gauging sta-tions that were analysed are shown in Fig. 2. Plots relate to Stations 07012 (River Boyne – 69 data years), 25022 (River Camcor – 55 data years), 20002 (River Bandon – 50 data years) and 24013 (River Deel – 49 data years) in the Irish hydrometric network. The 95 % confidence intervals of es-timates from the GEV type I distribution at each station are also shown.
-5 0 5 10 15 20 25
-2 -1 0 1 2 3 4
Ku
rt
o
s
is
Skewness
Observed EV1 Simulated EV1 (Theory) GEV (Theory)
-0.2 -0.1 0 0.1 0.2 0.3 0.4 0.5
-0.6 -0.4 -0.2 0 0.2 0.4 0.6
L
-K
u
rto
s
is
L - Skewness
Observed EV1 Simulate EV1 (Theory) GEV (Theory)
[image:9.595.101.497.64.204.2] [image:9.595.319.536.251.391.2](a) (b)
Fig. 3. Moment (a) and L-moment (b) diagrams for the 172 stations analysed. The 172 simulated GEV type I samples are also shown.
Fig. 3. Moment (a) andL-moment (b) diagrams for the 172 stations analysed. The 172 simulated GEV type I samples are also shown.
distribution. Figure 2c and d however, show that the shape of the probability plot is convex for Station 20002 and con-cave for Station 24013 suggesting that the data follows GEV type II and type III distributions respectively. Visually iden-tifying specific distributions for observed AM series is sub-jective and therefore not statistically robust. Furthermore, observed data at the upper end of a sample is derived from events of low frequency with a resulting large sampling vari-ance (NERC, 1975). Given that no allowvari-ance is made for the fact that members of the ordered sample (AM series) have different sampling variation, an incorrect distribution could be assigned to an observed data series. The method how-ever, provides an initial estimate of the distribution of an AM series at a given location.
4.2.2 Moment andL-moment diagrams
Estimated skewness and kurtosis as well asL-skewness and L-kurtosis for the 172 stations analysed, together with the 172 simulated samples from a GEV type I distribution, are shown in Fig. 3. The theoretical fixed values of skewness and kurtosis (1.1395 and 5.4 respectively) andL-skewness and L-kurtosis (0.1699 and 0.1504) are also shown. The prox-imity of observed data to both the theoretical GEV type I value and the simulated type I clusters in Fig. 3 indicates that data from the majority of stations comes from a GEV type I population. However, as shown (particularly for the moment ratio diagram in Fig. 3a where data is densely clustered), ap-propriate distribution identification is not always clear. Wilt-shire (1986) examined the statistical power of this test by Monte Carlo methods using GEV type I parent distributions and found that the power of the test increased with increasing record length (n) and an increasing number of sites.
4.2.3 Goodness of fit statistical tests
Results from the Hosking algorithm show that of the 143 sta-tions analysed, data for 95 was shown to be best represented by type I distributions and that a further 9 and 39 stations fol-lowed type II and type III distributions respectively. The A-D
Journal: HESS
Title: Influences on flood frequency distributions in Irish river catchments
Author(s): S. Ahilan, J.J. O'Sullivan, and M. Bruen Manuscript No.: Hess-2011-71
Manuscript Type: Research Article
Revisions 2nd
April 2012 – Proposed corrections to most recent typeset manuscript returned to authors on the 27th
March 2012.
(1) On re-reading the typeset manuscript, it became apparent that the clarity of two
figures could be improved. Therefore, revised versions of Figure 4 and Figure 6 are attached below. These are the final changes and the authors would be grateful if these could replace Figure 2 and Figure 6 currently in the manuscript.
0 100 200 300 400 500 600 700 800 900
-40 -30 -20 -10 0 10 20 30 4
X100
EV1 (
m
3/s
)
% Error
0 GEV type I GEV type II GEV type III
Fig. 4. Potential errors in 100-yr flood quantiles estimated at stations for GEV type I distributions when GEV distributions would be more suitable.
1
Fig. 4. Potential errors in 100-yr flood quantiles estimated at sta-tions for GEV type I distribusta-tions when GEV distribusta-tions would be more suitable.
test showed that for the same stations, 83 (58 %), 16 (11 %) and 34 (24 %) stations followed type I, type II and type III distributions respectively, indicating that the flood frequency distributions at 10 stations could not be described by either GEV type I or GEV distributions. Results therefore highlight small differences in the distribution profile from the Hosking and modified A-D methods.
Given that GEV type I distributions are generally assumed for single site flood frequency analysis in Irish catchments, results facilitate an estimation of the errors in predicted flood quantiles should type I distributions be used in areas where GEV distributions are more appropriate. Figure 4 indi-cates that assuming a type I distribution at locations where a type II distribution is more suitable can produce underes-timated 100-yr flood quantiles (X100) of up to 37 %.
Corre-spondingly, the assumption of type I distributions at locations where GEV type III distributions are appropriate can produce overestimated 100-yr flood quantiles by up to 27 %.
4.3 Assessing the spatial factors that influence distributions
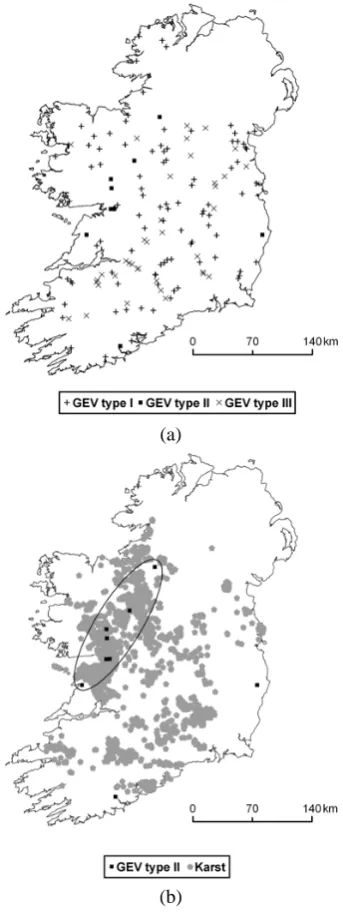
In the context of the study, the small differences in the pre-dicted flood frequency distributions across Ireland from the methods of Hosking and A-D are not significant. The results from both statistical tests support the same hypotheses and reveal that while GEV type I and type III distributions are reasonably well distributed throughout the country, a consid-erably lower level of spatial variability is observed for the type II distributions (Fig. 5a). In total, 7 of the 9 type II distributions predicted by the Hosking test appear as a sin-gle cluster in a region that is underlain with karst terrain (Fig. 5b) and that straddles the Shannon and Western river basins. The modified A-D method also identified these 7 sta-tions as type II stasta-tions. Single type II distribusta-tions still exist along the east and south coasts and in the context of the anal-ysed data, there is no clear underlying reason why this should be. This suggests that an additional influence not investigated in this study is important at these locations. Type III distri-butions are primarily observed in geographical areas of the Shannon, South-Eastern and Eastern river basins away from mountainous or elevated areas.
The significance of the number of GEV type II and type III distributions determined from the Hosking test and their spa-tial distribution was investigated using Monte Carlo sim-ulation. Firstly, the hypothesis, H0: that the underlying distribution is GEV type I (and thus the GEV type II and type III distributions occurred by chance) was tested. A to-tal of 100 000 randomised data sets, each of which contained 143 sets of values (one for each gauging station with a record length in excess of 25 yr) were generated from a GEV type I distribution. To remove the effect of the different measured sample sizes at each of the gauging stations, the number of values generated for each gauging station in each set was equal to the number of measured annual maximum values for that gauging station. The analyses showed that for a two-tailed test with a 95 % confidence limit, 4.3 % and 1.9 % of the tests, could by chance, be expected to be identified by GEV type II and type III distributions respectively. There-fore, the number of type II distributions reported in this study could have occurred by chance under H0 but it is very un-likely that the number of type III results would have occurred by chance.
Following this, a separate Monte Carlo investigation stud-ied the distinct clustered spatial distribution of the type II stations to determine how likely it was to get a result with 7 stations clustered together if their locations were random. The hypothesis is H0: that the spatial location of type II sta-tions is random and again, 100 000 tests were undertaken. In each test, 7 gauges were randomly placed at locations in a 2-dimensional lattice with 140 nodes, corresponding closely to the number of gauging stations investigated. The percent-age of simulations in which the random placement produced a cluster of all 7 stations in any configuration or location was
(a)
[image:10.595.342.514.63.520.2](b)
Fig. 5.
Spatial variation of GEV distribution in Irish river catchments (a) and cluster of GEV
type II distributions in area underlain by karst terrain in West of Ireland (b).
3
Fig. 5. Spatial variation of GEV distributions in Irish river catch-ments (a) and cluster of GEV type II distributions in area underlain by karst terrain in West of Ireland (b).
calculated as less than 0.1 %. H0 is rejected at the 95 % con-fidence level and the spatial clustering of 7 stations is ex-tremely unlikely to have occurred by chance. So although the number of type II stations could occur by chance, their spatial pattern is significant. In contrast, the number of type III dis-tributions is, by itself, significant, regardless of their spatial distribution. In both tests, the results do not change apprecia-bly if the number of simulations is increased and therefore, 100 000 simulations produced stable results.
expected to result from the presence of lakes (described by Acreman and Sinclair (1986) for flood frequency distribu-tions in Scotland) and to a lesser extent, bogs and the as-sociated topographical depressions that can provide storage to flood flows. However, through GIS analyses and two-sample t-tests, GEV type III distributions were shown not to be related to the catchment property that describes flood attenuation from lakes and reservoirs (FARL). Furthermore, the type III stations were not in areas of the country where bog storage is significant (blanket bogs are most common in the west of Ireland where rainfall is greatest and raised bogs feature in the Shannon River basin). Therefore, it is proba-ble that influences reflected in these distributions result from attenuation from natural floodplains, an effect promoted by the mild gradients in Irish river channels.
Two-sample t-tests showed that with reference to GEV type I distributions, type III stations were statistically cor-related to a number of properties that are indicative of flood-plain activity. These properties included the channel slope (defined by S1085, the slope determined between the 10 and 85 percentiles of the mainstream length), the proportion of the floodplain alluvial extent (described by ALLUV, based on the distribution of a single Parent Material class “Allu-vium” by reference to a national dataset of soil Parent Materi-als) and the proportion of grassland pasture in the catchment that for Irish catchments, typically includes floodplain areas (represented by PASTURE and determined from reference to the Environmental Protection Agency Corine landcover dataset). Confidence intervals of 85 %, 90 % and 95 % were determined for S1085, ALLUV and PASTURE respectively. To further support the hypothesis that floodplain attenuation effects promote GEV type III distributions, the proportion of peat cover (PEAT, also determined from the Corine land-cover dataset) in the relationship between type I and type III distributions was explored. Peat is naturally hydrophobic and peat areas are characterised by shallow water tables (Kati-mon and Wahab, 2003). For Irish climatic conditions, peat tends to be highly saturated, limiting the storage capacity for rainfall and producing catchment conditions not conducive to type III distributions. This influence was supported by a two-sample t-test that showed PEAT to be significant in the occur-rence of GEV type I distributions over type III distributions at a 95 % confidence interval.
Comparison of mean and standard deviation of these four catchment properties are shown in Fig. 6 for the type I and type III distributions. The lower average gradients of type III catchments is reflected in mean and standard deviation for S1085 of 2.69 and 1.97 respectively compared to val-ues of 3.77 and 4.41 for type I catchments. Larger ALLUV (mean and standard deviation of 4.25 and 1.91 respectively for type III stations and 3.6 and 1.92 for type I stations) and PASTURE (mean and standard deviation of 81.02 and 17.52 for type III stations and 71.77 and 22.32 for type I sta-tions) are also observed in type III catchments. Furthermore, higher mean and standard deviation for PEAT (13.72 and
0 0.05 0.1 0.15 0.2 0.25
0 7 14 21 28
Fr
equency
S1085 (m/km)
GEV type I GEV type III
(a)
0 0.05 0.1 0.15 0.2 0.25
0 3 6 9
Fr
equency
% Alluvium
12
GEV type I GEV type III
(b)
0 0.005 0.01 0.015 0.02 0.025 0.03
0 30 60 90
Fr
equency
% Pasture
120
GEV type I GEV type III
(c)
0 0.005 0.01 0.015 0.02 0.025 0.03 0.035
0 25 50 75
Fr
equency
% Peat
100
GEV type I GEV type III
(d)
Fig. 6.
Variations of catchment properties indicative of floodplain activity for differentiating
between GEV type I and type III distributions in Irish river catchments.
2
Fig. 6. Variations of catchment properties indicative of floodplain activity for differentiating between GEV type I and type III distri-butions in Irish river catchments.
15.89 respectively) in type I catchments compared to val-ues in type III catchments (7.87 and 12.28 respectively) re-flect the hydrophobic nature of this material, particularly in Irish catchments where it is characterised by high saturation levels.
5 Discussion of results
Results indicate that a significant cluster of GEV type II dis-tributions is located in the West of Ireland in areas underlain with karst terrain. The prevailing meteorological conditions in this region are characterised by periods of intensive and prolonged rainfall. Such conditions are conducive to high overland flow rates (rather than just the recharge of subsur-face and groundwater flows that would occur for less sig-nificant rainfall) that can exceed karst percolation rates with the consequence that overland flow dominates. This can be compounded by the filling of karst voids by rising ground-water with the consequence that subsurface storage can be removed. Furthermore, the karst in this region, as opposed to elsewhere in the country, is characterised by thin glacial overburdens with regular exposures of bare rock outcrops. These features promote the formation of karst springs where water can be withdrawn from the surface flow only to re-emerge through groundwater conduits and contribute to sur-face streams at later stages of a flood episode (White, 2002). These springs however, have limits that are independent of catchment conditions, rainfall depths and intensities and rises in groundwater levels (Bonacci, 2001). The influence of karst features on small, medium and large floods is there-fore very different. A reasonable AM flow record is likely to contain a range of low to high flows. Therefore, it is likely that low to moderate floods may be represented by a given GEV distribution but the more extreme events represented in typical AM data series, given the increased overland flow to-gether with groundwater and subsurface contributions, may more suitably be described by a flood frequency distribution that curves upwards. Such distributions are typical of GEV type II distributions and karst influences may therefore ex-plain the spine of Type II distributions observed in the north-south direction in Fig. 5b.
The variable and complex hydrological mechanisms that characterise karst terrains are significant influences in these regions. The results presented support the assertions of Ben-zeden et al. (1993) and Bonacci (2001) that the complex-ities of karst hydrology are such that the fitting of flood frequency distributions to maximum or extreme annual dis-charges and relating these to flood recurrence intervals is more challenging.
GEV type III distributions are shown to be correlated to catchment properties that are indicative of floodplain inun-dation. Channel slope (S1085) and the extent of alluvium deposits (ALLUV) are significant in this regard. Reduced at-tenuation of flood peaks is expected in steeply graded
catch-ments where high conveyance capacities are generally asso-ciated with a reduction in storage volume in the river reach. Increased attenuations, consistent with the results presented and associated with type III stations, are therefore likely in low gradient catchments. In this study, the lateral extent of an active floodplain in river flows is reflected in the area over which alluvium material deposits on floodplains. For a dis-charge in a given river, the width of the active floodplain determines whether floodwater flows slowly as a thin layer spread over a wide valley or whether it will rise within the confines of a narrow valley to depths at which even over-bank water is rapidly flowing. The floodwater gets more at-tenuated in wider floodplains than in narrow valleys. Given the relationship between type III distributions and increasing storage, the statistical significance of ALLUV in the context of whether a station is type I or type III is important. The finding that floodplain attenuation can promote GEV type III distributions in river catchments is supported by other re-search (Mason et al., 1988; Mason, 1992; Archer, 1989; Wolff and Burges, 1994; McCartney and Naden, 1995).
6 Conclusions
Quoting Gumbel (1891–1966), where he stated that “It seems
that the rivers know the theory. It only remains to con-vince the engineers of the validity of this analysis” is
partic-ularly apt for the analysis presented. This analysis involved identifying the GEV flood frequency distributions for annual maximum (AM) data sets in Irish catchments. The statisti-cal tests of Hosking et al. (1985) and a modified Anderson-Darling (A-D) method (Laio, 2004) were used and results were also supported by probability plots and moment and L-moment diagrams. Although data from 172 gauging sta-tions in 126 rivers was analysed in the study, the goodness of fit statistical tests were applied only to the 143 stations where AM flow records exceeded 25 yr. Results of the Hosk-ing method indicated that of these 143 stations, data for 95 (67 %) was best represented by GEV type I distributions and data for another 9 (6 %) and 39 (27 %) stations followed type II and type III distributions respectively. Type I, type II and type III distributions were determined for 83 (58 %), 16 (11 %) and 34 (24 %) stations using the modified A-D method (AM data from 10 stations followed neither type I or GEV distributions).
a significant proportion of flow can penetrate into the karst underground and fill voids and fissures, with the effect that overland flow is quite low. For larger volume floods, the relative capacity of the voids and fissures is not sufficient. Groundwater levels can therefore rise rapidly, pressurising karst conduits and producing groundwater springs that break through on the surface in unexpected locations, producing more significant overland flows. Overland flows can be fur-ther increased in situations where the rainfall intensity ex-ceeds karst percolation rates. Therefore, although intuitively, the additional subsurface storage provided in karst terrain may be expected to provide conditions consistent with GEV type III distributions, the type II distributions in this area reflect the finite nature of this storage and the effects, in ex-treme conditions, when the karst is saturated and further stor-age is no longer available.
The majority of GEV type III distributions appear in ge-ographical areas of the Shannon, South-Eastern and East-ern river basins where attenuation influences attributable to floodplains appear to be influential. For moderate floods with relatively high peak to volume ratios, floodplain attenuation effects can be more significant. The indicators of floodplain activity that potentially attenuate a flood wave as it passes along a valley were represented in the study by catchment properties that included channel slope, the extent of allu-vium deposits in the river basin together with peat and pas-ture coverage in the catchment. Two-sample t-tests showed these catchment properties to be significant in distinguishing between type I and type III distributions. The presence of GEV type III stations in areas where floodplain activity is likely, suggests that when gauging stations are separated by wide shallow floodplains without significant intervening trib-utary inflows, there is an increased tendency for flatter GEV type III flood frequency distributions at downstream gauging stations. Results also indicate that in some instances, assum-ing that Irish annual maximum data follows GEV type I dis-tributions (as recommended for Irish AM data) is incorrect and may result in erroneous estimates of flood quantiles at these stations. Where actual data follows a type II distribu-tion, flood quantiles may be underestimated by in excess of 35 % and for type III distributions, overestimates by in excess of 25 % can occur.
Acknowledgements. The authors wish to acknowledge the financial support provided by the Irish Office of Public Works (OPW) and the Centre for Water Resources Research (CWRR) in the School of Civil, Structural and Environmental Engineering in UCD for under-taking this research. The OPW funding was provided through the Irish Flood Studies Update (FSU) programme.
Edited by: F. Laio
References
Acreman, M. C. and Sinclair, C. D.: Classification of drainage basin according to their physical characteristics; an application
for flood frequency analysis in Scotland, J. Hydrol., 84, 365–380, 1986.
Ahmad, M. I., Sinclair, C. D., and Spurr, B. D.: Assessment of Flood Frequency Models Using Empirical Distribution Function Statistics, Water Resour. Res., 24, 1323–1328, 1988.
Archer, D.: Flood wave attenuation due to channel and flood-plain storage and effects on flood frequency, in: Floods: Hydro-logical, Sedimentological and Geomorphological Implications, edited by: Beven, K. and Carling, P. A., John Wiley and Sons, Chichester, 37–46, 1989.
Archer, D. R.: A catchment approach to flood estimation, Proc. Instn Wat. Engrs Scient., 35, 275–289, 1980.
Bailly-Comte, V., Jourde, H., Roesch, A., Pistre, S., and Batiot-Guilhe, C.: Time series analyses for Karst/River interactions assessment: Case of the Coulazou River (Southern France), J. Hydrol., 349, 98–114, 2008.
Benson, M. A.: Uniform flood frequency estimation methods for federal agencies, Water Resour. Res., 4, 891–908, 1968. Benzeden, E., Olcay, M.S. and Bagali, K.: Flood frequency analysis
in karst river basins, Hydrological Processes in Karst Terranes, Proceedings of the Antalya Symposium and Field Seminar, Oc-tober 1990, IAHS Publ., 207, 187–202, 1993.
Bhowmik, N. G.: Hydraulic geometry of floodplains, in: Global Water: Science and Engineering – The Ven Te Chow Memorial Volume, edited by: Stout, G. E. and Davis, G. H., J. Hydrol., 68, 369–401, 1984.
Bobee, B., Cavadias, G., Ashkar, F., Bernier, J., and Rasmussen, P.: Towards a systematic approach to comparing distributions used in flood frequency analysis, J. Hydrol., 142, 121–136, 1992. Bonacci, O.: Analysis of the maximum discharge of karst springs,
Hydrogeol. J., 9, 328–338, 2001.
Bonacci, O. and Zivaljevic, R.: Hydrological explanation of the flow in karst: example of the Crnojevica Spring, J. Hydrol., 146, 405–419, 1992.
Bonacci, O.: Hazards caused by natural and anthropogenic changes of catchment area in karst, Nat. Hazards Earth Syst. Sci., 4, 655-661, doi:10.5194/nhess-4-655-2004, 2004.
Bonacci, O., Ljubenkov, I., and Roje-Bonacci, T.: Karst flash floods: an example from the Dinaric karst (Croatia), Nat. Haz-ards Earth Syst. Sci., 6, 195–203, doi:10.5194/nhess-6-195-2006, 2006.
Castro, J. M. and Jackson, P. L.: Bankfull discharge recurrence in-tervals and regional hydraulic geometry relationships patterns in the Pacific Northwest, USA, J. Am. Water Resour. Assoc., 37, 1249–1262, 2001.
Coxon, C. E.: The spatial distribution of turloughs, Irish Geogr., 20, 11–23, 1987.
Coxon, C. E. and Drew, D.: Interdependence of groundwater and surface water in lowland karst areas of western Ireland: manage-ment issues arising from water and contaminant transfers, Geo-logical Society, London, Special publications, 182, 81–88, 2000. Cunnane, C.: Factors affecting choice of distribution for flood
se-ries, Hydrolog. Sci. J., 30, 25–36, 1985.
Cunnane, C.: Statistical distributions for flood frequency analysis, World Meteorological Organization, Operational hydrology Re-port No. 33, 73 pp., 1989.
Cunnane, C., Das, S., and Mandal, U.: Final report of Work-Package 2.2 “Frequency analysis” of the Irish Flood Studies Up-date Programme, A report submitted to Irish Office of Public
Works, 2008.
Denic-Jukic, V. and Jukic, D.: Composite transfer functions for karst aquifers, J. Hydrol., 274, 80–94, 2002.
Diehl, T. H.: Hydrological and statistical characteristics of extreme floods, Ph.D. dissertation, Univ. of Wisc., Madison, 1990. Drew, D. P.: Hydrogeology of the North Co. Galway – South
Co. Mayo lowland karst area, Western Ireland, Proc. 6 Int. Spel. Cong., Olomouc, 1973, 4, 57–61, 1976.
Drew, D. P.: The effects of human activity on a lowland karst aquifer, in: Problems in karst hydrology, edited by: Burger, A., Int. Assoc. Hydrogelogists, 2, 1980.
Drew, D. P.: The Hydrology of the Burren, County Clare, Irish Ge-ogr., 23, 69–89, 1990.
Drew, D. P.: Hydrogeology of lowland karst in Ireland, Q. J. Eng. Geol. Hydrogeol., 41, 61–72, 2008.
Drew, D. P. and Coxon, C. E.: Karst hydrogeology and karst environment protection, IAH 21st Congress, 10–15 October, Guilin. China, 204–209, 1988.
El Adlouni, S., Bobee, B., and Ouarda, T. B. M. J.: On the tails of extreme event distributions in hydrology, J. Hydrol., 355, 16–33, 2008.
Haider, S.: Effects of floodplain inundation on flood frequency, Trans. Am. Geophys. Union, 73, 242–243, 1992.
Hollis, G. E.: The effect of urbanization on floods of different re-currence interval, Water Resour. Res., 11, 431–435, 1975. Hosking, J. R. M.: L-moments: analysis and estimation of
distri-butions using linear combinations of order statistics, J. R. Stat. Soc. B, 52, 105–124, 1990.
Hosking, J. R. M. and Wallis, J. R.: Regional frequency analysis: an approach based on L-moments, Cambridge, UK, Cambridge University Press, 1997.
Hosking, J. R. M., Wallis, J. R., and Wood, E. F.: Estimation of the generalized extreme value distribution by the method of Probability-Weighted Moments, Technometrics, 27, 251–260, 1985.
Jenkinson, A. F.: Statistics of extremes in estimation of Maximum Floods, WMO Tech. Note 98, 183–228, 1969.
Jones, G. L. and Gunn, J.: Flood Alleviation in the Lowland Karst Area of Mullinahone, County Tipperary, Ireland, J. Earth Sci. R. Dubl. Soc., 5, 37–42, 1982.
Katimon, A. and Wahab, A. K. A.: Hydrological analysis of drained peat basin using time series correlation and cross correlation functions, Jurnal Teknologi., 39, 63–74, 2003.
Kirby, W.: Algebraic boundedness of sample statistics, Water Re-sour. Res., 10, 220–222, 1974.
Laio, F.: Cramer-von Mises and Anderson-Darling goodness of fit tests for extreme value distributions with unknown parameters, Water Resour. Res., 40, 1–10, 2004.
Lewin, J. and Hughes, D.: Welsh floodplain studies, II, Application of a qualitative inundation model, J. Hydrol., 46, 35–49, 1980. Lewin, J. and Manton, M. M. M.: Welsh floodplain studies: the
nature of floodplain geometry, J. Hydrol., 25, 37–50, 1975. Mason, D. W.: Modelling the effect of Floodplain storage on the
flood frequency curve, Ph.D. thesis, University of Newcastle Upon Tyne, 1992.
Mason, D. W., O’ Connell, P. E., and Mawdsley, J. A.: The ef-fect of floodplain storage on the flood frequency curve, Paper presented at International Association of Hydraulics Research, Int. Symp. on Stochastic Hydraulics, Birmingham, 1988.
McCartney, M. P. and Naden, P. S.: A Semi-Empirical investigation of the influence of flood-Plain Storage on Flood Flow, J. Inst. Water Environ. Manage., 9, 236–246, 1995.
McKerchar, A. I. and Pearson, C. P.: Maps of flood statistics for re-gional flood frequency analysis in New Zealand, Hydrolog. Sci., 35, 609–621, 1990.
McMahon, T. A. and Srikanthan, R.: Log Pearson III distribu-tion – is it applicable to flood frequency analysis of Australian streams?, J. Hydrol., 52, 139–147, 1981.
NERC – Natural Environment Research Council: Flood Studies Re-port, Vol. I, Hydrological Studies, London, 1975.
Otten, A. and Van Montfort, M. A. J.: The power of two tests on the type of distribution of extremes, J. Hydrol., 37, 195–199, 1978. Petit, F. and Pauquet, A.: Bankfull discharge recurrence interval in
gravel-bed rivers, Earth Surf. Proc. Land., 22, 685–693, 1997. Phien, H. N.: A review of methods of parameter estimation for the
extreme value type-I distribution, J. Hydrol., 90, 251–268, 1987. Reed, D. and Martin, J.: Flood Studies Update: A new look at flood estimation for Ireland, Proc. of UNESCO International Hydro-logical Programme, OPW (Ireland), National Hydrology Semi-nar, 26–33, 2005.
Richards, K.: Rivers, Form and Process in Alluvial Channels, Methuen, 358 pp., 1982.
Sellin, R. H. J.: A laboratory investigation into the interaction be-tween the flow in the channel of a river and that over its flood-plain, La Houille Blanche, November, vol. 19, 793–801, 1964. Subramanya, K.: Engineering Hydrology, McGraw-Hill
Publish-ing, New Delhi, 1984.
Van Gelder, P. H. A. J. M.: Performance of parameter estimation techniques with inhomogeneous datasets of extreme water lev-els along the Dutch coast, Proceedings of the XXVIII IAHR congress, Graz, Austria, CD-ROM, Abstract 174, 1–9, 1999. Van Montfort, M. A. J.: On testing that the distribution of extremes
is of type I when type II is the alternative, J. Hydrol., 11, 421– 427, 1970.
Vogel, R. M. and Fennessey, N. M.: L moment diagrams should re-place product moment diagrams, Water Resour. Res., 29, 1745– 1752, 1993.
White, W. B.: Karst hydrology: recent developments and open questions, Eng. Geol., 65, 85–105, 2002.
Williams, P. W.: Limestone morphology in Ireland, in: Irish Ge-ographical Studies, edited by: Glasscock, R. and Stephens, N., Queen’s University, Belfast, 105–124, 1970.
Wiltshire, S. W.: Regional flood frequency analysis I: Homogeneity statistics, Hydrolog. Sci. J., 31, 321–333, 1986.
Wolff, C. G. and Burges, S. J.: An analysis of the influence of river channel properties on flood frequency, J. Hydrol., 153, 317–337, 1994.
Woltemade, C. J. and Potter, K. W.: A watershed modelling analysis of fluvial geomorphologic influences on flood peak attenuation, Water Resour. Res., 30, 1933–1942, 1994.
Zheleznyakov, G. V.: Relative deficit of mean velocity of instable river flow, kinematic effect in river beds with flood plains, Pro-ceedings of the 11th International congress of the Association for hydraulic research, Leningrad, USSR, 1965.