ORIGINAL RESEARCH ARTICLE
ENERGY BENCHMARKING IN A PORTFOLIO OF EDUCATIONAL BUILDINGS IN BRAZIL USING
SUPPORT VECTOR MACHINE AND DATA ENVELOPMENT ANALYSIS
*Haroldo Luiz N. da Silva, Paulo Henrique de Mello Sant Ana and Sérgio Ricardo Lourenço
Postgraduate Energy Program – Federal University of ABC, Al. da Universidade, s/nº – ZIP Code 09606-045, São Bernardo do Campo – São Paulo – Brazil
ARTICLE INFO ABSTRACT
Buildings are one of the largest energy consumers in developed countries as well as in Brazil, and no other segment has such a potential for improving energy efficiency. Several policies have been applied for this purpose around the world and energy benchmarking is one of the most used worldwide. Thus, this paper brings a new benchmarking approach that involves not only energy consumption, but it also evaluates managerial issues in energy. For this, Support Vector Machine was used in order to predict the energy consumption using data of vocational schools in the São Paulo state, Brazil, to validate the methodology and Data Envelopment Analysis was used for the elaboration of the efficiency scale. It were considered 92 school buildings for the development of the predictive model and 72 for elaborating the efficiency scale in DEA. The results indicated a great potential for saving energy and financial resources when compared to the best practices.
Copyright © 2019,Haroldo Luiz N. da Silva et al. This is an open access article distributed under the Creative Commons Attribution License, which permits unrestricted use, distribution, and reproduction in any medium, provided the original work is properly cited.
INTRODUCTION
Buildings represent one of the largest sectors in terms of energy consumption. In general, in developed countries the share of energy consumption of the building sector is between 20% and 40% of the final energy consumption
(Pérez-Lombard et al., 2008). In Brazil, buildings are also among the
largest energy consumers and the sector accounted for 51% of the total electricity consumption in 2016 (EPE, 2017). Energy efficiency in existing buildings represents one of the most important research areas in the energy field (WANG and XIA, 2015), and no other area has such a great potential for
improvements (ÜRGE-VORSATZ et al., 2009). However,
only an evaluation of the projects can be insufficient due to the difference between the expected consumption in the project and in the occupation phase, a phenomenon known as performance gap, described by Olivia and Christopher (2015) and Brady and Abdellatif (2017). Several policies are used to establish efficient buildings, such as benchmarking, which is defined by Spendolini (1992) as a process of comparing products and services against the best practices, and are
*Corresponding author: Haroldo Luiz N. da Silva,
Postgraduate Energy Program – Federal University of ABC, Al. da Universidade, s/nº – ZIP Code 09606-045, São Bernardo do Campo – São Paulo – Brazil
discussed by Pérez-Lombard et al. (2009), Chung (2011) and
Borgstein et al. (2016). Much effort has been made in order to
understand the complexity of energy consumption in buildings and also to search for mechanisms to predict energy
consumption (Wei et al., 2018). Machine learning (ML)
algorithms have been widely used for this purpose
(GALLAGHER et al., 2018), they use data from the past
aiming to "learn" a pattern of energy consumption and then predict future values of it (AMASYALI and EL-GOHARY, 2018). Comparative analysis between ML algorithms for energy consumption prediction in buildings were performed by
Molina-Solana et al., (2017), Robinson et al. (2017), Wang
and Srinivasan (2017) and also Wei et al. (2018). The Support
Vector Machine (SVM) algorithm, proposed by Cortes and Vapnik (1995), has risen great interest given its great
performance in the most diverse fields (ČEPERIC et al.,
2017), and has been used to predict energy consumption in
buildings by Jung et al. (2015), Paudel et al. (2017) and Zhang
et al. (2016). Another important approach, Data Envelopment
Analysis (DEA) proposed by Charnes et al. (1978), based on
Farrell (1957), refers to an efficiency oriented approach in a set of entities called Decision Making Units (DMU), which
relates inputs to output products (COOPER et al., 2011).
Although it can be seen as a production frontier evaluation tool, it can be considered that its goal is to evaluate the
ISSN: 2230-9926
International Journal of Development Research
Vol. 09, Issue, 03, pp.26692-26696, March, 2019
Article History:
Received 17th December, 2018
Received in revised form 14th January, 2019
Accepted 26th February, 2019 Published online 31st March, 2019
Available online at http://www.journalijdr.com
Key Words:
Buildings; Energy efficiency; Energy management; Data Envelopment Analysis, Machine Learning; Benchmarking.
Citation: Haroldo Luiz N. da Silva, Paulo Henrique de Mello Sant Ana and Sérgio Ricardo Lourenço. 2019. “Energy benchmarking in a portfolio of
educational buildings in Brazil using support vector machine and data envelopment analysis”, International Journal of Development Research, 09, (03), 26692-26696.
organizational performance against the best practices (COOK
et al., 2014). DEA is a tool based on optimization in mathematical programming that, according to Chung (2011), has as its main advantage the non-parametric treatment, which does not assume any particular functional form. Although there are variants, the two classic models are the Constant Return to Scale (CRS) model and the Feature Return to Scale
(VRS) model proposed by Banker et al. (1984),which
substitutes the axiom of proportionality between inputs and outputs from the axiom of convexity, in both cases two approaches concerning to orientation are possible, the so-called input orientation, that seeks to minimize input values for the same production of output, and the output orientation, where the inverse analysis is observed. A problem of this methodology is its benevolent character that results in a large number of efficient DMUs, which makes the analysis more difficult, especially when it is intended to order the DMUs by efficiency. That can be overcome by some methods discussed
by Angulo-meza etal. (2002). One used methods is known as
super-efficiency (SE-DEA), proposed by Andersen and Petersen (1993), and its basic idea is that the evaluated DMU is excluded from the reference set, allowing even higher values than the maximum value without changing the ordering of the others. In this sense, this paper brings a new methodology for the evaluation of energy performance and benchmarking in a portfolio of buildings, taking as case of study buildings that dwells vocational schools in the São Paulo, Brazil, using SVM to predict energy consumption, and DEA for the efficiency analysis and benchmarking by characteristic features.
MATERIALS AND METHODS
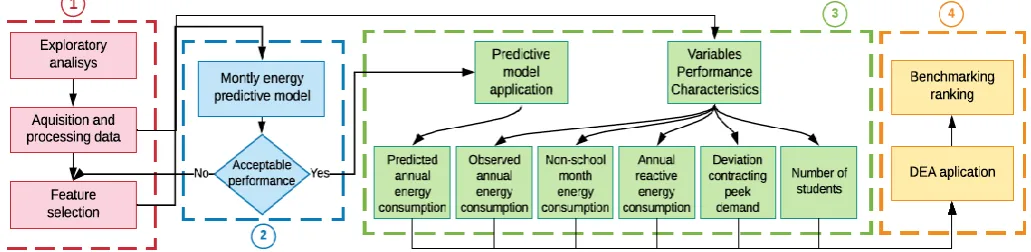
In general, the methodology was based on four pillars: preparation stage, development of the predictive model, the construction of the features to characterize the performance in the management and energy consumption, and finally the benchmarking and the construction of the efficiency scale. An overview of the methodology is shown in Figure 1.
Preparation: An exploratory analysis on the typology of the buildings of the portfolio is done aiming the understanding of the energy flows, profiles of use and occupancy, and the hypothesis formulation about the features that can affect the performance. Features related to the constructive attributes, infrastructure, use profile, energy and climatic characteristics were collected for testing and construction of the predictive model. The initial data treatment consisted of removing the missing and the outliers. The interquartile range, also applied
by Liu et al. (2017), was used in order to identify outliers.
Since an excessive number of predictor features may worsen
the performance of the model, due to overfitting (Liu et al.,
2017), the Pearson Correlation coefficient (r) was used as a
selection criterion, as done by Capozzoli et al. (2015) and
Deng et al. (2018), and then the features whose r value were
larger than 0.20were included in the model. The correlation
between the input features, a problem known as
multicollinearity, should also be avoided in order to keep the quality of the model. The creation of auxiliary features and combination of features can also act positively. Then, climatic, and usage and occupancy features were created for statistical tests.
Development of the predictive model: The predictive model was built using the SVM to predict the monthly energy consumption for each building given their characteristics. Some metrics are usually used to evaluate predictive models and are discussed by Amasyali and El-Gohary (2018). For the evaluation of the proposed model, the Coefficient of
Determination (R2), the Root Mean Square Error (RMSE) and
the Coefficient of Variation of RMSE (CV-RMSE) were used.
Features of energy performance: Features were developed in order to characterize the performance in the management and energy consumption of the buildings, which were used in the DEA benchmarking. They are described below as follows:
Annual actual energy (AAE_obs): the sum of the actual
monthly energy consumption for a period of twelve months.
Annual predicted energy (AAEpred): the sum of the monthly
active energy consumption predicted by the predictive model for each vocational school building, developed over a period of twelve months.
Annual reactive surplus energy (RAE): the sum of the
monthly energy consumption of reactive surplus that exceed the Power Factor limit of 0.92, based on energy bills for a period of twelve months.
Peek demand deviation (PDD): the difference between the
[image:2.595.48.564.510.636.2]ideal value calculated (PDS) for a period of twelve months and the contracted peek demand (PDC). In the Brazilian eletricity tariff model, customers of group A must contract the maximum demand power and the whole amount is charged, being either used or not, incurring in a fine if the tolerance of 5% is exceeded. This fine is equivalent to twice the unit value of the contracted demand. The determination of the ideal demand assesses whether the measured demand is less or greater the contracted demand and complements the value to the corresponding feature, if the measured demand is greater
Figure 1. Block diagram of the proposed methodology
than the contracted demand the difference is considered twice. Thus, the value of PDD is defined as Equation 1.
If PDC ≥PDS: PDD=PDC−PDS (1)
If PDC < : PDD=2 × (PDS−PDC)
Average active energy during non-school months (AEN
nsm): the average energy consumption during the non-school
months (January, July and December).
Total number of students (TNS):total number of students of
each vocational school building.
Energy benchmarking using DEA: The energy benchmarking was based on DEA, taking each vocational school building as a DMU and using the constructed features in order to characterize the energy performance. The model for analysis of efficiency should consider the inputs and outputs in order to obtain the efficiency of each DMU to elaborate the efficiency scale. Thus, input features should tend to minimum values while output features should tend to maximum values. The model was constructed using SE-DEA approach, CCR input orientation, as shown below:
Inputs: PDD, AAE_obs, RAE, AEN_nsm
Outputs: AEE_pred, TNS.
RESULTS AND DISCUSSION
The dataset consists of 223 public vocational schools whose courses were divided into 12 technological axes plus high school (CPS, 2018). Two typologies of use were identified and agricultural schools were excluded from the dataset and only conventional vocational schools were selected given the significant difference in the profile of use.
Initial features of the model: The features used in the predictive model were chosen in order to test the hypothesis of their statistical significance in the energy consumption of each teaching unit. Furthermore, four new features related to the climate and three features related to the effective were created. Cooling degrees-day (CDD), as discussed in Meng and
Mourshed (2017) and Golden et al. (2017), was used to assess
the impact of climatic conditions on energy consumption and they were calculated using climatic data from a typical reference year (USFC, 2016) of the closest city to each school. Thus, two balance point temperatures (Bt) were tested in the CDD construction: dry bulb temperature of 20 °C (CDD_DB20), and wet bulb temperature of 17 °C (CDD_WB17). Since the CDD feature impacts more significantly buildings with large air-conditioned áreas, a weighting was made taking into account the proportion of the area under CDD. Considering CBA as the air-conditioned area and BUA is the constructed area for each school, the feature ACBt = (CBA / BUA) × CDD_Bt was created, with Bt being the balance point temperature for the two tested cases. The total number of students (TNS) stands for to the sum of students in different periods, and the adjusted number of students (NSA) also refers to the same sum, but it considers a double weight to the number of full time students and it was created in order to test the hypothesis of the larger weight of them. The feature SCC = ESD + MAB + CPD + SEC + HSC
means the sum of the number of students in technological axes with similarity to the infrastructure, and it was created as a form of dimensionality reduction. Data of energy consumption referring to the period from January to December of 2017 were collected in energy bills and data of use and population of the buildings were collected from the staff of the schools. Thus, after the removal of agricultural schools and outliers, the final dataset for the predictive model has a total of 91 vocational schools. As the model was constructed aiming to predict monthly energy consumption, it has the total of 1,092 observations for training and testing. The raw data and description of each feature is in a public repository available in (SILVA, 2018).
Features selection of predictive model: The Pearson correlation coefficient (r) test for each feature in relation to consumption (ENE) was performed, and the features with r values less than 0.20 were excluded from the model. In addition, an analysis of the correlation between continuous predictor features was also done in order to exclude the ones
with multicollinearity problems. The selection was finalized
with the choice of the feature MTH (categorical feature equivalent to the reference month) as a way of capturing the seasonality in energy consumption. The climatic features did not present significant correlation and were excluded from the model.
The final model represented by (predictor features), and
(objective features) was:
: TNS, BUA, CIP, EIXAGR, IPD, IFS, EHA, IAC, SCD, MTH; and
: ENE
Development and test of the predictive model: For the elaboration, development and testing of the predictive model the Python programming language version 3.6.5 was used, and the dataset was divided in the proportion of 70% of the data for the training set, which is equivalent to 764 records, and 30% of the data for the test set, which corresponds to 328 records. The training of the predictive model was performed using MVS algorithm wher w the RBF kernel function was selected, and the values of C = 3.9E3, ε = 0.1, γ = 0.09 were used in the finalized model. The application of the metrics to the test set, when the predicted values were compared to the actual values,
obtained theR2 of 0.90, the RMSE of 2,252.87 kilowatt-hour
and a CV-RMSE of 18.30%.
Energy benchmarking between vocational schools: The method was applied in all schools, excluding agricultural schools and schools where no data were available for the selected period. Thus, the method was applied in 72 vocational schools. The calculation of the performance features was done by using the model previously trained with the whole dataset for predicting the monthly energy consumption of the 72 vocational schools, as well as the calculation of the respective annualised values. The other features were also calculated for all vocational schools and the final model with the complete set of features is available in (SILVA, 2019). The DEA analysis was performed using the SE-DEA and it was implemented in Python programming language. In order to compare each DMU with the others on a scale of efficiency, an analysis of the accumulated frequency of the efficiencies was created with five levels, from A to E, where A is the most
efficient. A normality test, which was applied upon the calculated efficiencies, rejected the normality hypothesis and the log-logistic distribution was used, since the Kolmogorov Smirnov test, considering a significance level of 5%,
[image:4.595.40.289.150.291.2]in a p-value of 0.4334, which means no evidence to reject the null hypothesis. Thus, the five levels of the scale were divided according to percentiles shown in Figure 2.
Figure 2. Accumulated efficiency frequency
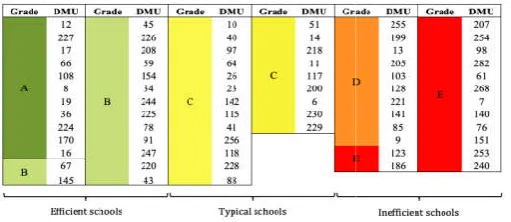
Thus, discriminating each DMU by its calculated efficiency for each category, and then considering schools clas
and B as efficient, schools level C as typical and D and E as inefficient, the final result is shown in Figure 3.
Figure 3. Efficiency scale for all DMUs
Conclusion
The proposed benchmarking scale allows a global assessment of the level of efficiency regarding to energetic metrics, permitting the formulation of policies backed by decision support tools. Nevertheless, the proposed method can be implemented for energy management in any use typology of buildings, since customized features for the portfolio are selected in order to characterize the performance.
merit of the method lies in the fact that the insertion of the other features extrapolates the analysis beyond the energy consumption and encompasses managerial issues.
schools included in the benchmarking mechanism, 26 schools were considered efficient (grades A and B), 22were considered typical schools (grades C), and 24were considered inefficient schools (grades D and E). Considering only the inefficient schools, the annual potential of energy saving,
account the waste of energy and comparing it to
energy consumption and the actual consumption, is 259,846 kilowatt hour, which represents an average value of 10,827 kilowatt-hour per school. High values of reactive energy were also observed and it summed 396,219 kilovolt
resulting in an annual value of 44,336 kilovolt
above efficient schools. Furthermore, the cumulative deviation
support vector machine and data envelopment analysis
applied upon the lated efficiencies, rejected the normality hypothesis and logistic distribution was used, since the Kolmogorov-Smirnov test, considering a significance level of 5%, resulted
[image:4.595.37.293.386.497.2]value of 0.4334, which means no evidence to reject the Thus, the five levels of the scale were divided
Figure 2. Accumulated efficiency frequency
Thus, discriminating each DMU by its calculated efficiency for each category, and then considering schools classified as A and B as efficient, schools level C as typical and D and E as inefficient, the final result is shown in Figure 3.
Figure 3. Efficiency scale for all DMUs
The proposed benchmarking scale allows a global assessment of efficiency regarding to energetic metrics, permitting the formulation of policies backed by decision Nevertheless, the proposed method can be implemented for energy management in any use typology of r the portfolio are selected in order to characterize the performance. The main merit of the method lies in the fact that the insertion of the other features extrapolates the analysis beyond the energy consumption and encompasses managerial issues. From the 72 schools included in the benchmarking mechanism, 26 schools were considered efficient (grades A and B), 22were considered typical schools (grades C), and 24were considered inefficient schools (grades D and E). Considering only the inefficient the annual potential of energy saving, taking into and comparing it to the predicted energy consumption and the actual consumption, is 259,846 kilowatt hour, which represents an average value of 10,827 of reactive energy were summed 396,219 kilovolt-ampere-reactive resulting in an annual value of 44,336 kilovolt-ampere-reactive above efficient schools. Furthermore, the cumulative deviation
in the contracting demand was
was billed monthly. It is also important to highlight that the average consumption ratio between the non
the school months is 0.66 for all the efficient schools, while this value is 0.76 for inefficient sch
energy consumption in non-school months when compared to more efficient schools. These numbers show a great potential for saving energy and financial resources, especially in the buildings classified as inefficient by the method compared to the best practices.
Acknowledgments: The authors would like to thank Centro Paula Souza for providing the data used for this work.
REFERENCES
Amasyali, K., El-Gohary, N.M.
building energy consumption prediction studies. Renew. Sustain. Energy Rev. 81, 1192
10.1016/j.rser.2017.04.095
Andersen, P., Petersen, N.C. 1993 A Procedure for Ranking Efficient Units in Data Envelopment Analysis.
Sci. 39, 1179–1297.
Angulo-meza, L., Pereira, M., Lins, E.
Methods for Increasing Discrimination in Data
Envelopment Analysis. Ann. Oper. Res. 116, 225
Banker, R.., Charnes, A., Cooper, W.(1984) Some models for
estimating technical scale innefficiencies in data
envelopment analisys. Manage. Sci. 30, 1078
Borgstein, E.H., Lamberts, R., Hensen, J.L.M. 2016. Evaluating energy performance in non
A review. Energy Build. 128, 734 10.1016/j.enbuild.2016.07.018 Brady, L., Abdellatif, M.
consumption in existing buildings. Energy Build. 149, 142–150. https://doi.org/10.1016/j.enbuild.2017.05.051 Capozzoli, A., Grassi, D., Causone, F.
models of heating energy consumption in schools for local authorities planning. Energy Build. 105, 302 https://doi.org/10.1016/j.enbuild.2015.07.024
Centro Paula Souza – CPS. athttps://www.cps.sp.gov.br/sobre Čeperić, E., Žiković, S., Čeperić, V.
forecasting of natural gas prices using machine learning and feature selection algorithms. Energy 140, 893 https://doi.org/10.1016/j.energy.2017.09.026
Charnes, A., Cooper, W.W., Rhodes, E.(1978) Mea
Efficiency of Decision Making Units, short
communication. Eur. J. Oper. Res.
Chung, W. 2011. Review of building energy
benchmarking methodologies. Appl. Energy 88, 1470 1479. https://doi.org/10.1016/j.apenergy.2010.11
Cooper, W.W., Seiford, L.M., Zhu, J.
Analysis: History, Models and Interpretations, in: Handbook on Data Envelopment Analysis. Springerlink, New York, p. 524. https://doi.org/10.1007/978
6151-8_2
Cortes, C., Vapnik, V. 1995. Support
Learn. 20, 273–297. https://doi.org/10.1007/BF00994018 Deng, H., Fannon, D., Eckelman, M.J. 2018.
modeling for US commercial building energy use: A comparison of existing statistical and machine learning algorithms using CBECS microdata. Energy Build. 163, 34–43. https://doi.org/10.1016/j.enbuild.2017.12.031
support vector machine and data envelopment analysis
in the contracting demand was 1,197 kilowatt, and this amount was billed monthly. It is also important to highlight that the average consumption ratio between the non-school months and the school months is 0.66 for all the efficient schools, while this value is 0.76 for inefficient schools, which indicates high school months when compared to These numbers show a great potential for saving energy and financial resources, especially in the buildings classified as inefficient by the method when
The authors would like to thank Centro Paula Souza for providing the data used for this work.
Gohary, N.M. 2018. A review of data-driven building energy consumption prediction studies. Renew. Sustain. Energy Rev. 81, 1192–1205. https://doi.org/
1993 A Procedure for Ranking Efficient Units in Data Envelopment Analysis. Manage.
meza, L., Pereira, M., Lins, E. 2002. Review of
Methods for Increasing Discrimination in Data
Envelopment Analysis. Ann. Oper. Res. 116, 225–242. Banker, R.., Charnes, A., Cooper, W.(1984) Some models for
ical scale innefficiencies in data
envelopment analisys. Manage. Sci. 30, 1078–1092. ., Lamberts, R., Hensen, J.L.M. 2016. Evaluating energy performance in non-domestic buildings: A review. Energy Build. 128, 734–755. https://doi.org/
/j.enbuild.2016.07.018
Brady, L., Abdellatif, M. 2017. Assessment of energy consumption in existing buildings. Energy Build. 149,
150. https://doi.org/10.1016/j.enbuild.2017.05.051 li, A., Grassi, D., Causone, F. 2015. Estimation
ng energy consumption in schools for local authorities planning. Energy Build. 105, 302–313. https://doi.org/10.1016/j.enbuild.2015.07.024
. 2018. Institucional. Availabele athttps://www.cps.sp.gov.br/sobre-o-centro-paula-souza/
ć, E., Žiković, S., Čeperić, V. 2017. Short-term forecasting of natural gas prices using machine learning and feature selection algorithms. Energy 140, 893–900. https://doi.org/10.1016/j.energy.2017.09.026
Charnes, A., Cooper, W.W., Rhodes, E.(1978) Measuring the
Efficiency of Decision Making Units, short
Eur. J. Oper. Res. 3, 429–444.
Review of building energy-use performance benchmarking methodologies. Appl. Energy 88, 1470– 1479. https://doi.org/10.1016/j.apenergy.2010.11.022 Cooper, W.W., Seiford, L.M., Zhu, J. 2011. Data Envelopment
Analysis: History, Models and Interpretations, in: Handbook on Data Envelopment Analysis. Springerlink, New York, p. 524.
Empresa de Pesquisa Energética – EPE, 2017. Balanço Energético Nacional 2017: Ano base 2016. Availabele
athttp://www.epe.gov.br/pt/publicacoes-dados-abertos/publicacoes/balanco-energetico-nacional-ben Farrell, M.J. 1957. The Measurement of Productive Efficiency.
J. R. Stat. Soc. 120, 253–290. https://doi.org/10.1016/ S0377-2217(01)00022-4
Gallagher, C. V., Bruton, K., Leahy, K., O’Sullivan, D.T.J. 2018. The suitability of machine learning to minimise uncertainty in the measurement and verification of energy savings. Energy Build. 158, 647–655. https://doi.org/ 10.1016/j.enbuild.2017.10.041
Golden, A., Woodbury, K., Carpenter, J., O’Neill, Z. 2017. Change point and degree day baseline regression models in
industrial facilities. Energy Build. 144, 30–41.
https://doi.org/10.1016/j.enbuild.2017.03.024
Jung, H.C., Kim, J.S., Heo, H. 2015. Prediction of building energy consumption using an improved real coded genetic algorithm based least squares support vector machine
approach. Energy Build. 90, 76–84.
https://doi.org/10.1016/j.enbuild.2014.12.029
Liu, J., Chen, H., Liu, J., Li, Z., Huang, R., Xing, L., Wang, J., Li, G. 2017. An energy performance evaluation methodology for individual office building with dynamic energy benchmarks using limited information. Appl.
Energy 206, 193–205. https://doi.org/10.1016/
j.apenergy.2017.08.153
Meng, Q., Mourshed, M. 2017. Degree-day based non-domestic building energy analytics and modelling should use building and type specific base temperatures. Energy
Build. 155, 260–268. https://doi.org/10.1016/
j.enbuild.2017.09.034
Molina-Solana, M., Ros, M., Ruiz, M.D., Gómez-Romero, J., Martin-Bautista, M.J. 2017. Data science for building energy management: A review. Renew. Sustain. Energy
Rev. 70, 598–609. https://doi.org/10.1016/
j.rser.2016.11.132
Olivia, G.-S., Christopher, T.A. 2015. In-use monitoring of buildings: An overview and classification of evaluation methods. Energy Build. 86, 176–189. https://doi.org/ 10.1016/ j.enbuild.2014.10.005
Paudel, S., Elmitri, M., Couturier, S., Nguyen, P.H., Kamphuis, R., Lacarrière, B., Le Corre, O. 2017. A relevant data selection method for energy consumption prediction of low energy building based on support vector
machine. Energy Build. 138, 240–256.
https://doi.org/10.1016/j.enbuild.2016.11.009
Pérez-Lombard, L., Ortiz, J., González, R., Maestre, I.R. 2009 A review of benchmarking, rating and labelling concepts
within the framework of building energy certification schemes. Energy Build. 41, 272–278. https://doi.org/ 10.1016/j.enbuild.2008.10.004
Pérez-Lombard, L., Ortiz, J., Pout, C. 2008. A review on buildings energy consumption information. Energy Build. 40, 394–398. https://doi.org/10.1016/j.enbuild.2007.03.007 Robinson, C., Dilkina, B., Hubbs, J., Zhang, W.,
Guhathakurta, S., Brown, M.A., Pendyala, R.M. 2017. Machine learning approaches for estimating commercial building energy consumption. Appl. Energy 208, 889–904. https://doi.org/10.1016/j.apenergy.2017.09.060
Silva, H.L.N. 2018. Raw data use, occupation and energy in Technical Schools in São Paulo, Brazil. Mendeley Data,
V1. Availabele at doi: http://dx.doi.org/10.17632/
gc9yvgb65k
Silva, H.L.N. 2019. Energy variables for benchmarking in technical schools in São Paulo, Brazil. Mendeley Data, v1. Available at doi:http://dx.doi.org/10.17632/zwv5d46pp5.1 Spendolini, M.J. 1992. The benchmarking book. Amacom,
New York
Universidade Federal de Santa Catarina - USFC. 2016. Laboratório de Eficiência Energética em Edificações (LABEEE) Arq. Climáticos Inmet 2016. Available at
http://www.labeee.ufsc.br/downloads/arquivos-climaticos/inmet2016
Ürge-Vorsatz, D., Novikova, A., Köppel, S., Boza-Kiss, B. 2009. Bottom-up assessment of potentials and costs of CO2emission mitigation in the buildings sector: Insights into the missing elements. Energy Effic. 2, 293–316. https://doi.org/10.1007/s12053-009-9051-0
Wang, B., Xia, X. 2015. Optimal maintenance planning for building energy efficiency retrofitting from optimization and control system perspectives. Energy Build. 96, 299– 308. https://doi.org/10.1016/j.enbuild.2015.03.032
Wang, Z., Srinivasan, R.S. 2017. A review of artificial intelligence based building energy use prediction: Contrasting the capabilities of single and ensemble prediction models. Renew. Sustain. Energy Rev. 75, 796– 808. https://doi.org/10.1016/j.rser.2016.10.079
Wei, Y., Zhang, X., Shi, Y., Xia, L., Pan, S., Wu, J., Han, M., Zhao, X. 2018. A review of data-driven approaches for
prediction and classification of building energy
consumption. Renew. Sustain. Energy Rev. 82, 1027–1047. https://doi.org/10.1016/j.rser.2017.09.108
Zhang, F., Deb, C., Lee, S.E., Yang, J., Shah, K.W. 2016. Time series forecasting for building energy consumption using weighted Support Vector Regression with differential evolution optimization technique. Energy Build. 126, 94– 103. https://do.org/10.1016/j.enbuild.2016.05.028